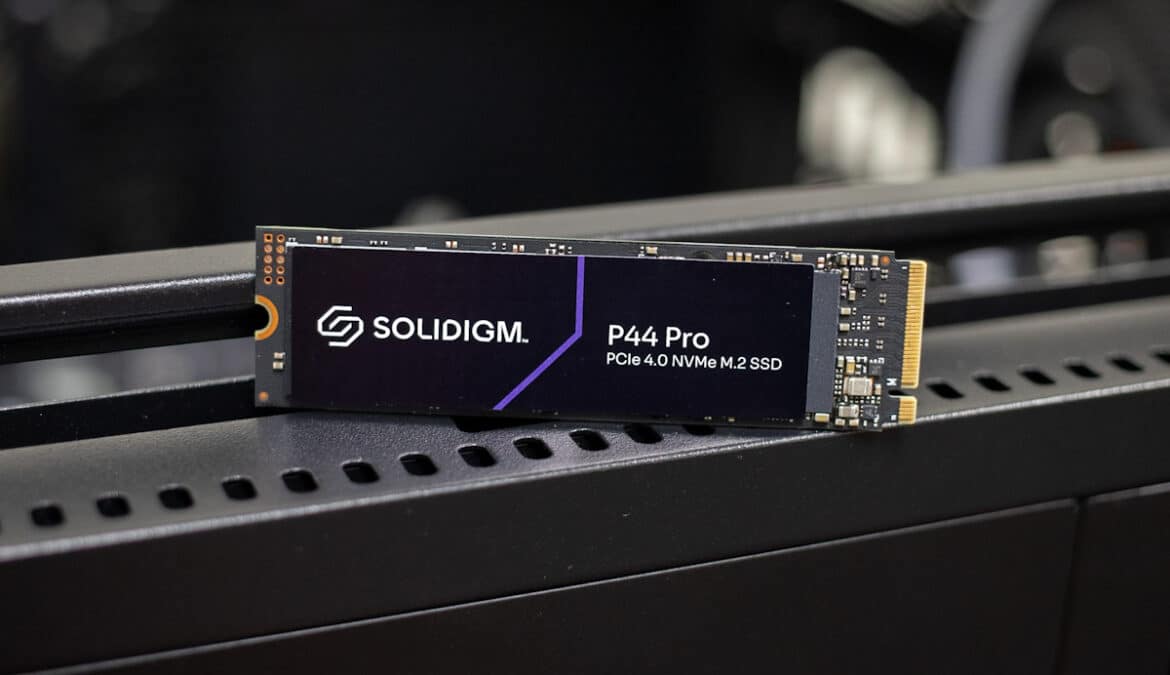
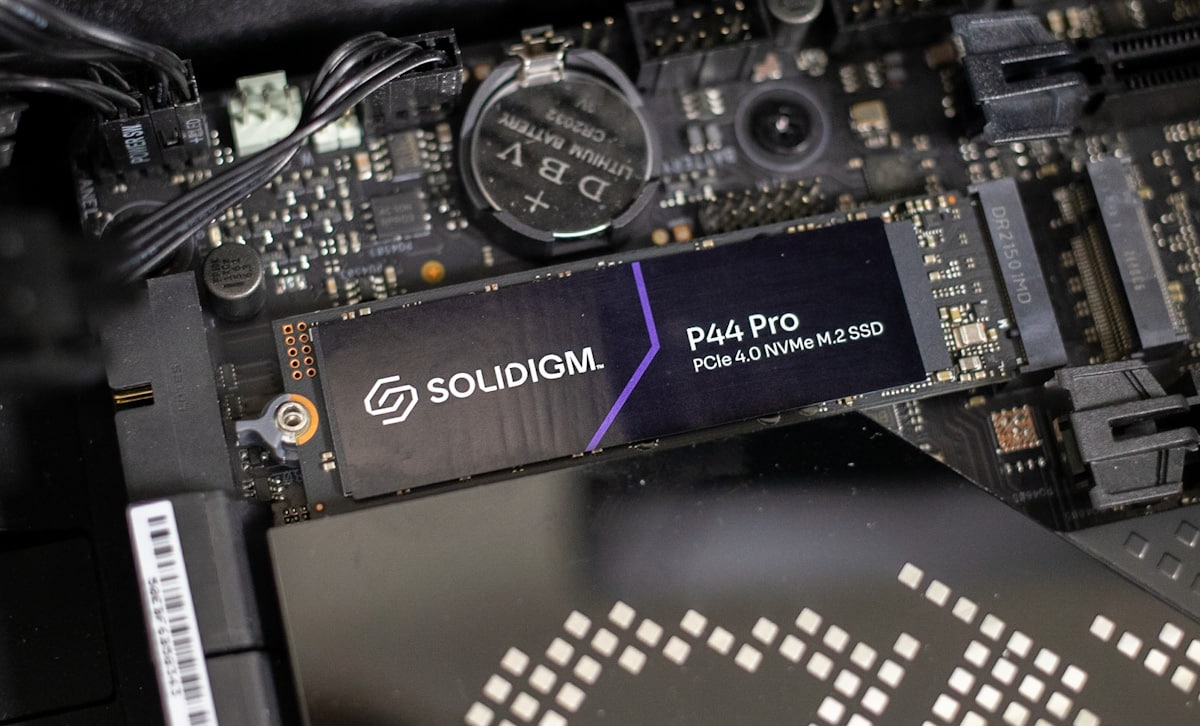
The Solidigm P44 Pro is the company’s new flagship high-performance client SSD. Purpose-built for the most demanding workloads and enthusiasts, the P44 Pro is a progression of the SK hynix Platinum P41. Though it is architecturally the exact same drive as the Platinum P41, it comes with newly updated firmware. Featuring capacities up to 2TB, the new Gen4 SSD is equipped with 176-layer NAND and an ACNS075 PHC631.00S-1 controller.
The Solidigm P44 Pro is the company’s new flagship high-performance client SSD. Purpose-built for the most demanding workloads and enthusiasts, the P44 Pro is a progression of the SK hynix Platinum P41. Though it is architecturally the exact same drive as the Platinum P41, it comes with newly updated firmware. Featuring capacities up to 2TB, the new Gen4 SSD is equipped with 176-layer NAND and an ACNS075 PHC631.00S-1 controller.
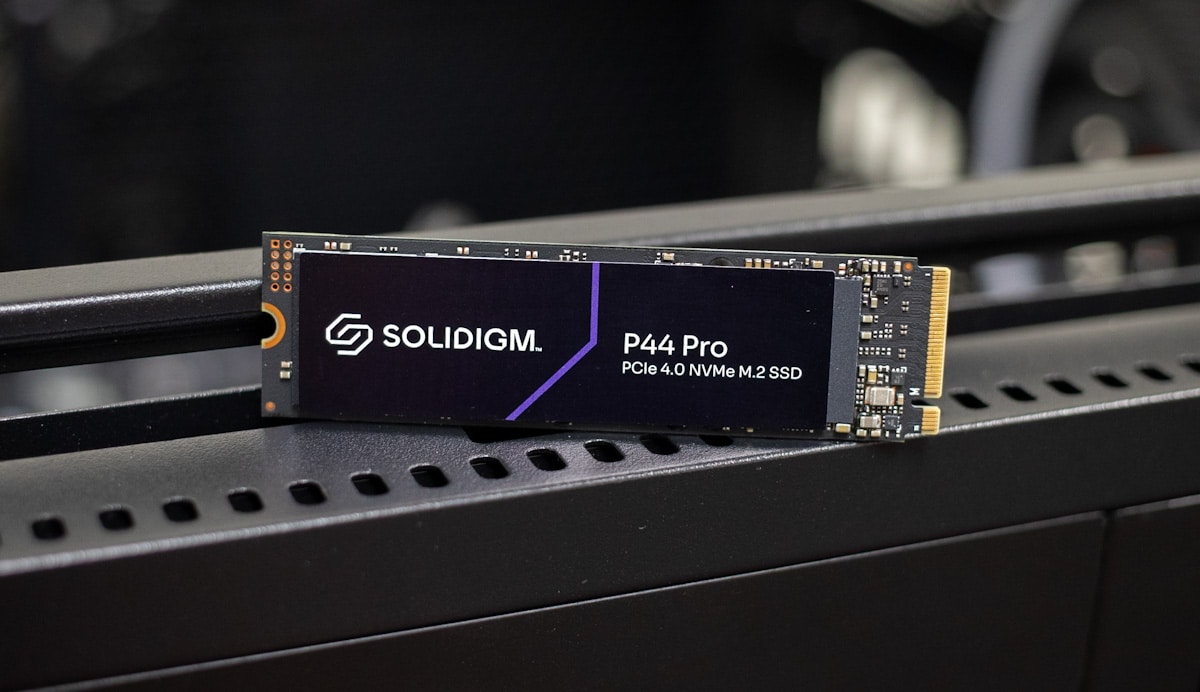
That said, we are most excited to see how the Solidigm P44 Pro compares to Samsung 990 Pro. Both drives launched during the same week and both target the premium application workloads space, so it will certainly be interesting to see how they match up in our benchmarking below.
Solidigm P44 Pro Features
Solidigm quotes their new drive with sequential speeds up to 7GB/s read and 6.5GB/s write across all capacities, with the exception of 512GB write speeds, which is specced at 4.7GB/s read. It does all of these while drawing just 5.3W in power consumption.
Nonetheless, these are actually more modest numbers when looking at the performance-driven SSD sphere, as the Samsung 990 Pro was quoted at 7.45GB/s read and 6.9GB/s write (though what the company has on paper is often different than what we actually see in results).
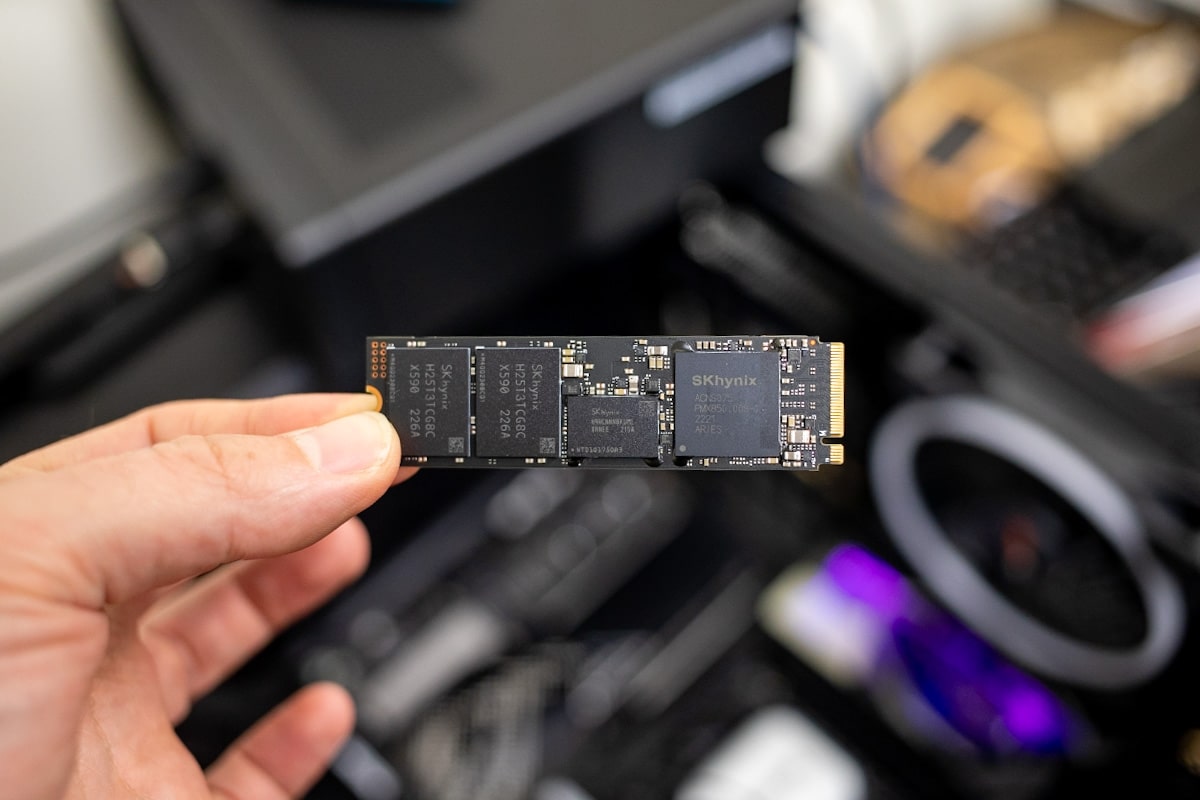
The Solidigm P44 Pro has an MTBF of 1.6 million hours and an endurance rating of 1,200TBW for the high-capacity model. It also features AES 256-bit Encryption and TCC Pyrite Support.
Backed by a 5-year warranty, the P44 Pro is launching with an MSRP of $79.99 (512GB), $129.99 (1TB) $234.99 (2TB). We will be looking at the 2TB model for this review.
Solidigm Storage Tool
Like the recently reviewed Solidigm P41 Plus, all of their SSDs are bundled with the Solidigm Storage Tool. This software displays detailed information about their drives, including model number, serial number, firmware, protocol, temperature, partitions, and drive life. The SSD life is particularly useful, as it indicates when you might need to replace the drive. This will allow you to prepare for potential failures, like backing up data more often.
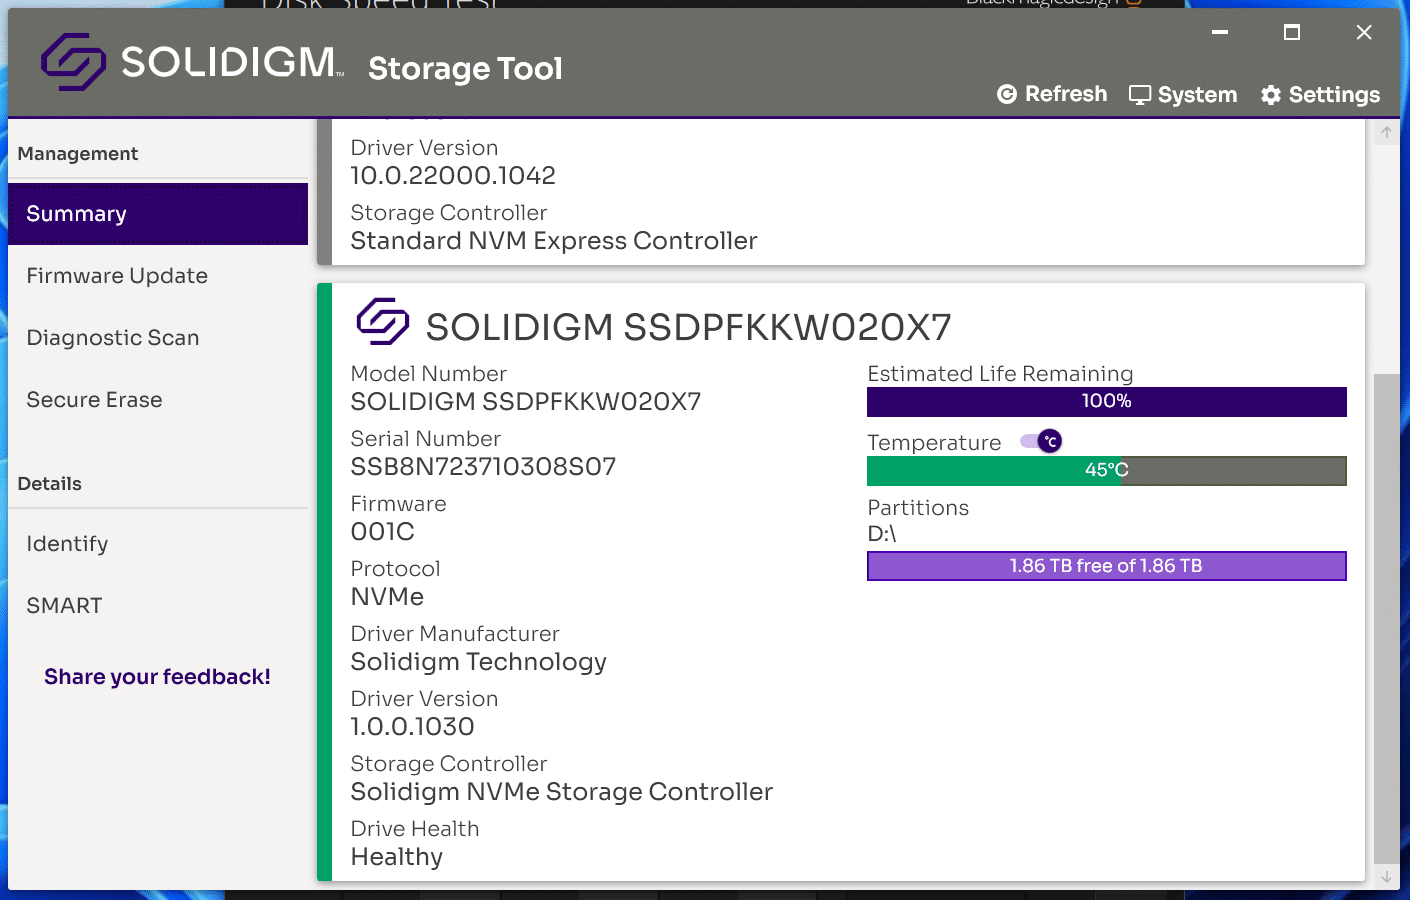
The SSD tool also allows users to update the firmware, run a diagnostic scan, secure erase the drive, boost performance through supported options, and handle host-managed cache. Solidigm also plans to consistently update their SSDs so users will have the best performance possible.
Solidigm P44 Pro Specifications
| Available Capacities | 512GB | 1TB | 2TB |
| Performance Specifications | |||
| Sequential Bandwidth – 100% Read (up to) |
7,000MB/s | 7,000MB/s | 7,000MB/s |
| Sequential Bandwidth – 100% Write (up to) | 4,700MB/s | 6,500MB/s | 6,500MB/s |
| Power – Active Sequential Write | 7.5 W | ||
| Power – Idle/PS3 | < 50 mW | ||
| Power – Idle/PS4 | < 5 mW | ||
| Reliability | |||
| Vibration – Operating | 2.0 C (20-2000Hz) | ||
| Vibration – Non-Operating | 2.0 C (20-2000Hz) | ||
| Shock (Operating and Non- Operating) | 1,500 C (Max) at 0.5 msec 1,500 C (Max) at 0.5 msec | ||
| Operating Temperature Range | 0°C to 70°C | ||
| Operating Temperature (Maximum) | 70 °C | ||
| Operating Temperature (Minimum) | 0 °C | ||
| Endurance Rating (Lifetime Writes) | 500 TBW | 750 TBW | 1200 TBW |
| Mean Time Between Failures (MTBF) | 1.6 million hours | ||
| Uncorrectable Bit Error Rate (UBER) | < 1 sector per 10^15 bits read | ||
| Warranty Period | 5 years | ||
| Package Specifications | |||
| Form Factors | M.2 22 x 80mm | ||
| Interface | PCIe 4.0 x4 | NVMe 1.4 | ||
| Advanced Specifications | |||
| Hardware Encryption | AES 256-bit Encryption, TCC Pyrite Supported | ||
| End-to-End Data Protection | Supported | ||
| NSIT Secure Erase | Supported | ||
Solidigm P44 Pro Performance
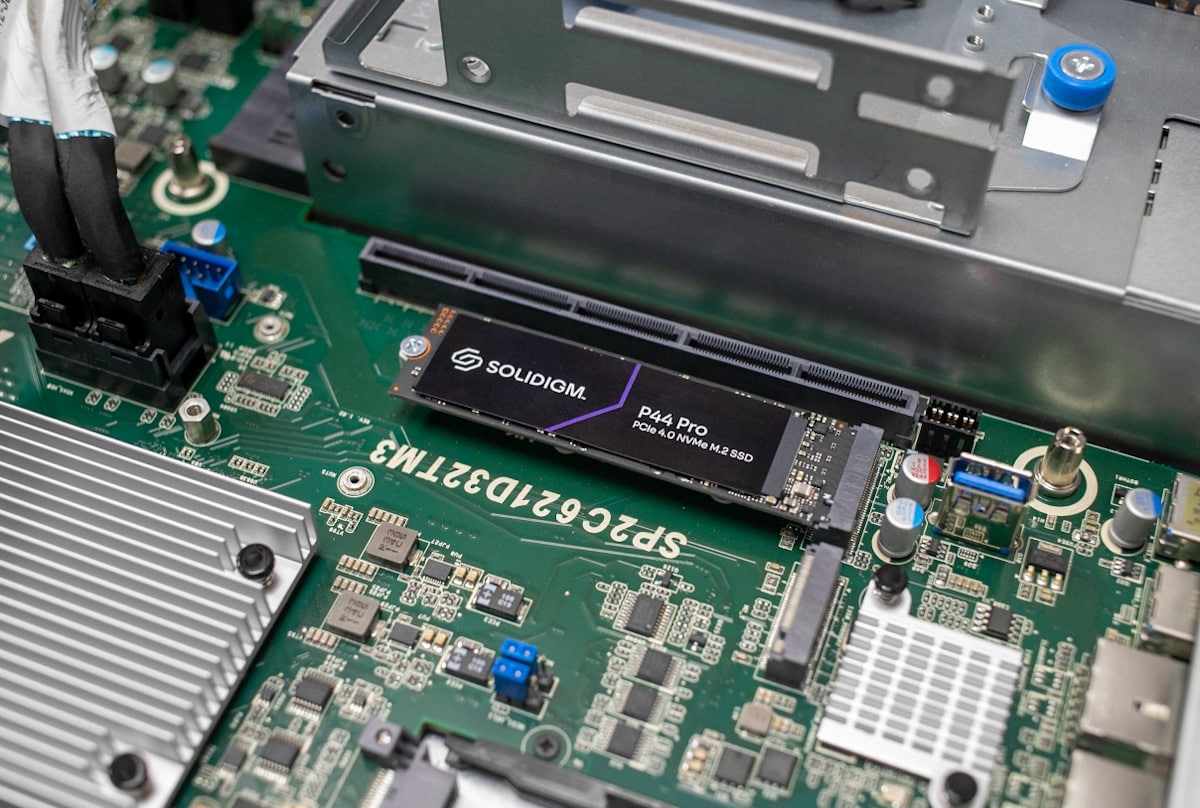
For database and synthetic testing, we leverage the Lenovo ThinkSystem SR635 server, equipped with an AMD 7742 CPU and 512GB of 3200Mhz DDR4 memory. NVMe is tested natively through an M.2 to PCIe adapter card in the edge-card slot. A large focus is put on drive latency across the entire load range of the drive, not just at the smallest QD1 (Queue-Depth 1) levels. We do this because many of the common consumer benchmarks don’t adequately capture end-user workload profiles. For our added BlackMagic Disk Speed Test performed in Windows, we use our self-built StorageReview desktop.
We are reviewing the 2TB version of the Solidigm P44 Pro drive and will be comparing it to the following PCIe Gen4x4 drives:
Solidigm P44 Pro SQL Server Performance
Each SQL Server VM is configured with two vDisks: 100GB volume for boot and a 500GB volume for the database and log files. From a system resource perspective, we configured each VM with 16 vCPUs, 64GB of DRAM and leveraged the LSI Logic SAS SCSI controller. While our Sysbench workloads tested previously saturated the platform in both storage I/O and capacity, the SQL test is looking for latency performance.
This test uses SQL Server 2014 running on Windows Server 2012 R2 guest VMs and is stressed by Quest’s Benchmark Factory for Databases. StorageReview’s Microsoft SQL Server OLTP testing protocol employs the current draft of the Transaction Processing Performance Council’s Benchmark C (TPC-C), an online transaction-processing benchmark that simulates the activities found in complex application environments.
The TPC-C benchmark comes closer than synthetic performance benchmarks to gauging the performance strengths and bottlenecks of storage infrastructure in database environments. Each instance of our SQL Server VM for this review uses a 333GB (1,500 scale) SQL Server database and measures the transactional performance and latency under a load of 15,000 virtual users.
SQL Server Testing Configuration (per VM)
- Windows Server 2012 R2
- Storage Footprint: 600GB allocated, 500GB used
- SQL Server 2014
-
- Database Size: 1,500 scale
- Virtual Client Load: 15,000
- RAM Buffer: 48GB
- Test Length: 3 hours
-
- 2.5 hours preconditioning
- 30 minutes sample period
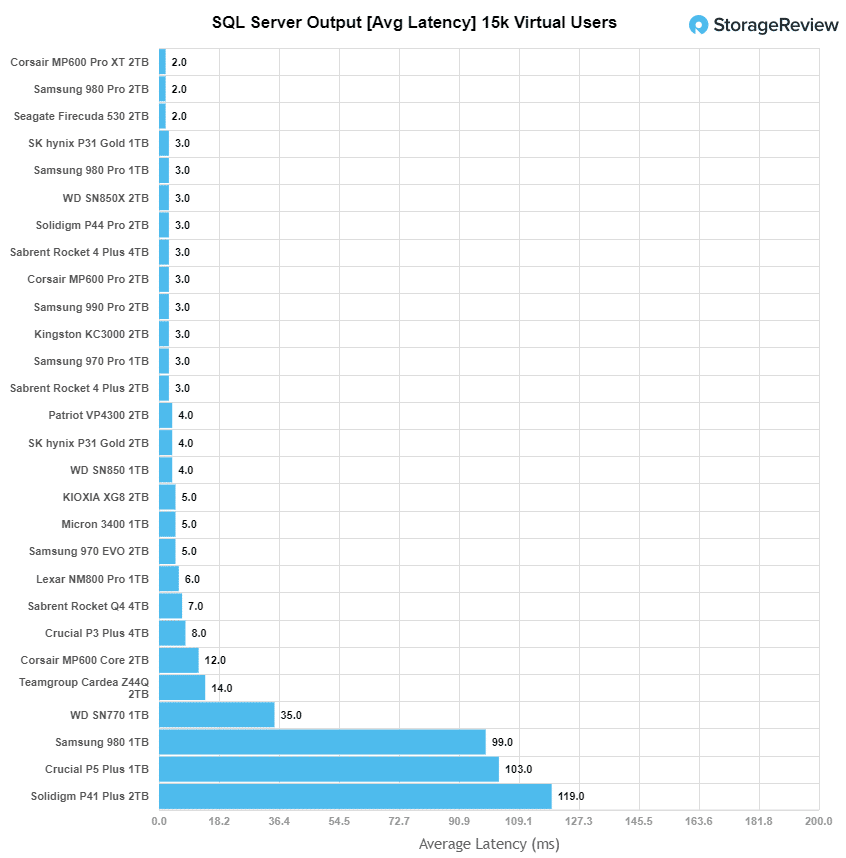
Starting with SQL average latency, the Solidigm P44 Pro posted 3ms, which placed it in the upper part of the consumer NVMe SSD leaderboard alongside the Samsung 990 Pro.
BootBench
BOOT-BENCH-1 is a workload profile adopted by OCP to profile SSDs that are designed for server boot duty. While this is intuitively a job for enterprise SSDs, client SSDs are often selected for their performance, capacity, and cost combination. The boot drive issue is germane not just to hyperscalers, but also to server and storage system providers as well as they face similar challenges.
This boot workload executes a relatively intense test plan that fills the drive entirely with writes before testing a read-heavy workload sequence. For each test, it performs a 32K random read async operation alongside a 15MiB/s synchronous 128k random write as well as a 5MiB/s synchronous 128k random write/trim background workload. The script starts with the random-read activity at a 4-job level and scales up to 256-jobs at its peak. The final result is the read-operations performed during its peak run.
The OCP goal for this benchmark is a pass/fail at 60K read IOPS. Most drives we test will far exceed the minimum, but the results are instructive regardless.
| SSD | Read IOPS |
|---|---|
| Solidigm P44 Pro | 211,999 IOPS |
| Sk hynix Platinum P41 | 220,884 IOPS |
| Samsung 990 Pro | 176,677 IOPS |
| WD SN850X | 219,883 IOPS |
| Sabrent Rocket 4 Plus | 162,230 IOPS |
In this benchmark, the Solidigm P44 Pro performs well, surprisingly surpassing the 990 Pro by about 35,000 IOPS, while falling behind the SN850X by about 8,000 IOPS. The leader though is the SK Hynix Platinum P41, measuring nearly 221,000 IOPS. The gap down to the Sabrent, which is being used here as a proxy for Phison E18 SSDs, is substantial, with nearly a 50K IOPS delta.
VDBench Workload Analysis
When it comes to benchmarking storage devices, application testing is best, and synthetic testing comes in second place. While not a perfect representation of actual workloads, synthetic tests do help to baseline storage devices with a repeatability factor that makes it easy to do an apples-to-apples comparison between competing solutions. These workloads offer a range of different testing profiles ranging from “four corners” tests, common database transfer size tests, to trace captures from different VDI environments.
All of these tests leverage the common vdBench workload generator, with a scripting engine to automate and capture results over a large compute testing cluster. This allows us to repeat the same workloads across a wide range of storage devices, including flash arrays and individual storage devices. Our testing process for these benchmarks fills the entire drive surface with data, then partitions a drive section equal to 1% of the drive capacity to simulate how the drive might respond to application workloads. This is different from full entropy tests which use 100% of the drive and take them into a steady state. As a result, these figures will reflect higher-sustained write speeds.
Profiles:
- 4K Random Read: 100% Read, 128 threads, 0-120% iorate
- 4K Random Write: 100% Write, 64 threads, 0-120% iorate
- 64K Sequential Read: 100% Read, 16 threads, 0-120% iorate
- 64K Sequential Write: 100% Write, 8 threads, 0-120% iorate
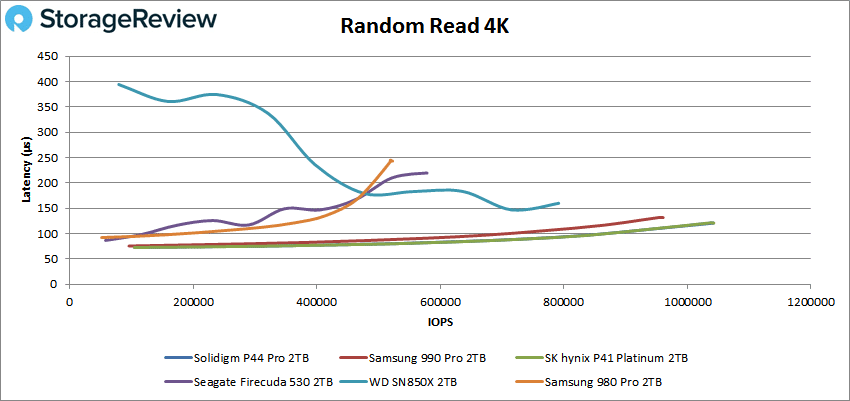
Starting with 4k random read, the Solidigm P44 Pro showed identical performance to the SK Hynix Platinum P41 (its predecessor), as you can barely see the blue line in our charts below. Nonetheless, it had a peak of 1.04 million IOPS at a latency of 121.1µs, which was noticeably better than the Samsung 990 Pro.
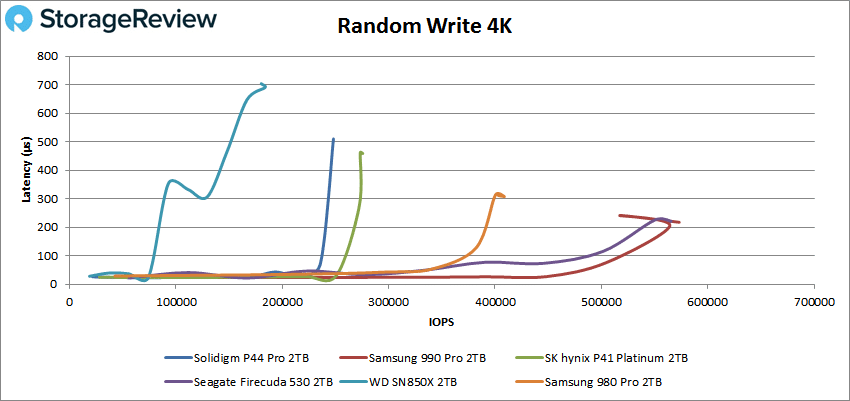
For 4K random write, Solidigm P44 Pro fell back quite a bit, placing 2nd last and ending with 248K IOPS and 510.2ms in latency.
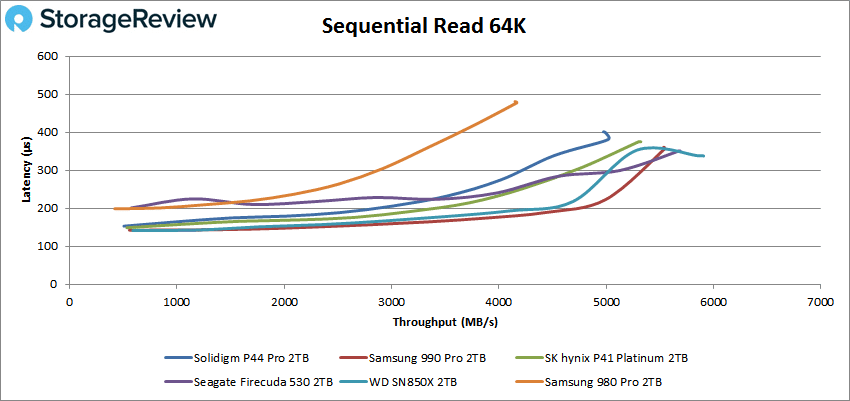
Switching to sequential workloads, where we look at our 64K tests, the Solidigm P44 Pro showed strong performance, though a bit behind the SK Hynix Platinum and Samsung drives. In reads, it peaked at 80K IOPS (or 5.02GB/s) with a latency of 380.7µs.
 In 64K sequential writes, the Solidigm P44 Pro moved to last place, posting a peak score of just 18K IOPS or 1.12GB/s at a latency of 885.4µs before taking a slight dip in performance. Again, it trailed the Platinum P41.

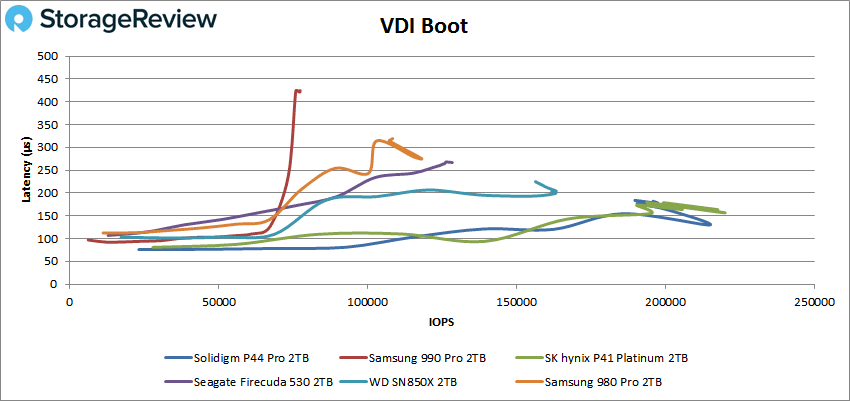
Next, we looked at our VDI benchmarks, which are designed to tax the drives even further. These tests include Boot, Initial Login, and Monday Login. Starting with Boot, the Solidigm P44 Pro performed very well, though still trailing the Platinum P41. Here it peaked at 215K IOPS at 130.1ms, which was much better than the 990 Pro.
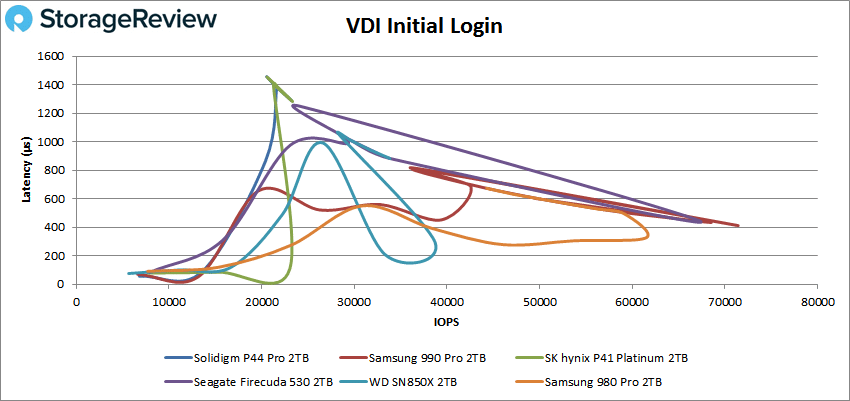
 Our VDI Initial Login produced some messy results in our charts, as usual. That said the Solidigm P44 Pro struggled as it approached the ~18K IOPS mark, ending with a disappointing peak of 23K IOPS with a latency of 1,288µs.
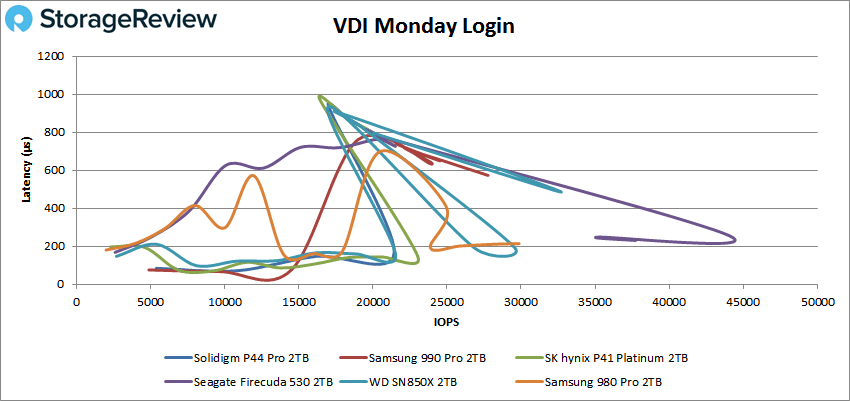
Finally, VDI Monday Login (again, results were almost impossible to decipher unless you have the source files as we do) saw the Solidigm P44 Pro peak at 20K IOPS (which is near the bottom of the leaderboard) with a latency of 779µs.
Blackmagic Disk Speed Test
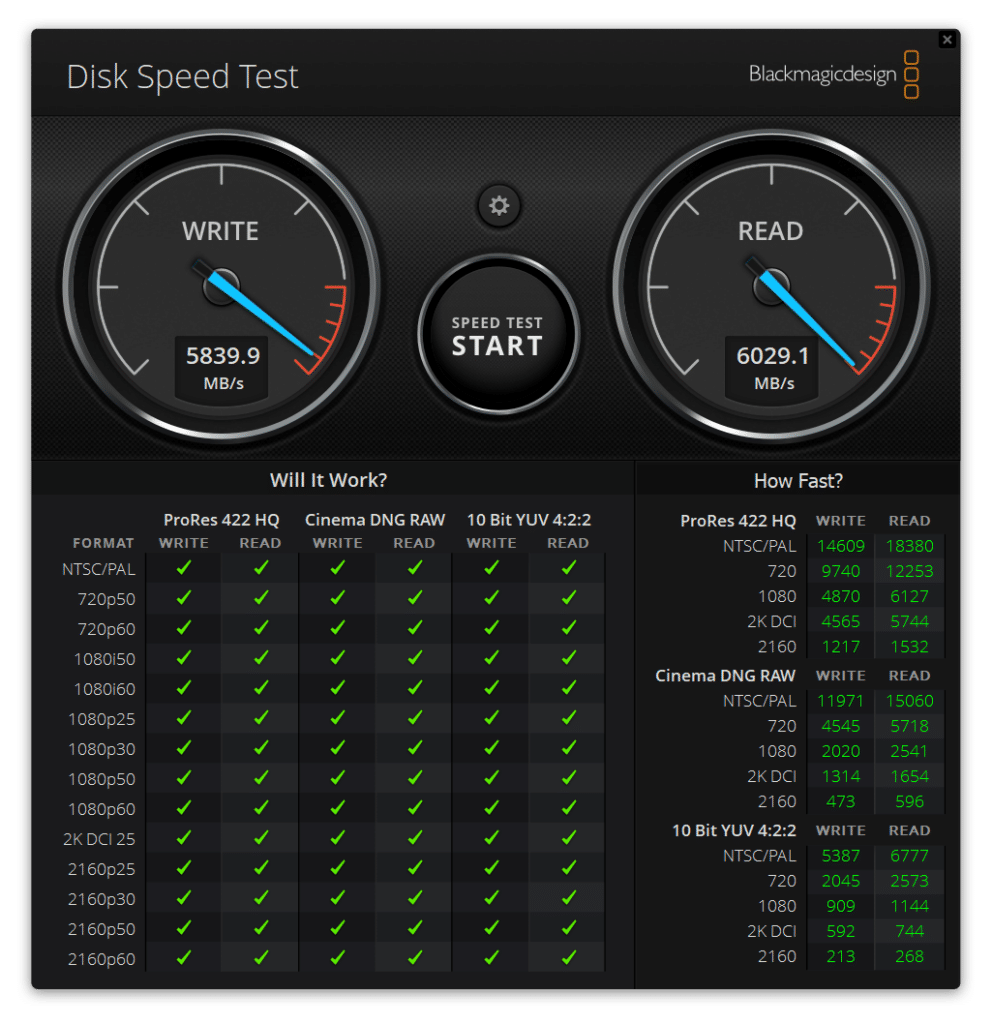
We measured performance inside a Windows 11 environment on our consumer test platform. Here, the Solidigm P44 Pro was able to reach 6.03GB/s read and 5.84GB/s write. These results were a hair behind the SK Hynix P41 Platinum, which posted 6.05GB/s read and 5.87GB/s write. In addition, the Samsung 990 Pro delivered 5.67GB/s read and 5.94GB/s write.
Conclusion
The Solidigm P44 Pro was released adjacent to the SK hynix Platinum P41. Though it is architecturally the same as the P41 (featuring 176-layer NAND and an ACNS075 PHC631.00S-1 controller), it has a different firmware payload. It also has an MTBF of 1.6 million hours and an endurance rating of 1,200TBW (for the 2TB model), while featuring AES 256-bit Encryption and TCC Pyrite Support.
As far as performance goes, the P44 Pro showed identical results to the P41 in our random 4K read test; however, it trailed in most other places. Highlights include: 1.04 million IOPS in 4K read, 248K IOPS in 4K write, 5.02GB/s in sequential 64K read, and just 1.12GB/s in sequential 64K writes.
For our VDI benchmarks, the Solidigm drive showed peaks of 215K IOPS in boot, 22K IOPS in initial login, and 20K IOPS in Monday login. For our Blackmagic test, the Solidigm P44 Pro posted 6.03GB/s read and 5.84GB/s write compared to the Platinum P41’s 6.05GB/s read and 5.87GB/s write, which is effectively the same for that test. The P44 Pro did offer better reads than the Samsung 990 Pro’s 5.67GB/s.
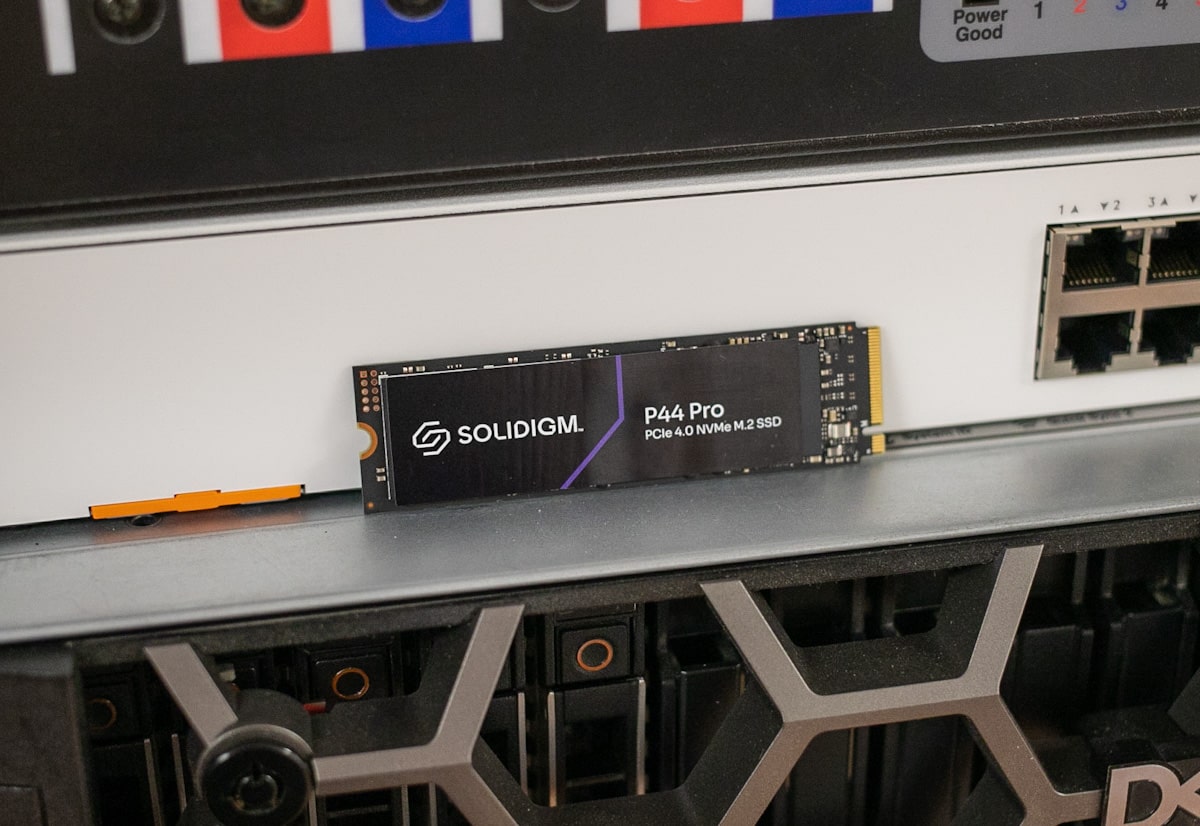
Though we were hoping to see a little more from the Solidigm P44 Pro in performance, the P44 Pro is still a competitive drive for the heavy data user. This is good for the industry as there are at least four or five really good options out there, so another good SSD is welcomed. In addition, Solidigm has a very capable software tool for drive management. Samsung and WD do as well, but none of the other Phison drives currently offer this.
Ultimately, end-user perceived system performance will be similar across the board with these drives, regardless of which drive you decide to put in a high-end rig. As a result, this puts great importance on pricing. Solidigm indicates an MSRP of $79.99 for the 512GB model, and $129.99 and $234.99 for the 1TB and 2TB, respectively. The SK hynix cousin currently goes for $104, $150, and $254, respectively, on Amazon, and the Samsung 990 Pro is listed as $170 (1TB), and $290 (2TB).
Coupling all of this with the fact that it worked in VMware (whereas we couldn’t get it to work with the Platinum P41), the Solidigm P44 Pro is a solid option for any user looking for a premium PCIe Gen4 drive at a competitive price tag.
Engage with StorageReview
Newsletter | YouTube | Podcast iTunes/Spotify | Instagram | Twitter | TikTok | RSS Feed

