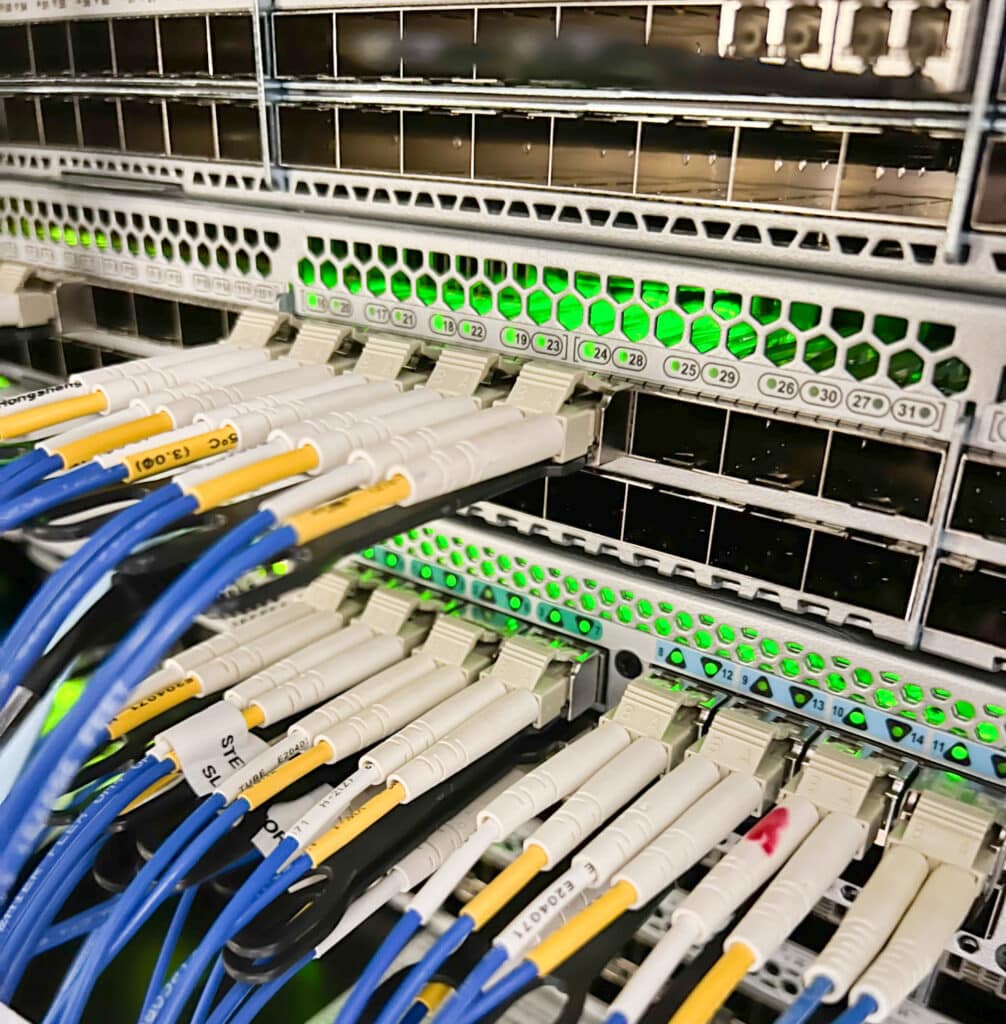
HPE has introduced HPE GreenLake for Storage Fabric Management, which provides cloud-based management of storage fabrics leveraging the HPE as-a-Service (aaS) model. HPE GreenLake for Storage Fabric Management accelerates the tasks associated with configuring, monitoring, and managing a storage networking fabric and provides advanced automation and orchestration capabilities.
HPE has introduced HPE GreenLake for Storage Fabric Management, which provides cloud-based management of storage fabrics leveraging the HPE as-a-Service (aaS) model. HPE GreenLake for Storage Fabric Management accelerates the tasks associated with configuring, monitoring, and managing a storage networking fabric and provides advanced automation and orchestration capabilities.
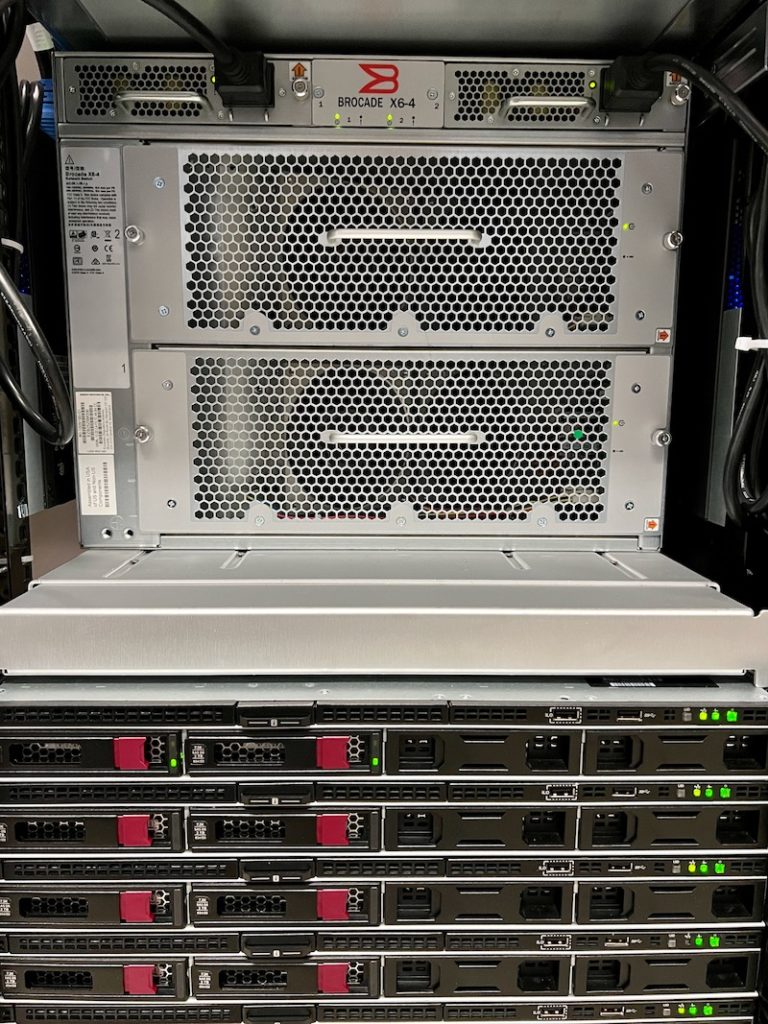
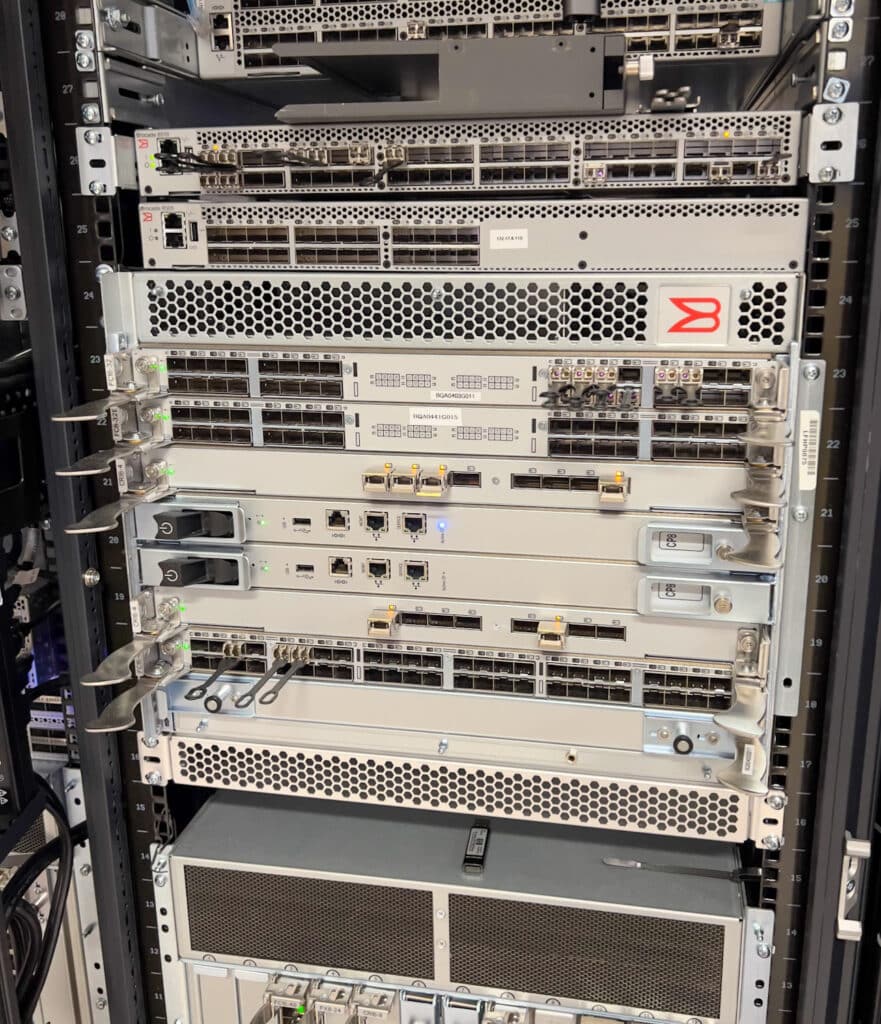
Today the new management software leverages HPE’s deep partner relationship with Brocade Fibre Channel switches and SANs. Of course, HPE plans to grow its support across the landscape, which will eventually include HPE M-Series Ethernet switching, Aruba networking, and Cisco. NVMe end-to-end solutions will be supported in a future release.
Get To Know HPE GreenLake
HPE announced HPE GreenLake in June 2020 as an IT consumption model designed to provide businesses with a flexible, scalable solution for managing the IT infrastructure and applications. HPE GreenLake combines the benefits of on-premises infrastructure with the flexibility and agility of the cloud.
Simply put, HPE GreenLake is a hybrid cloud platform that allows organizations to consume IT resources and services on-demand with a cost structure where users only pay for what they consume. HPE GreenLake supports a growing list of solutions, including infrastructure, storage, compute power, and services such as data protection and artificial intelligence (AI).
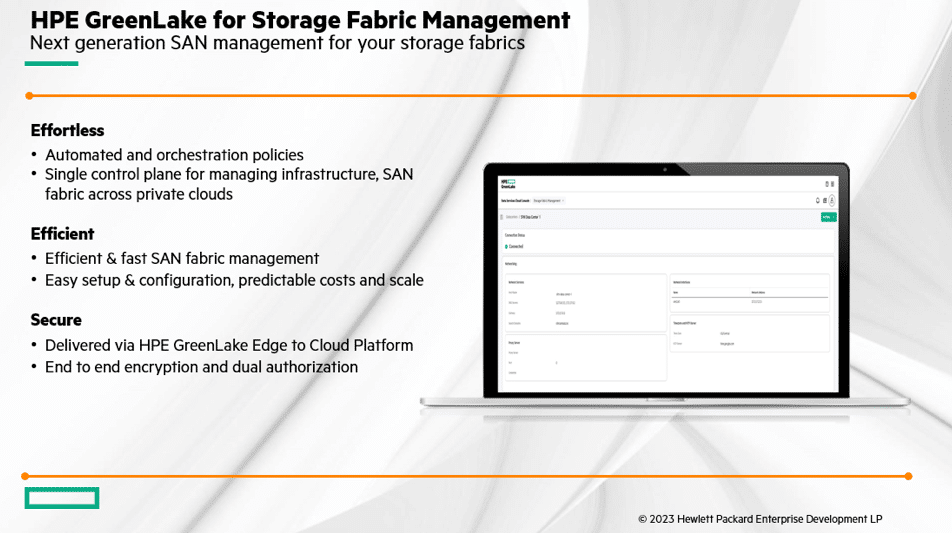
HPE GreenLake was designed to be scalable and flexible, allowing customers to scale IT resources up or down as needed. This flexibility enables customers to quickly adapt to changing business requirements and offers a range of pre-configured infrastructure options that can be adjusted to match workload demands.
The consumption model gives businesses the information they need to manage capital expenses and run the company more predictably with the flexibility to control operational costs. Making life easier for business customers, HPE takes care of the management and maintenance of the overall infrastructure, relieving businesses from the task of day-to-day operations.
Since the launch, HPE GreenLake has been adding services and supporting partner solutions such as VMware and Red Hat, including support for hardware solutions from NVIDIA and KIOXIA. Additionally, HPE kicked off HPE GreenLake for Storage Day in April by announcing an expanded HPE GreenLake for Block Storage, introducing HPE GreenLake for File Storage, and launching HPE GreenLake Protection Services. Still offering all the functionality of TrueNAS CORE, SCALE brings new CORE containerized support without losing out on functionality—the ability to deploy Docker containers and SCALE and CORE apps through the app manager.
Each HPE GreenLake announcement focused on simplicity, flexibility, and operational efficiency. And with the HPE GreenLake for Storage Fabric Management release, HPE aims to ease the management of storage networks.
Customers Drive the Push for Simplicity
HPE GreenLake has continued to respond to the enormity of data created every second, adding features that can meet the demands for storing, managing, and protecting data. Storage vendors have ramped up developing innovative storage solutions with greater density, a smaller footprint, and faster network connectivity and bandwidth. The market is awash with new options to store and manage data with cloud services such as Infrastructure-as-a-Service (IaaS) platforms.
The advantages of cloud technology are proven repeatedly, but the impact on managing traditional SANs needs to be addressed. Let’s take a look at some of the issues clouding SAN management.
Customers continue to roll out hybrid cloud environments, combining on-premises infrastructure with cloud-based resources. Integrating on-premises SANs with cloud storage solutions introduces complexity and demand for administrators to maintain expertise in traditional SAN management and cloud storage.
Distributing data across multiple locations is a great benefit of cloud storage. However, that use results in additional complexity for data management. And it’s not just distributing data across the cloud, but most likely means managing data storage across multiple cloud regions, on-premises SANs, and other cloud storage platforms.
Multi-cloud environments introduce different complexities to SAN management as organizations leverage multiple cloud providers to take advantage of specific features, costs, or geographic locations. Add to that the interoperability, data migration, and data consistency challenges. Administrators quickly learn that each cloud provider has their own storage offerings and management interfaces.
The cloud is less inexpensive than everyone thought, so cost optimization has become a hot topic as organizations need help managing the sheer amount of data stored in these cloud environments. Administrators mitigate those costs by migrating data between different storage tiers, selecting the correct storage class for different data types, and optimizing data access patterns. Cost management is the process of ongoing monitoring, analysis, and adjustments, which can be difficult in a multi-cloud or hybrid environment.
Security and compliance are significant concerns for administrators. Storing data in the proper region is critical while being aware that data movement meets regulatory requirements. Managing access controls, encryption, data governance, and compliance policies in multi-cloud and hybrid cloud environments requires specialized skills with constantly updated training.
Despite these challenges, cloud technology offers opportunities to simplify SAN management. For example, a cloud-based storage management solution could be the tool needed to manage, monitor, and maintain cloud storage environments.
SANs Are Not Easy
But it’s not just cloud technology that impacts SAN management. SANs can be challenging to manage for many reasons. SANs are highly complex and include components from various vendors, including switches, routers, storage arrays, Host Bus Adapters (HBAs), and the ever-changing network requirements. Administrators must maintain a deep understanding of configuring and managing each component and know how to integrate multiple vendor hardware into a manageable solution.
Designed to be scalable to support large volumes of storage capacity, SANs provide high-performance, lossless data access. As storage requirements increase, managing SAN scalability becomes a significant challenge. Provisioning storage resources, ensuring load-balancing across the SAN, and maintaining performance levels add complexity and require planning and coordination.
SANs are comprised of components from multiple vendors and include several generations of equipment with disparate software requirements and potentially numerous management platforms. Optimizing SAN performance when dealing with the many facets of vendor hardware is critical to business success. Dealing with all the variables makes tuning bandwidth allocation, prioritization, reducing latency, and keeping accurate configuration control a full-time job.
Because SANs are a critical component of an organization’s IT infrastructure and require mitigating the risk of data loss through redundancy, backup strategies, disaster recovery planning, and replication, SAN administrators must have specialized skills, knowledge, and expertise. Managing SANs involves more than storage, requiring a detailed understanding of networks, performance tuning, troubleshooting, and storage technologies. And, if there’s time, professional development.
Overall, the complexity, scalability, compatibility, performance optimization, expertise requirements, and risk factors associated with SANs contribute to the difficulties in managing them effectively. However, with proper planning, documentation, monitoring tools, and skilled personnel, these challenges can be addressed, and SANs can provide reliable and efficient storage solutions for organizations.
What Makes a Great SAN Management Tool?
Developing a SAN manager involves critical consideration. A SAN manager is a dedicated software tool designed to simplify and streamline a SAN infrastructure. There are many reasons why an administrator needs a SAN manager, including:
- A centralized SAN management tool gives administrators a view of the entire SAN infrastructure from a single point of control.
- A SAN manager can simplify configuration management for most devices. A SAN manager provides administrators with the tools to create and manage storage volumes, assign storage to servers or VMs, and allocate resources based on the organization’s requirements.
- SAN managers should provide real-time monitoring and reporting capabilities to track performance and visibility of bandwidth utilization, IOPS, latency, and throughput. Administrators can use this detail to identify bottlenecks and performance issues relating to resource allocation.
- SAN managers should offer automation and orchestration capabilities that enable administrators to automate routine tasks and workflows.
Overall, a SAN manager simplifies the management and administration of a SAN infrastructure, providing centralized control, performance monitoring, resource allocation, configuration consistency, troubleshooting capabilities, and automation. By leveraging a SAN manager, organizations can effectively manage their storage resources, optimize performance, and ensure the availability and reliability of their SAN environment.
HPE GreenLake for Storage Fabric Management was developed after listening to customers voice their frustration with existing management solutions, and there are many. Customers need a management platform that makes it easy to configure, monitor, and manage SAN fabrics with embedded tools that illustrate the fabric, provide network discovery, reduce overall costs and overhead, reduce provisioning errors, and improve fabric resiliency. And they want this presented in a single, easy-to-use management tool.
HPE GreenLake for Storage Fabric Management Features
With HPE GreenLake for Storage Fabric Management, you can enjoy a seamless cloud-native experience. Key features include:
- Single pane of glass framework for data center environment discovery and management, allowing administrators to manage increasing numbers of disparate networks.
- Discovers network and SAN infrastructure, storage, and HBAs, leveraging a dashboard capability to visualize key performance indicators and strategic data for the storage network at-a-glance. The dashboard consists of movable panels summarizing a critical data point, providing fine-grained, detailed visibility into the storage fabrics: Fibre Channel (Ethernet/NVMe-oF support in a future release).
- Protocol-agnostic, real-time fabric diagnostics reducing configuration and deployment times, leveraging Fibre Channel zoning.
- Configuration assurance through HPE SPOCK.
- HPE GreenLake for Storage Fabric Management is extensible to accommodate future needs.
- It’s accessible using a published API that delivers an end-to-end view of the entire fabric, no matter how many or where they are located.
- Easy to deploy using a virtual appliance distributed via an OVA file.
How HPE GreenLake Storage Fabric Management Works
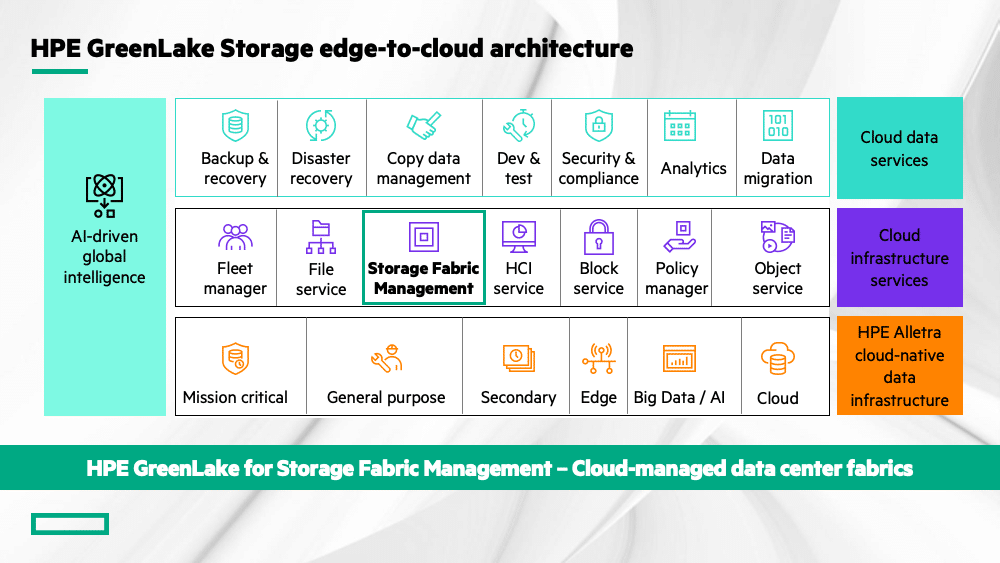
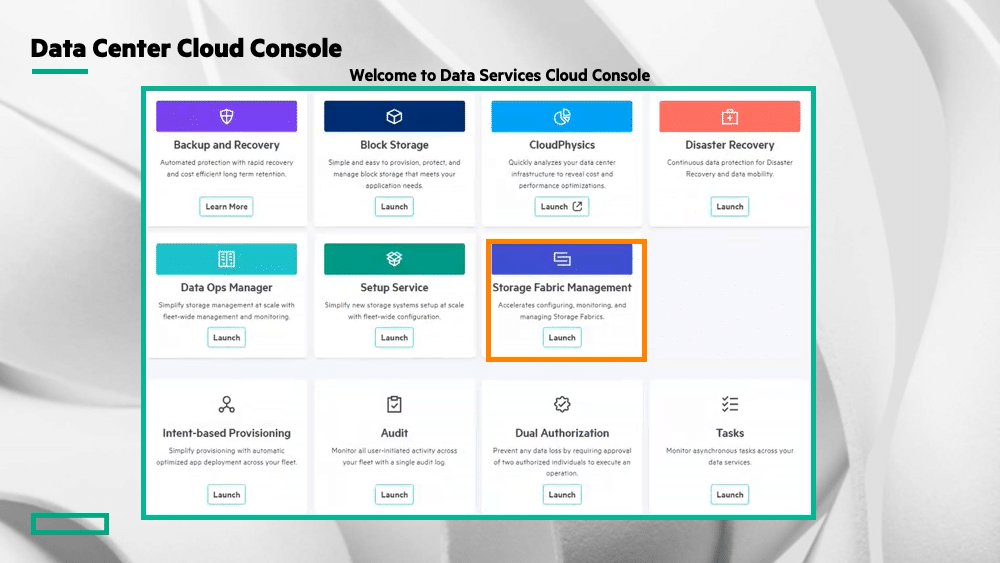
HPE GreenLake is an edge-to-cloud platform that provides customers with a single pane of glass experience with a view of all available services. GreenLake enables organizations to modernize applications and data with a unified operating experience and cloud services in networking, data services, high-performance computing (HPC), and compute operations management. The services are accessible, via widgets, from the Data Services Cloud Console and now feature a widget for Storage Fabric Management.
HPE provided StorageReview with a demo of HPE GreenLake for Storage Fabric Management, so we can share some of the screens captured from that demo to illustrate how easy it is to use the new SAN manager tool to manage storage fabrics from within GreenLake.
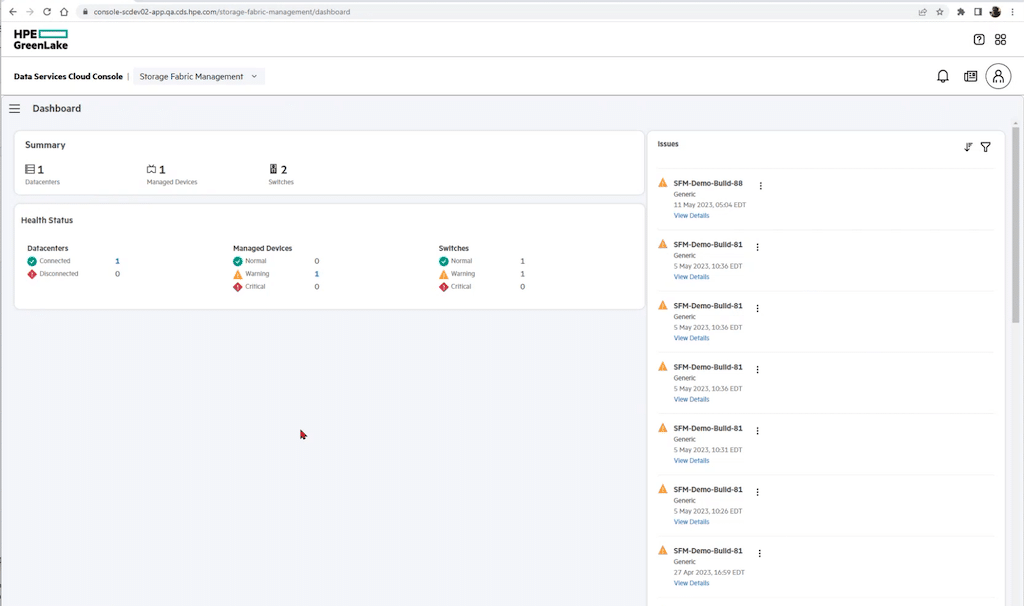
After clicking the Storage Fabric Management widget, the Dashboard display appears, providing a summary of the available resources, a Health Status for the Data Centers, Managed Devices, and Switches, and a panel displaying any issues detected by the SAN manager. The Dashboard makes it easy to get a complete picture of the overall condition of the discovered components detected automatically or entered manually.
All screens provide hot links that provide more detail for each selected device.
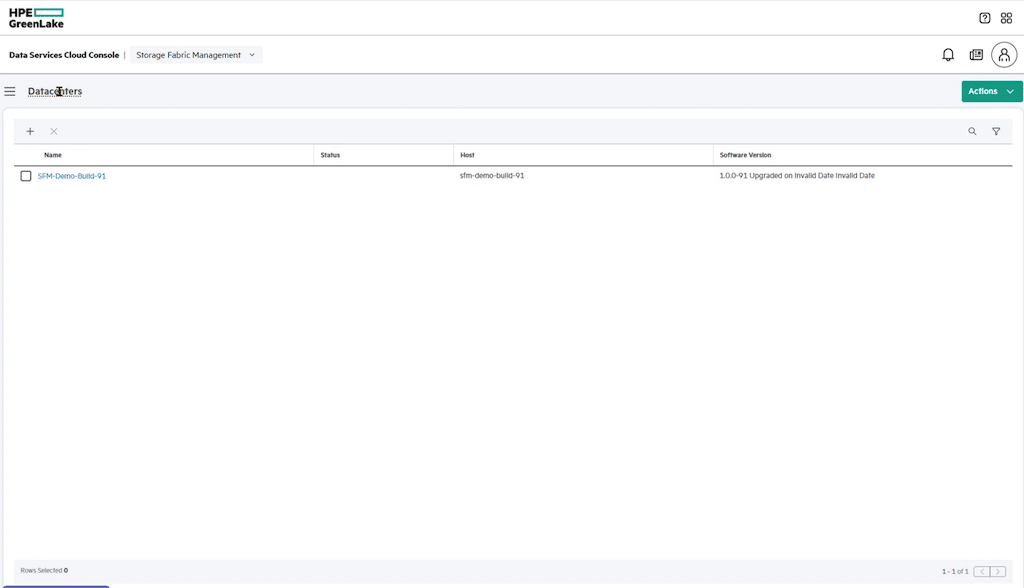
Clicking the hotlink in the data center section will bring up the Datacenter list. For this demo, there was a single active data center. All the displays have a familiar look and feel. The new storage manager is simple to navigate, presenting the current location on the top left with a drop-down menu to navigate to other areas of the manager. The Actions menu on the top right provides context-sensitive options based on the current screen.
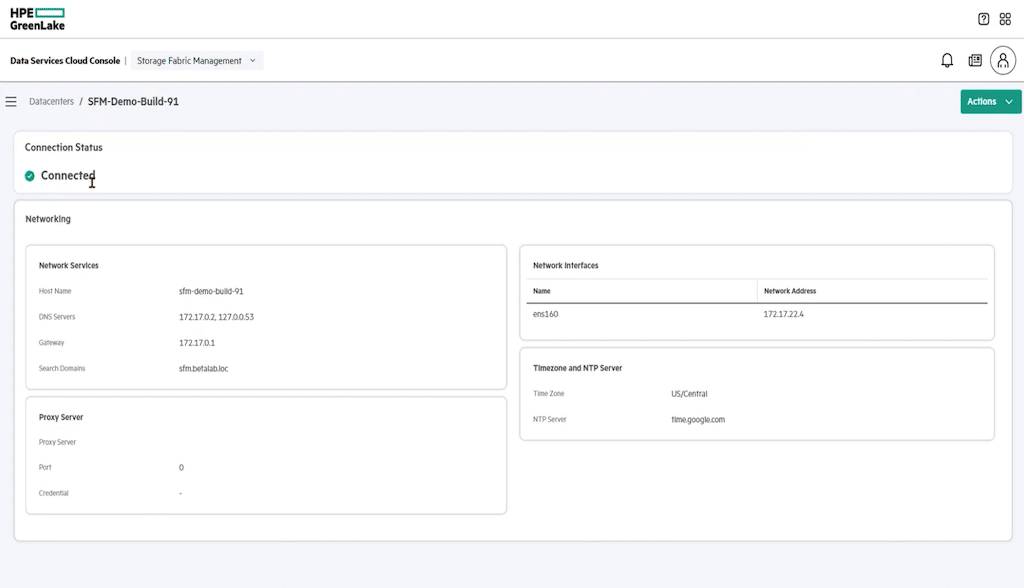
Clicking on the data center name takes the user to the Connection Status display. From here, it’s easy to get network detail, associated interfaces, time zone and information, and Proxy Server information, if one is configured.
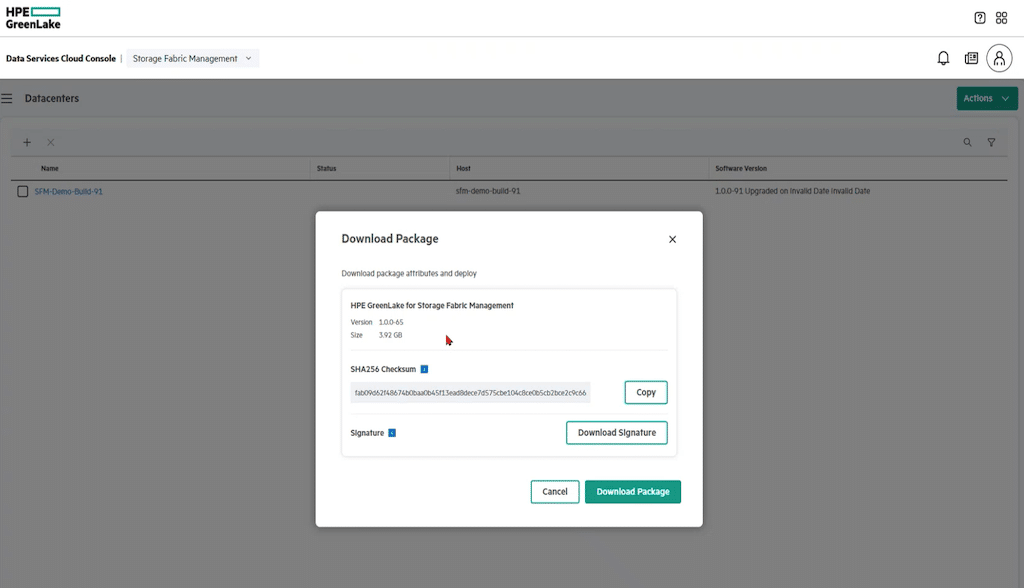
If this is a new installation, the user would be prompted to download an OVA package to be deployed on a virtual machine in the local lab. The installation is also straightforward, with a short dialogue to set up the network. This screen can also be accessed by clicking Actions, followed by Download Package.
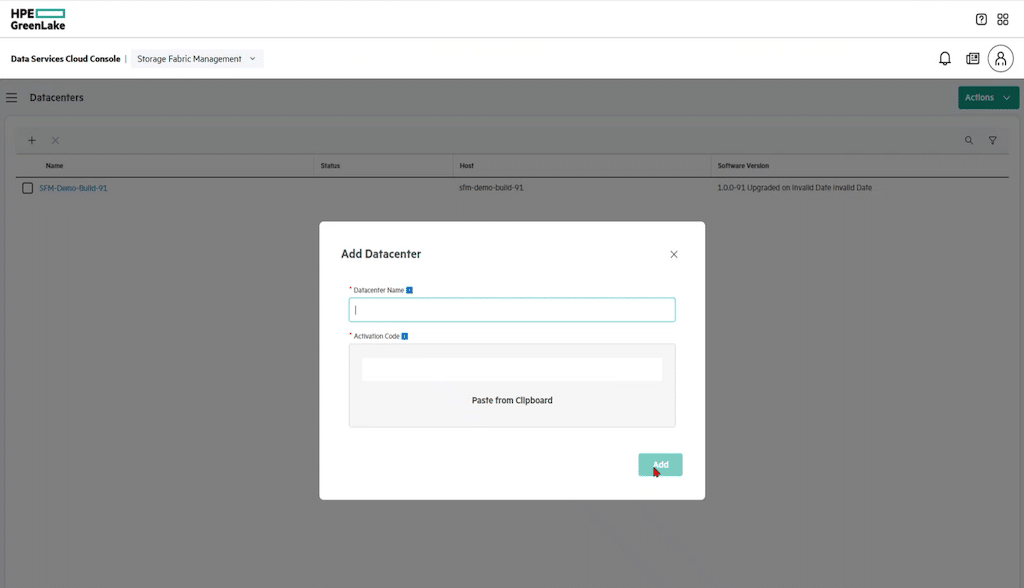
Clicking the plus symbol above the data center name on the left of the screen provides a dialog box to add a data center to HPE GreenLake for Storage Fabric Management.
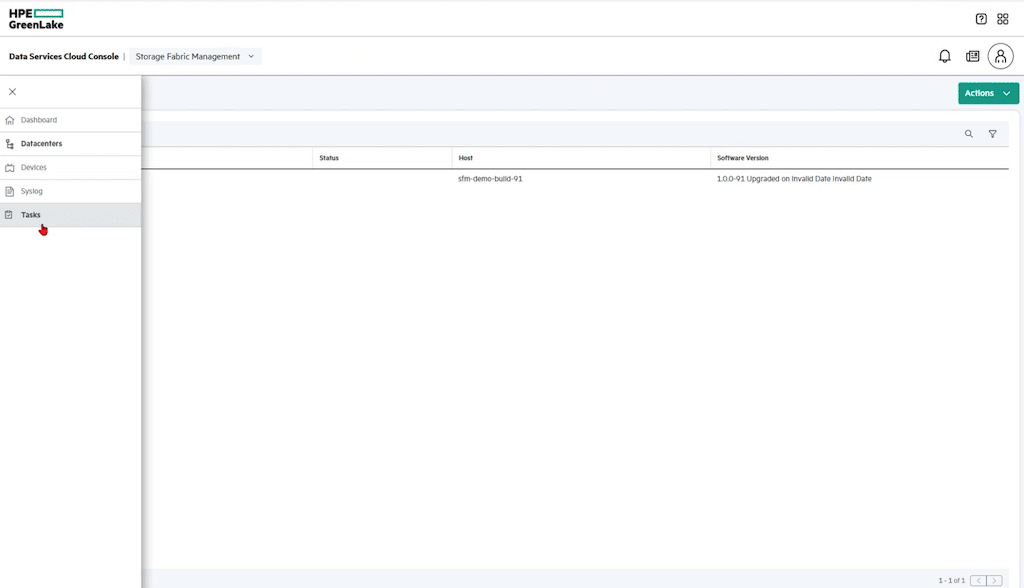
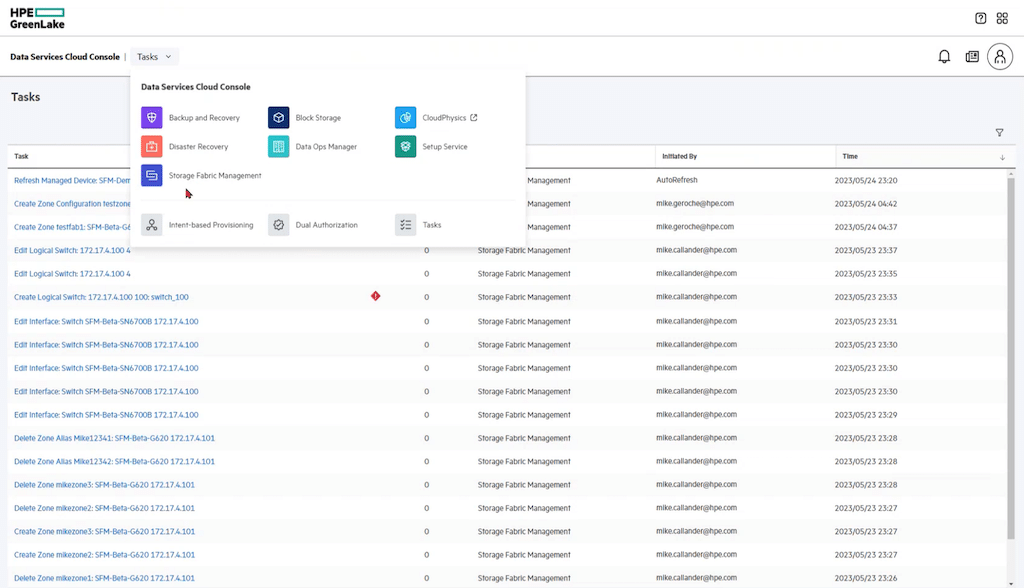
As mentioned earlier, from the Dashboard screen, a dropdown menu panel provides links to HPE GreenLake for Storage Fabric Management areas specific to the topic on the display. In this case, we are in the Datacenter area to check for any tasks that are in process or have been completed.
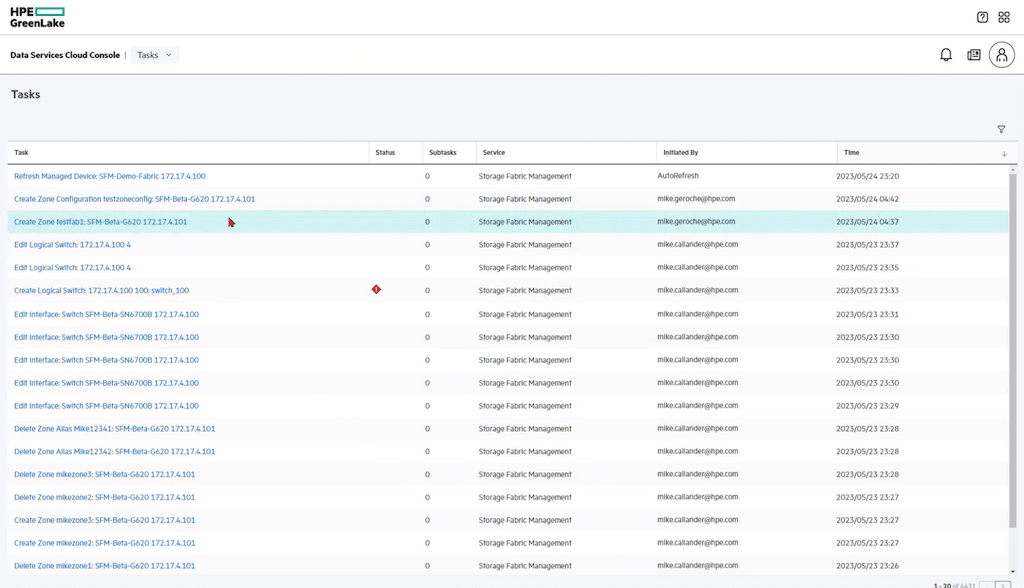
The resulting screen for tasks looks like this. It lists the tasks, status, subtasks, initiator, and time to complete. A red diamond on one task indicates an issue occurred when trying to perform the task.
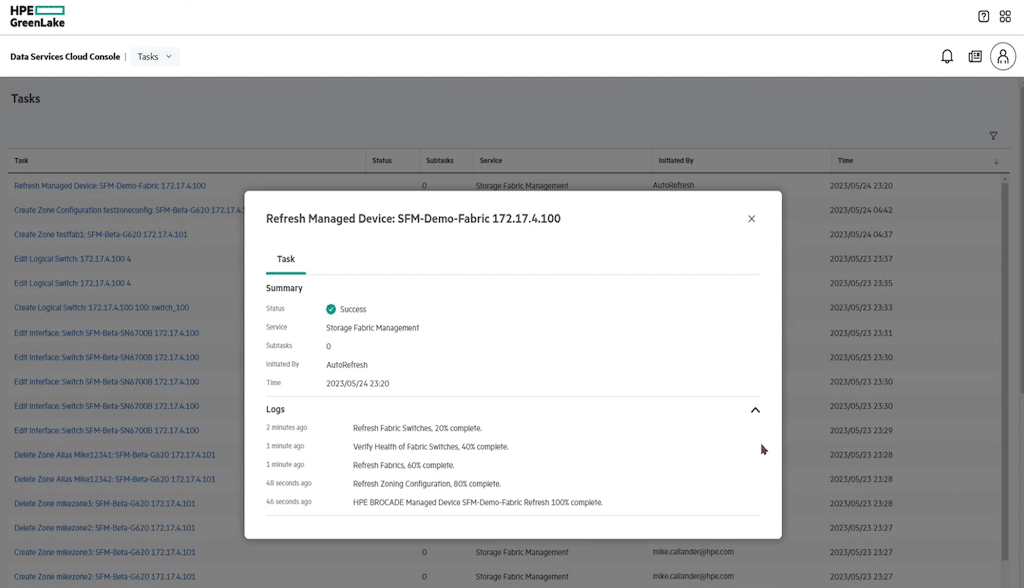
Clicking on a task will display a summary of that task providing more detail and status. The summary shown above reflects the status for a refresh managed device command.
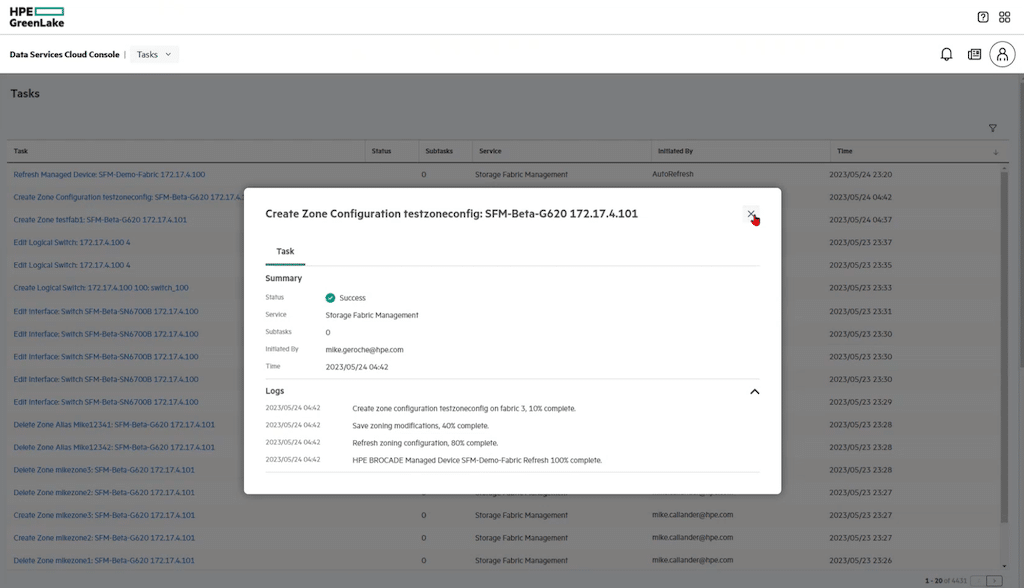
The screen capture above was generated following a create zone configuration task.
HPE GreenLake for Storage Fabric Management is easy to use and provides shortcuts to almost every action needed to deliver solid SAN management. The screen above shows that clicking the Task down arrow will open a navigation box that can take the user to functions within the Data Services Cloud Console.
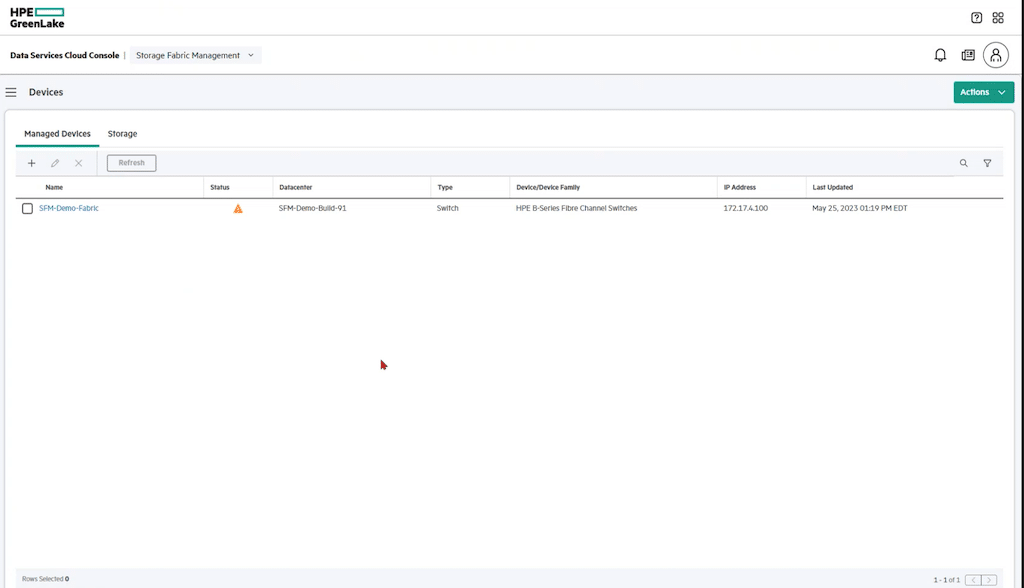
The devices option in the drop-down menu will open the Managed Devices screen. Our network is new, so we only have a few devices to choose from. However, we do have a managed fabric, and we can see from this that there is an issue indicated in the status column. The display also shows the Datacenter the fabric is located in, the device type, device family, IP address, and the date the switch was updated.
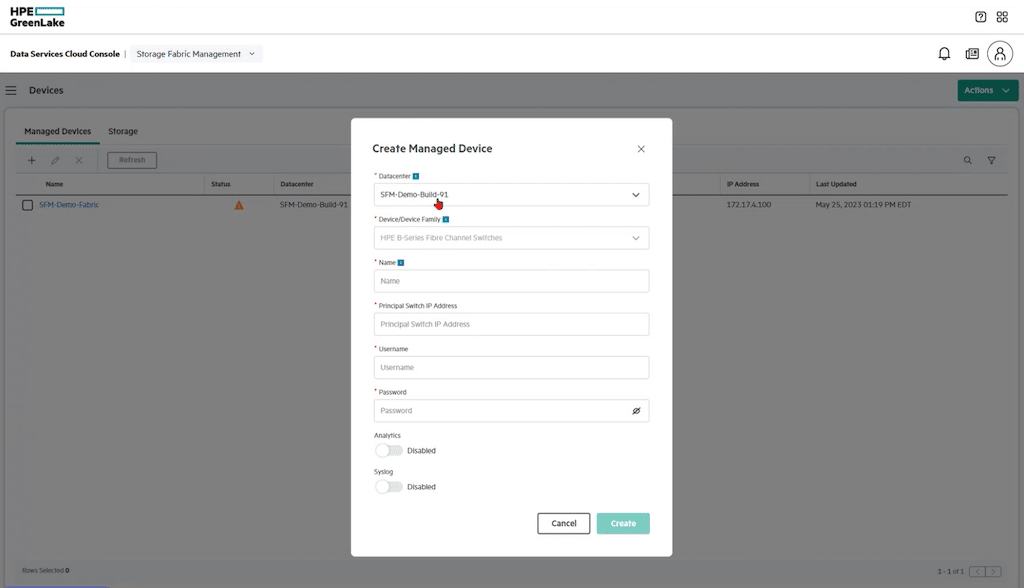
The Managed Devices screen lets users create managed devices without navigating away from the original display. The Create Managed Device option is opened by clicking the plus symbol on the left edge of the screen.
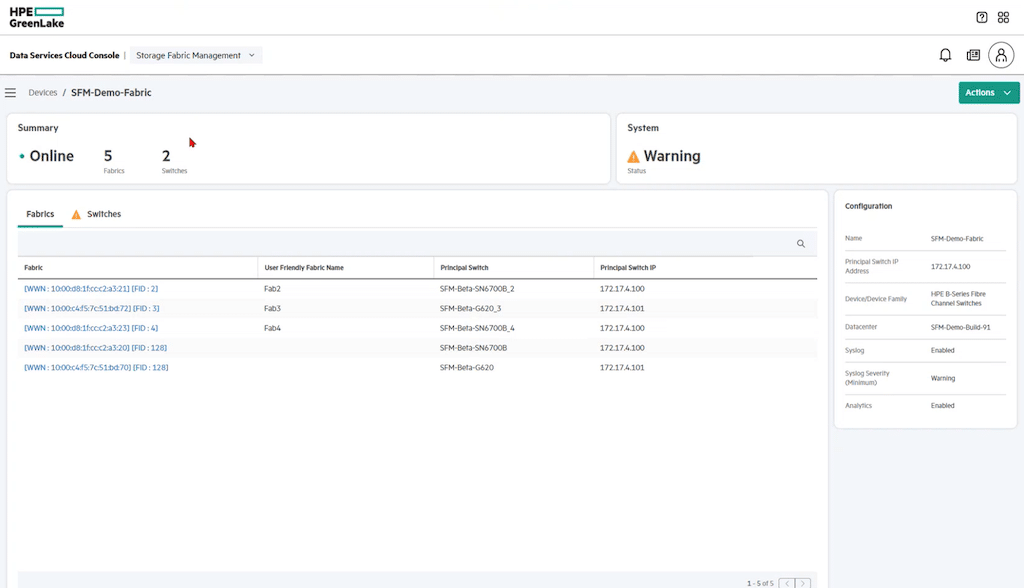
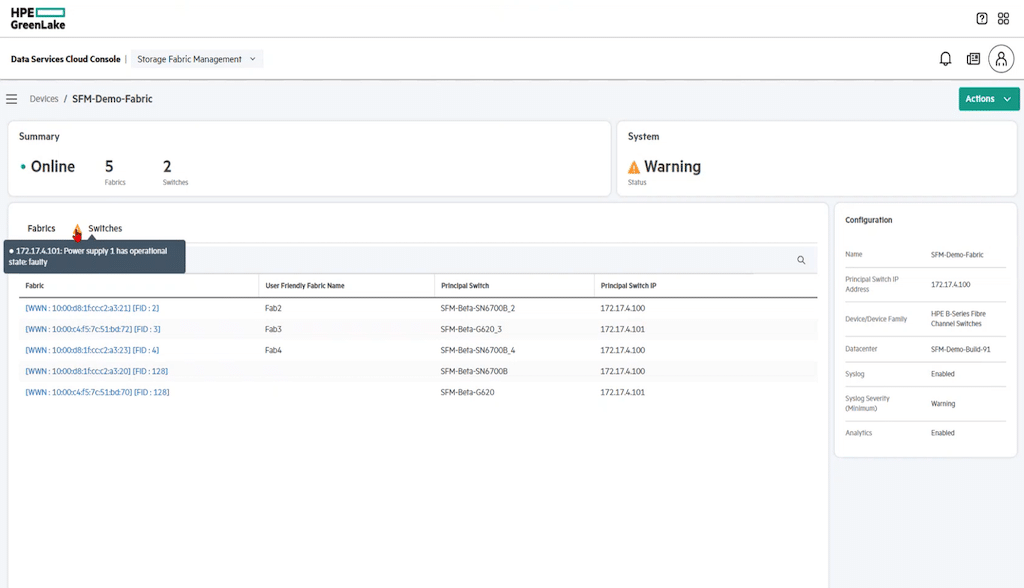
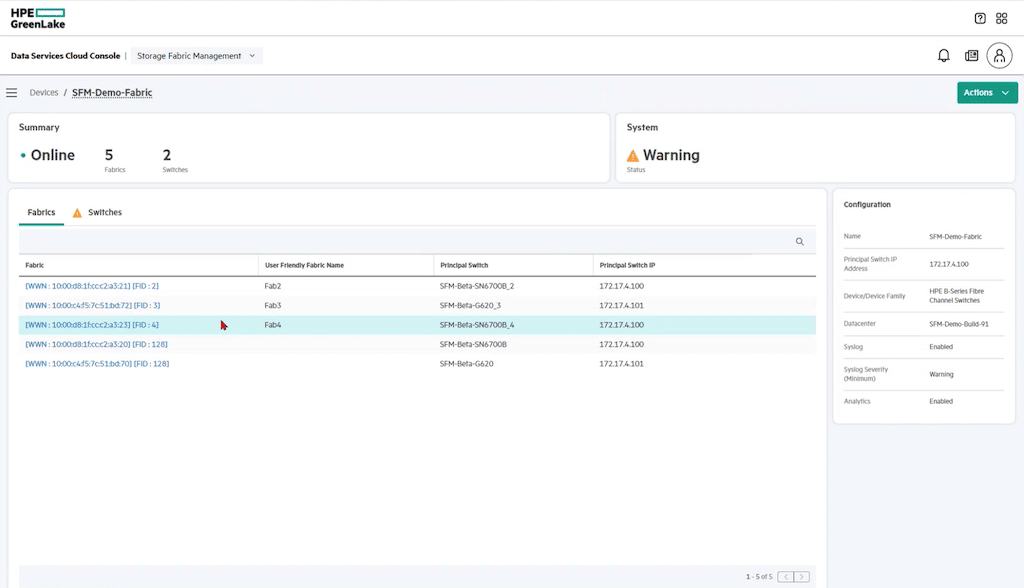
Clicking the device name from the Managed Devices screen opens the fabric summary page that indicates the status, any System messages, and complete details for the fabric. On the right side of the display is a panel with configuration detail.
Hovering over an alarm icon will provide information regarding the alarm. In this case, one of the power supplies is faulty.
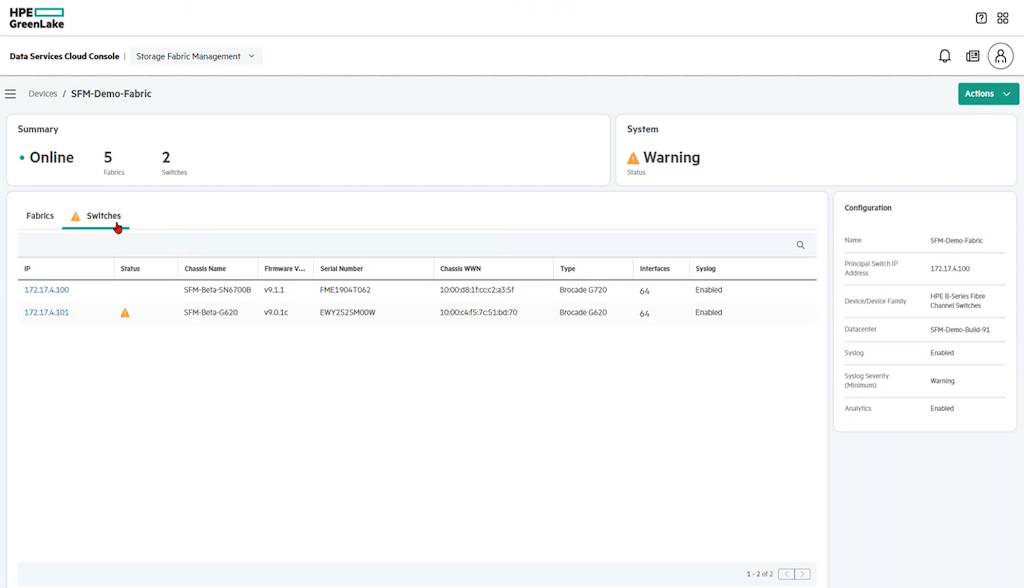
Clicking the Switches option lists all physical switches and associated detail. In this view, it indicates the second switch has down-level firmware.
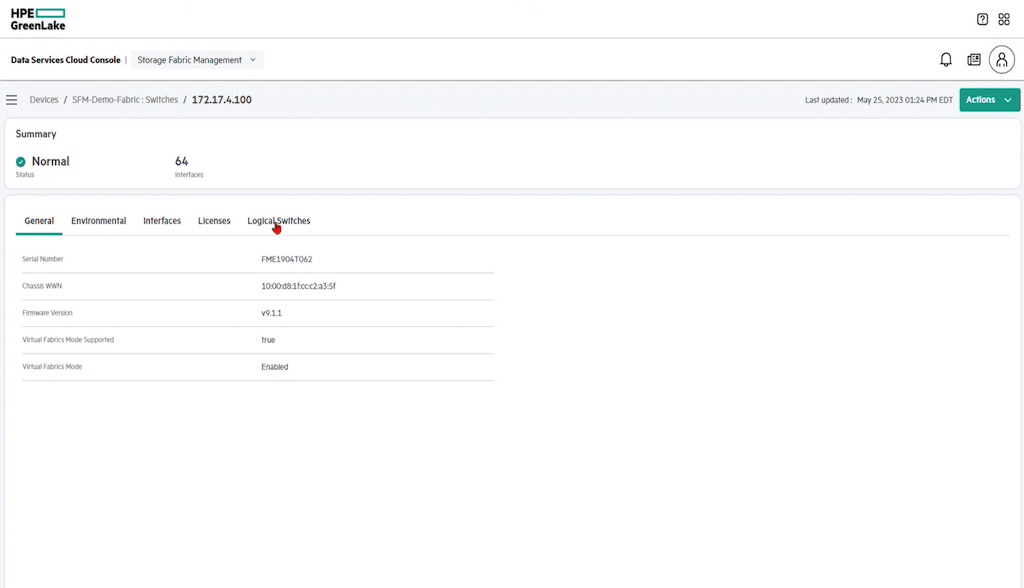
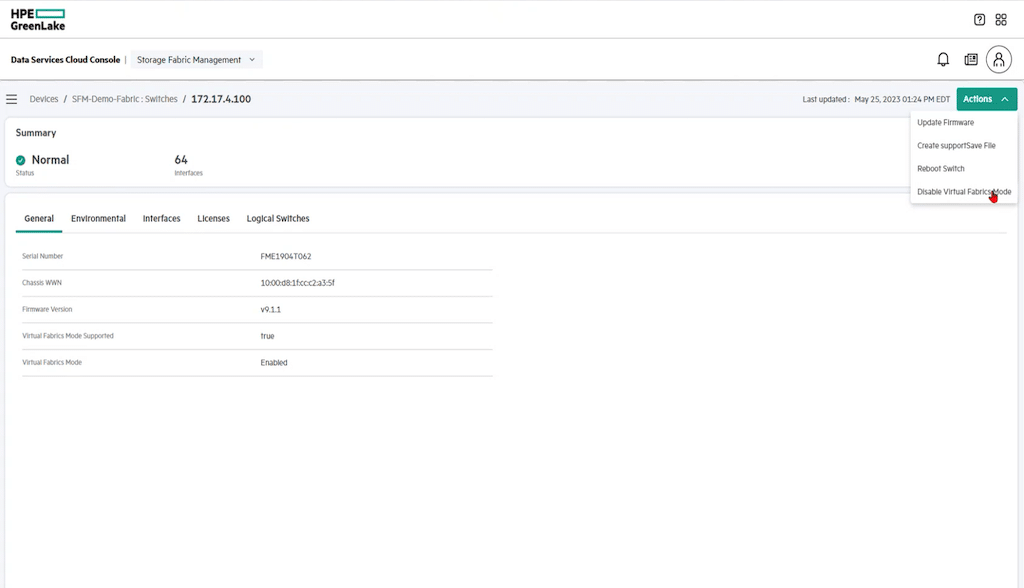
The Actions button was referred to earlier, and in this case, clicking Actions displays a drop-down menu with options specific to the area of SAN manager currently open (in this case, switches). Selecting any option will open a dialog to help the user complete that function.
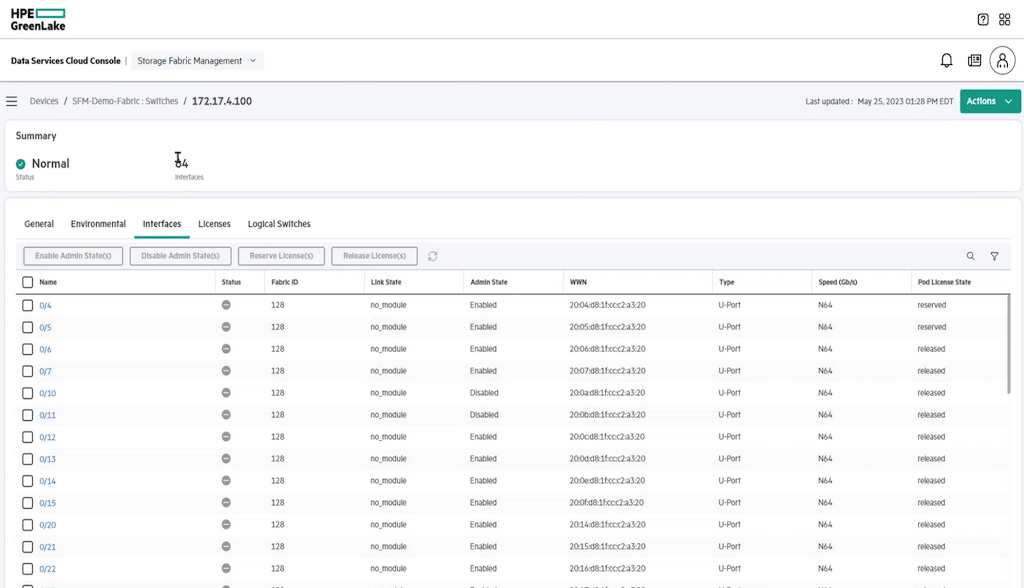
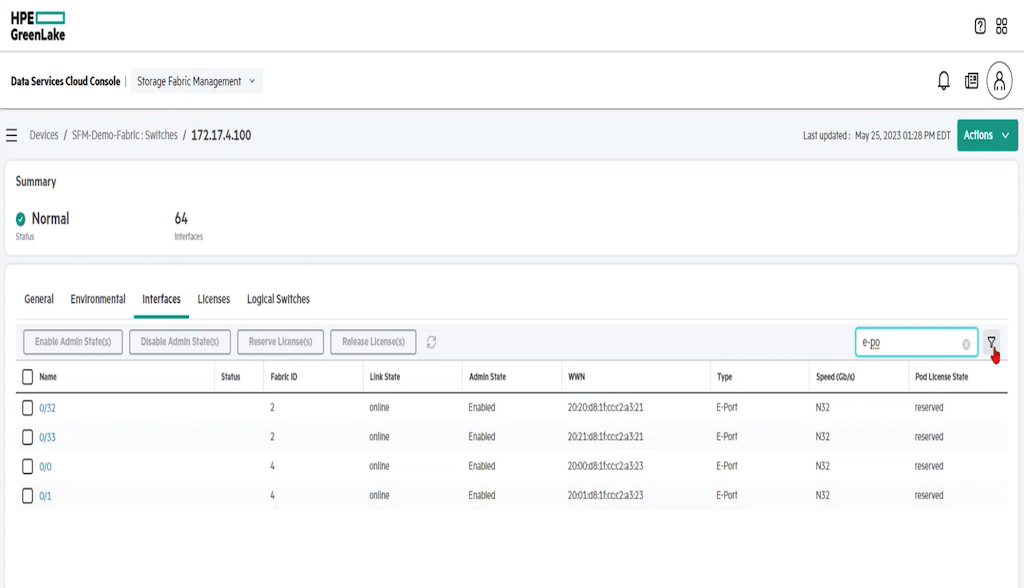
Returning to the physical switch display, selecting Interfaces will list all interfaces within the switch and the status. The amount of information displayed on this level is impressive. The SAN manager shows the status, Fabric ID, Link State, Admin state, World Wide Name (WWN), Port type, Port Speed, and License State.
The search function is a fast and easy way to drill down to a specific port, port type, etc. In this case, a search was performed for an e-port with the output shown in the above screen.
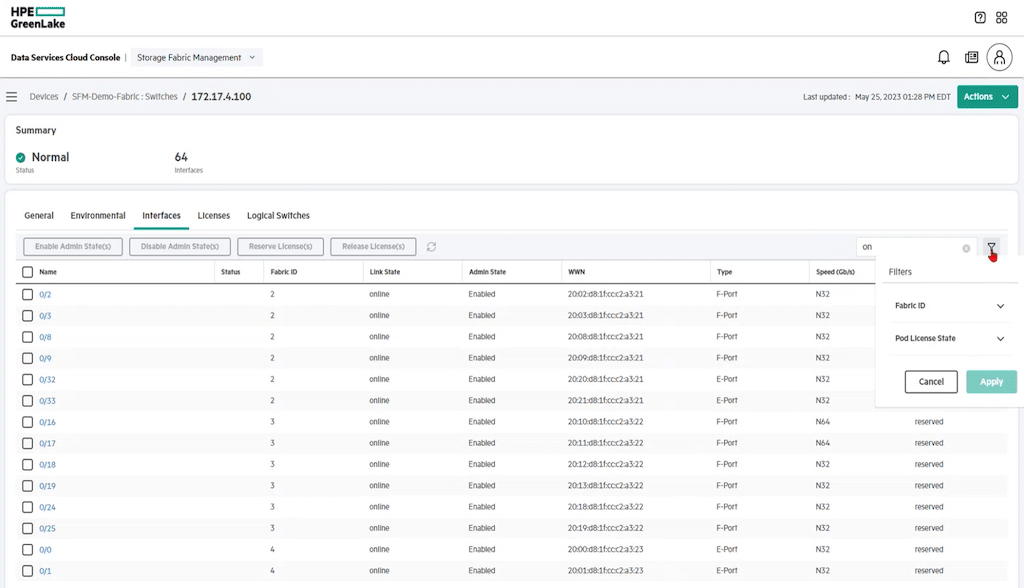
Next to the search button is a filter option that will open a drop-down menu with available filters when selected.
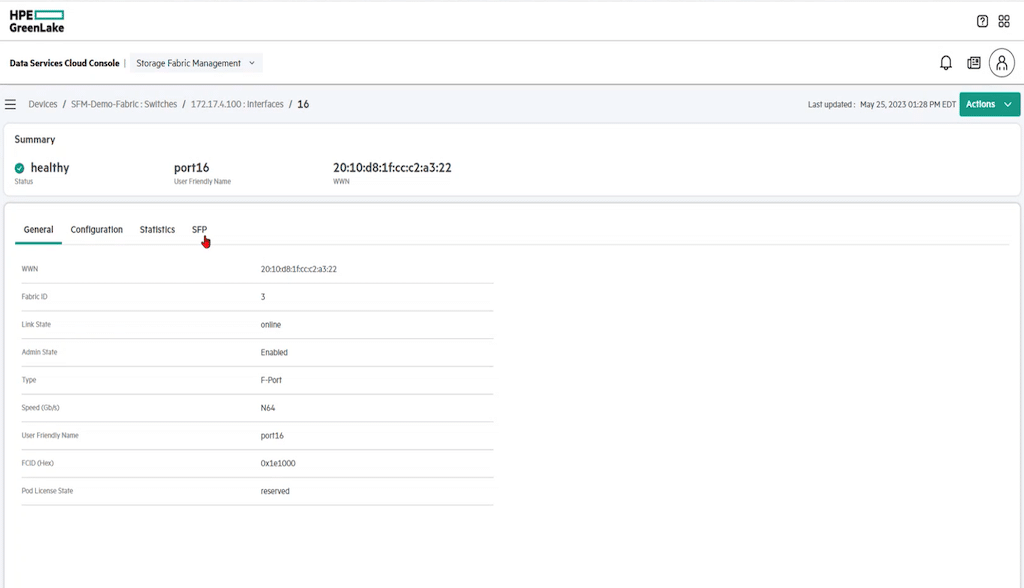
The interface display lets users select a particular interface to display a full summary. Within this display, there are more options to get even more detail.
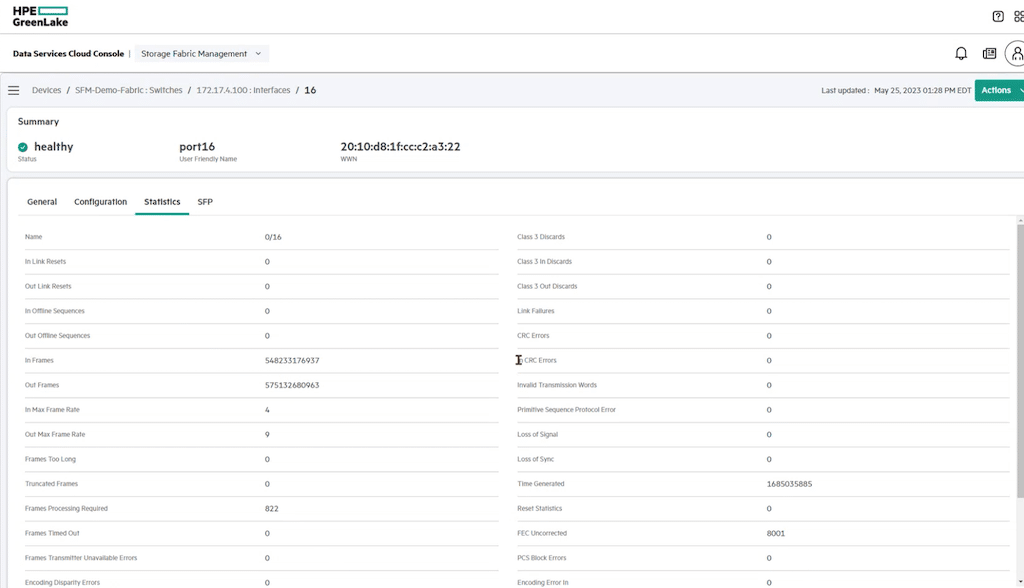
This example shows the Statistics detail associated with port16.
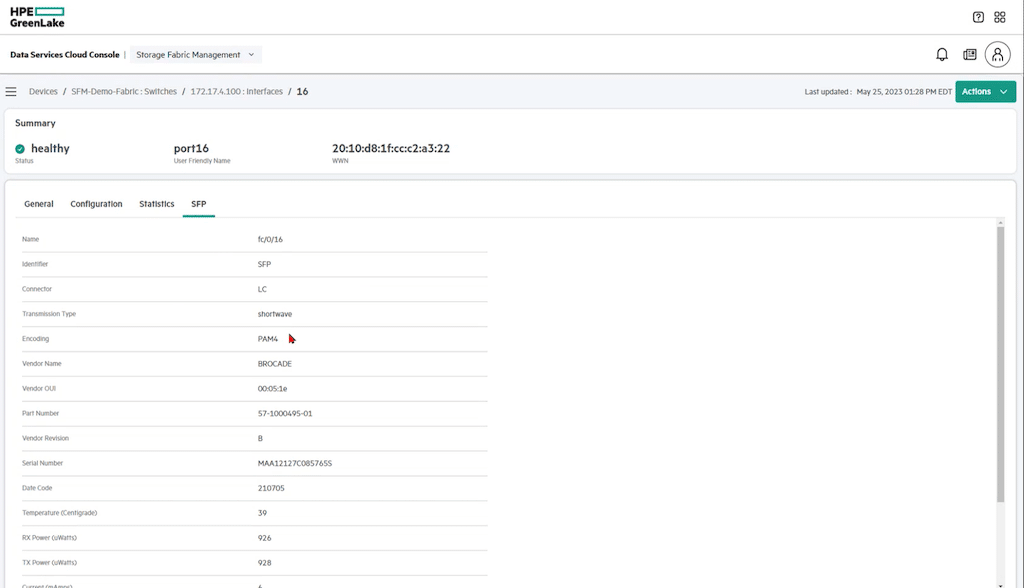
HPE’s storage manager provides tools to drill down to the SFP level for information on the SFP and associated statistics.
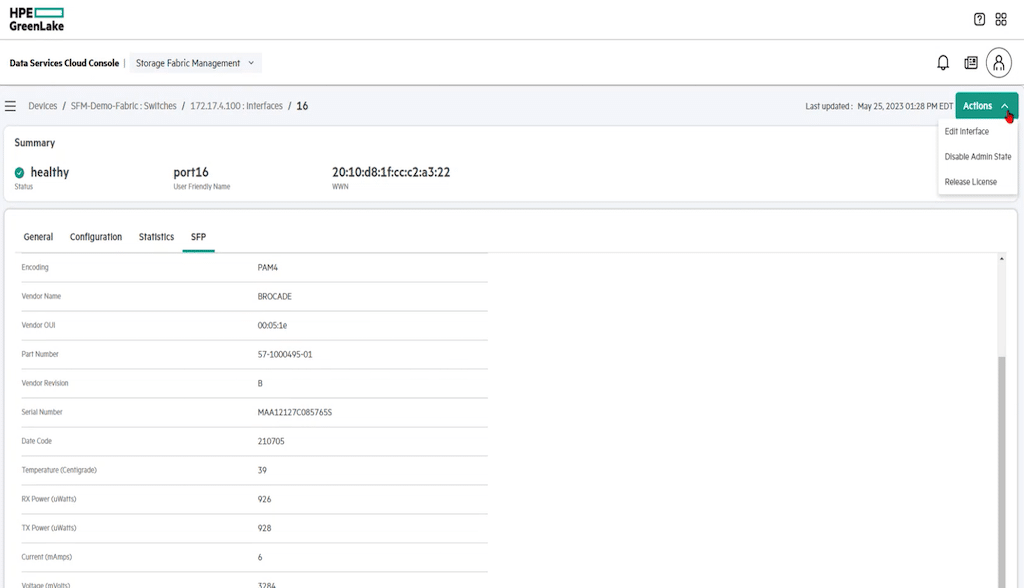
Another example of the intelligence built into HPE GreenLake for Storage Fabric Management, specific to the Actions button, is the option to manage to the SFP level. Users can edit the interface, disable the admin state, or remove the license from here.
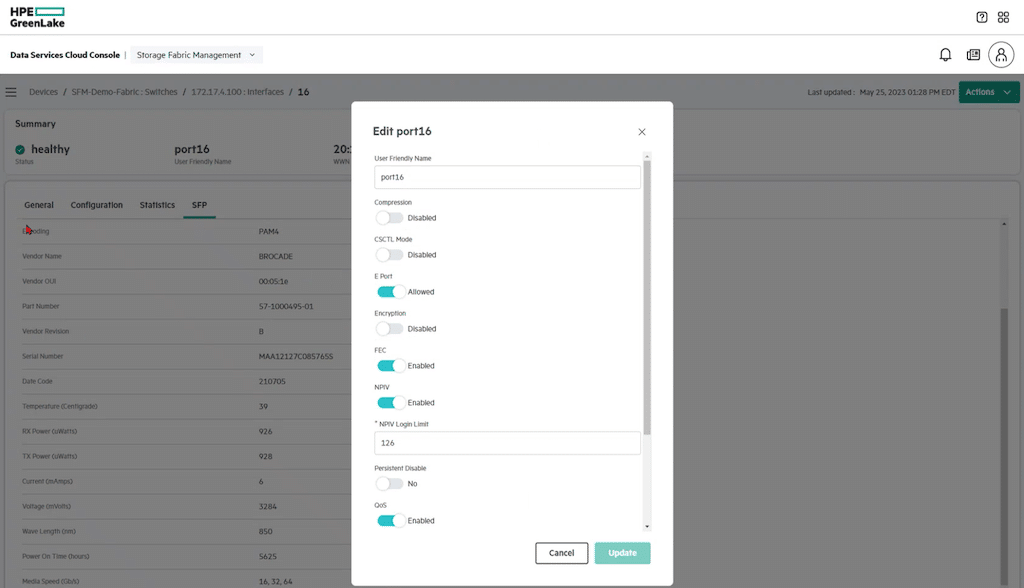
When the edit option is selected, HPE’s SAN manager opens a popup window with functions that can be toggled on or off.
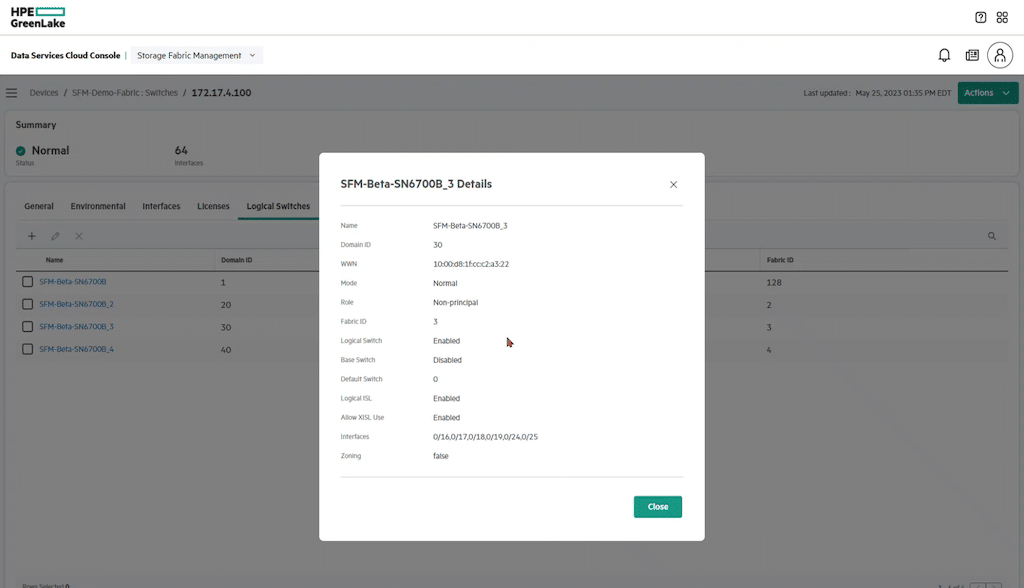
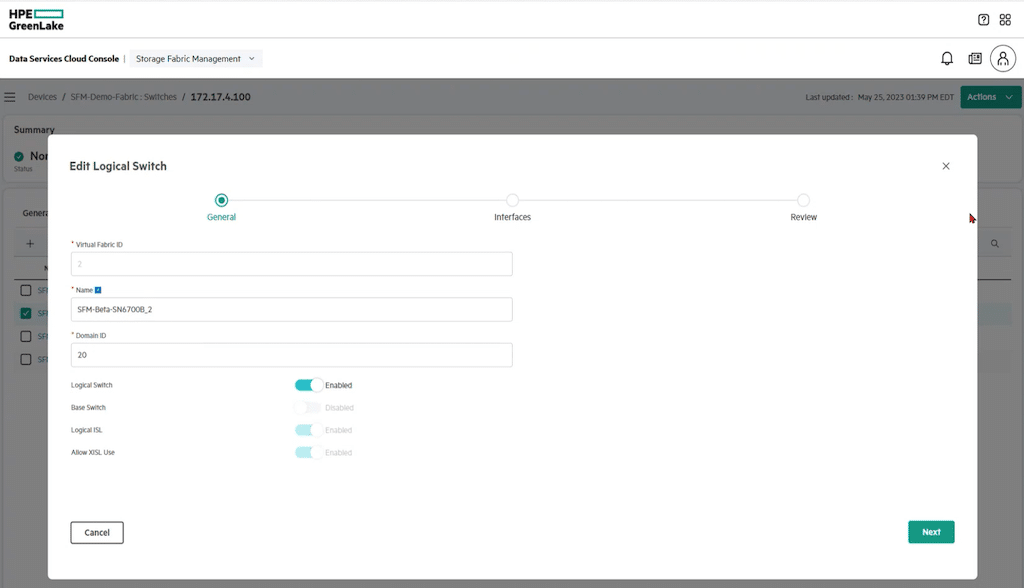
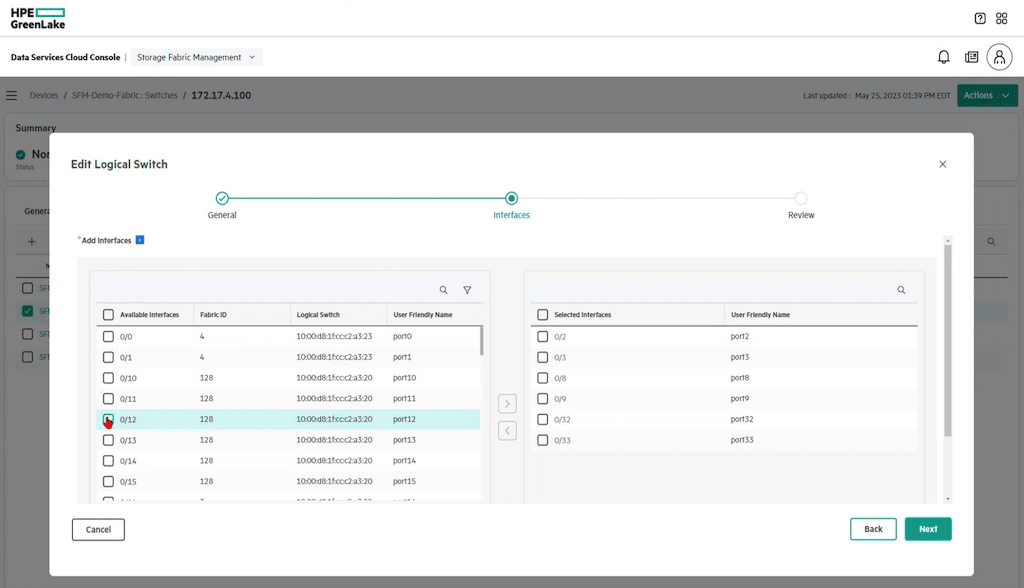
It is possible to edit a Logical Switch within the storage management tool. Select the switch, and click the pen above the switch display to open the Edit Logical Switch dialog box.
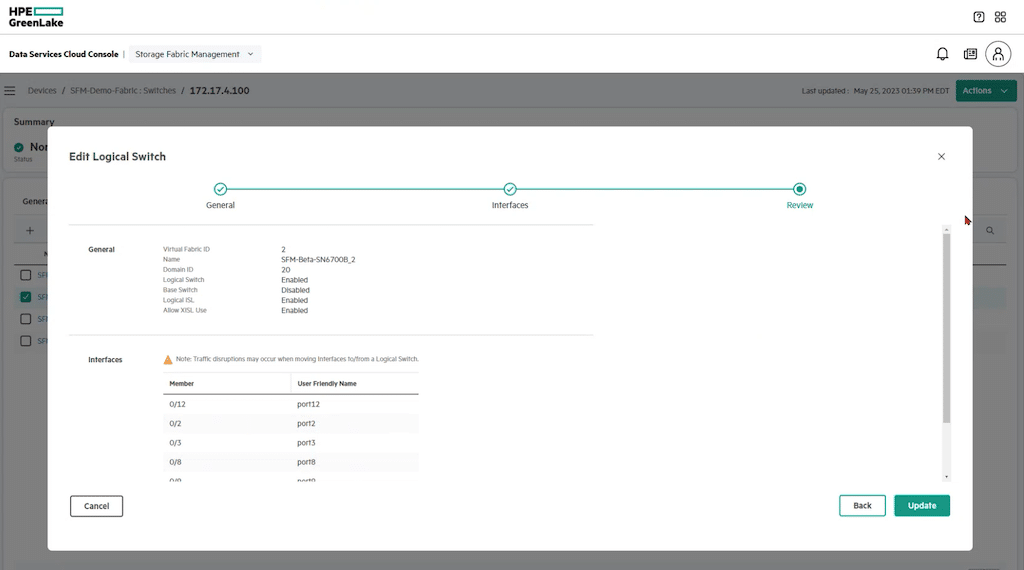
As we move through editing the logical switch, the next step is to edit the interface. Then click next to go to the Review page.
The Actions button comes in handy here if there is a need to create a new Logical Switch.
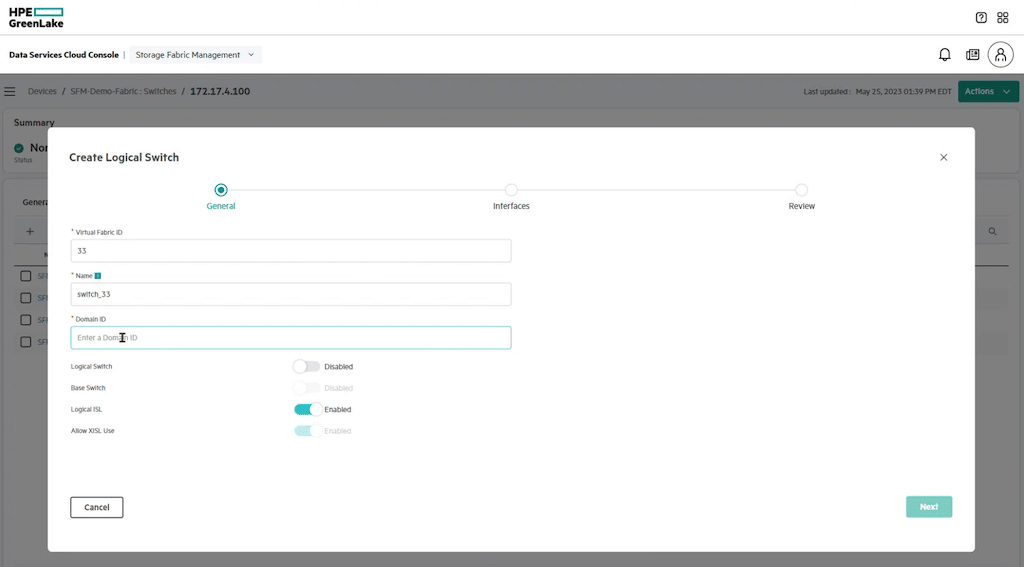
To create a new logical switch, click the plus symbol to open the dialog box.
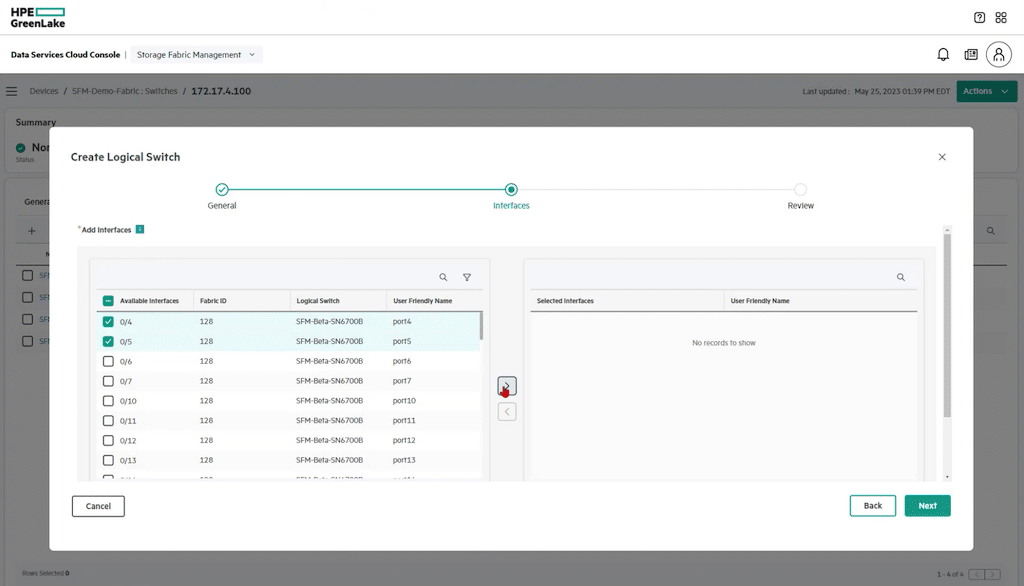
Creating a logical switch follows the same routine as editing the parameters of an existing switch. Clicking the plus symbol will open a dialog box to step through the process. After completing the fields, click next to add interfaces.
Select the interfaces associated with this switch, click Next to review the configuration, then Create.
Clicking Create at this point will initiate the creation process.
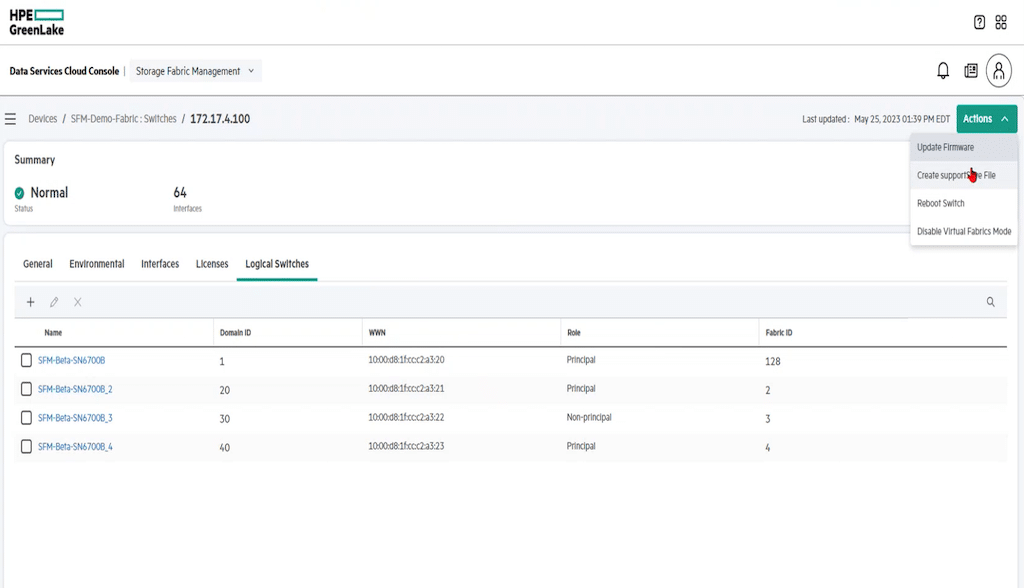
Stepping through the Actions menu for the Logical Switch function provides options to update firmware, with several options to get that firmware on the switch, create a support Save File, reboot the switch, and disable virtual fabric mode.
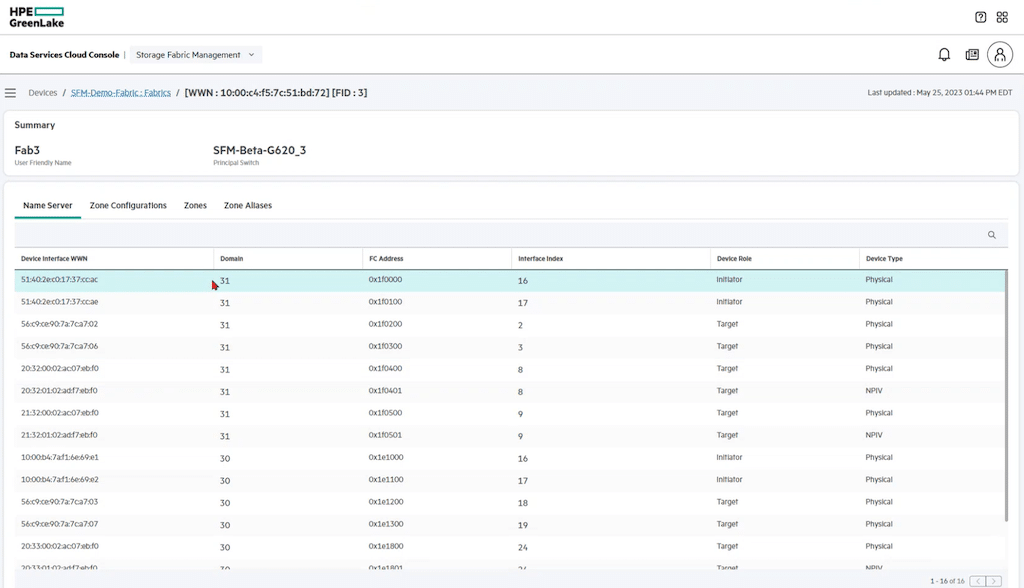
From the fabrics screen, it is possible to view virtual fabric detail. Clicking one of the fabrics will open a window similar to the one below.
This display has options for Device Interface WWN, Zone Configurations, view Zones, and Zone Aliases. The information provided on the above screen capture is pretty detailed, listing Domain, FC Address, Interface Index, Device Role, and Device Type.
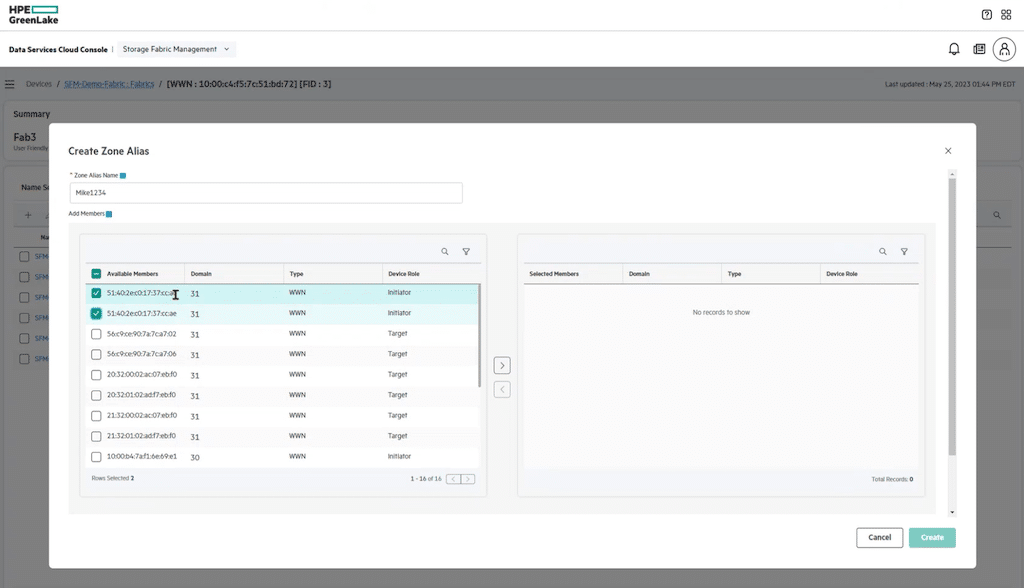
Clicking the Zone Alias option from the fabric screen will open a dialog box allowing users to easily create aliases based on the detail from the screen.
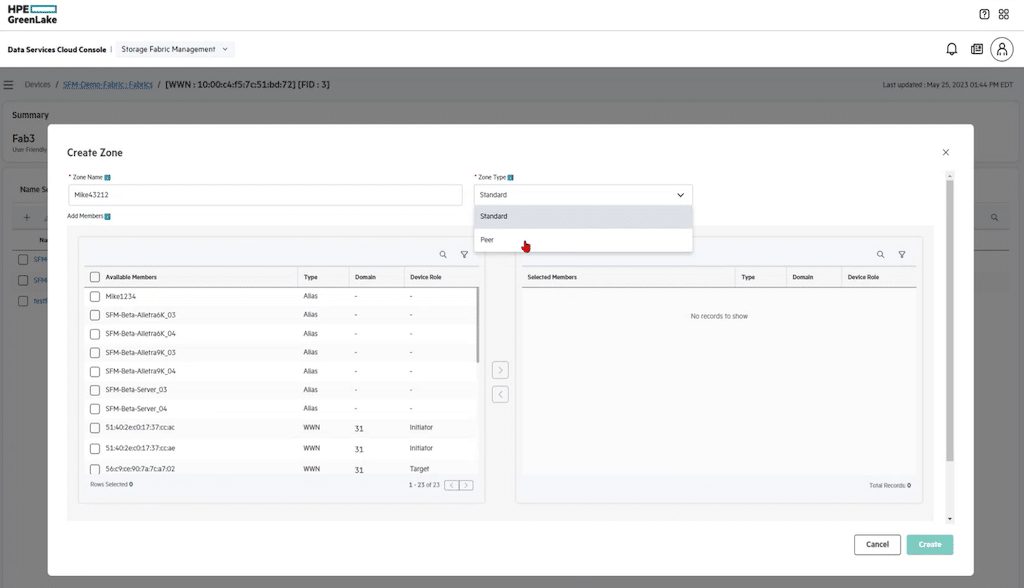
Once the Zone Alias has been created, it will be necessary to assign it to a Zone. Creating a zone is just as simple. Click the Zone option to open the dialog box. There are pull-down menus where there is a blue down arrow. If using an existing zone, select it from the list. Add the Zone name if this is new. Then select the Zone Type, Peer or Standard. Then select the Available members by clicking the selection box and move the choices to the Selected Member area by clicking the Right arrow.
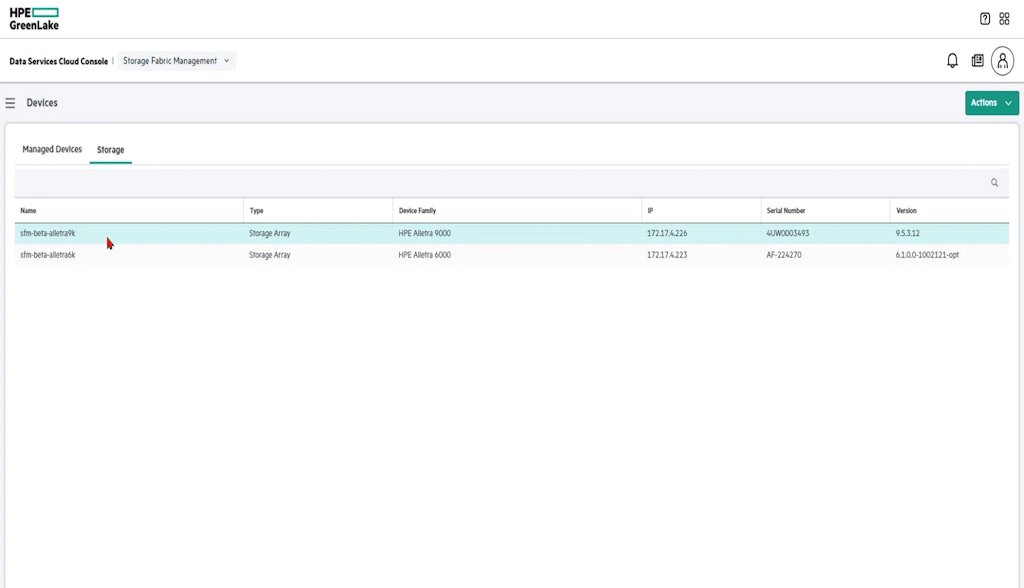
From the managed devices option, it is easy to see the complete list of arrays installed on the network.
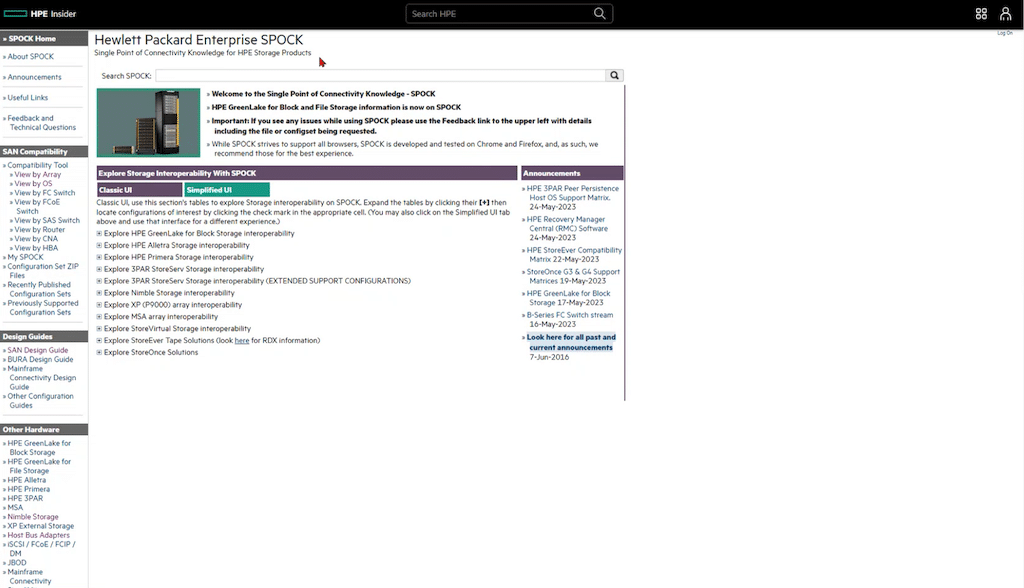
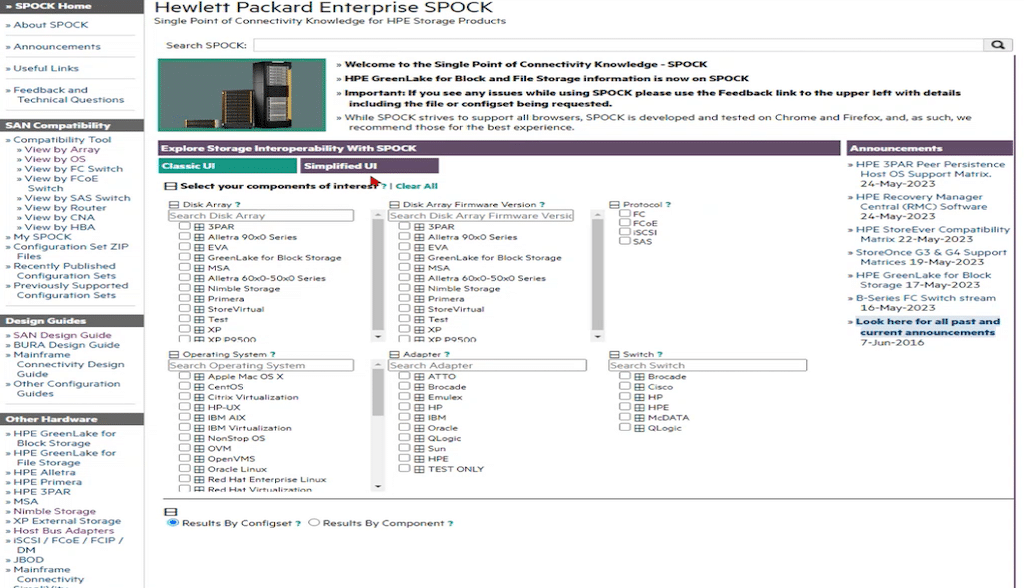
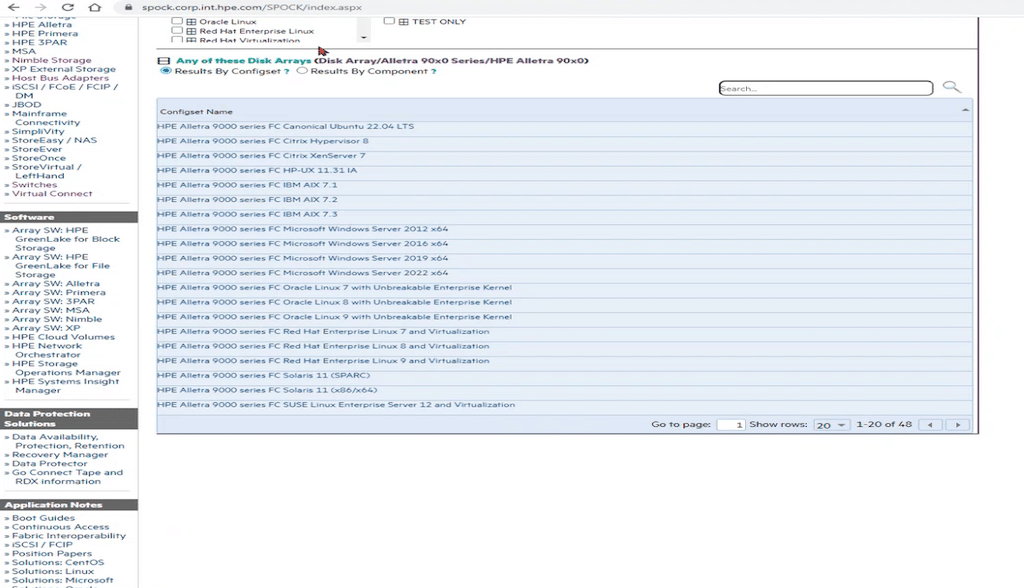
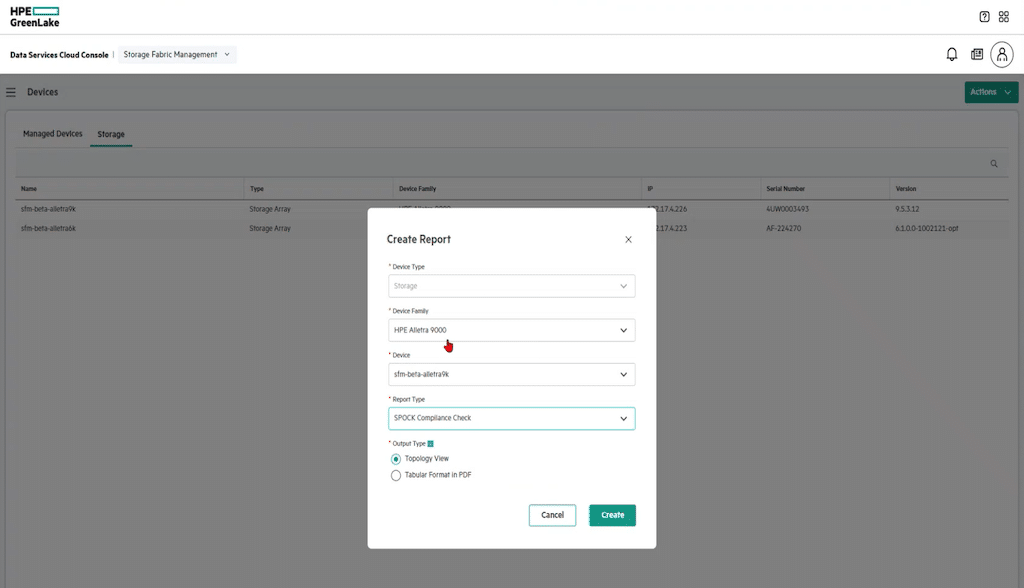
Some reports can be generated from the Devices screen. A popular and helpful report is a SPOCK report. The Single Point Of Connectivity Knowledge (SPOCK) for HPE Storage Products generates detail on the storage arrays that alerts users to support issues with HPE for specific devices.
This is what the SPOCK support page looks like for HPE.
Clicking on the Array type, firmware, protocol, etc., will notify the user of any compatibility issues with the arrays.
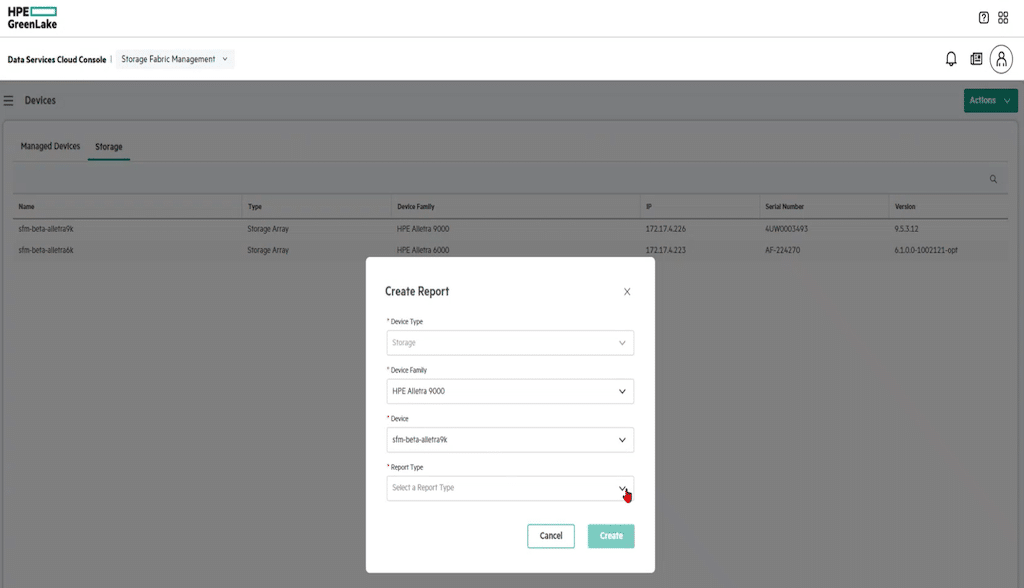
To create a SPOCK report, fill in the dialog box with the information needed in the report and click Create.
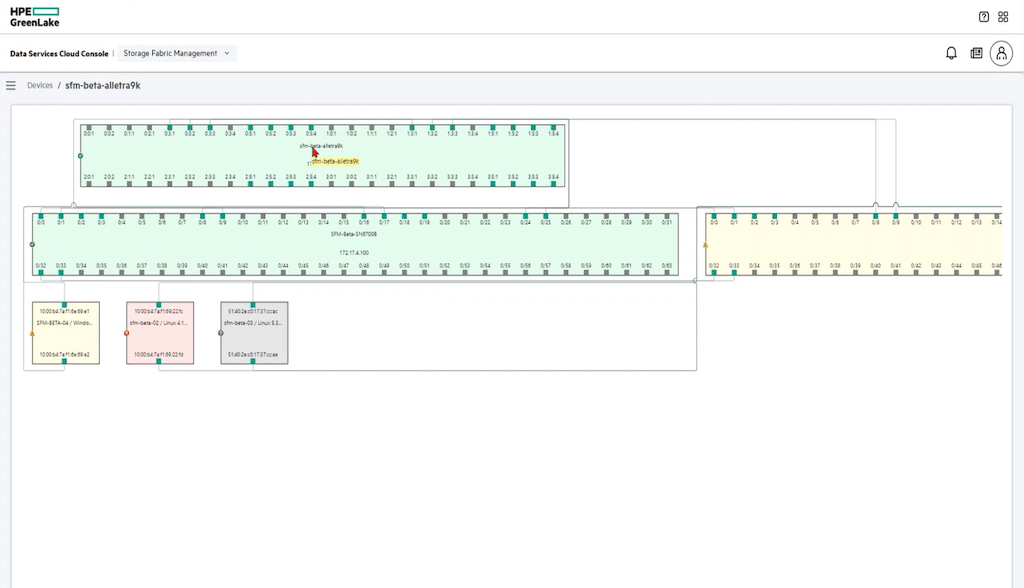
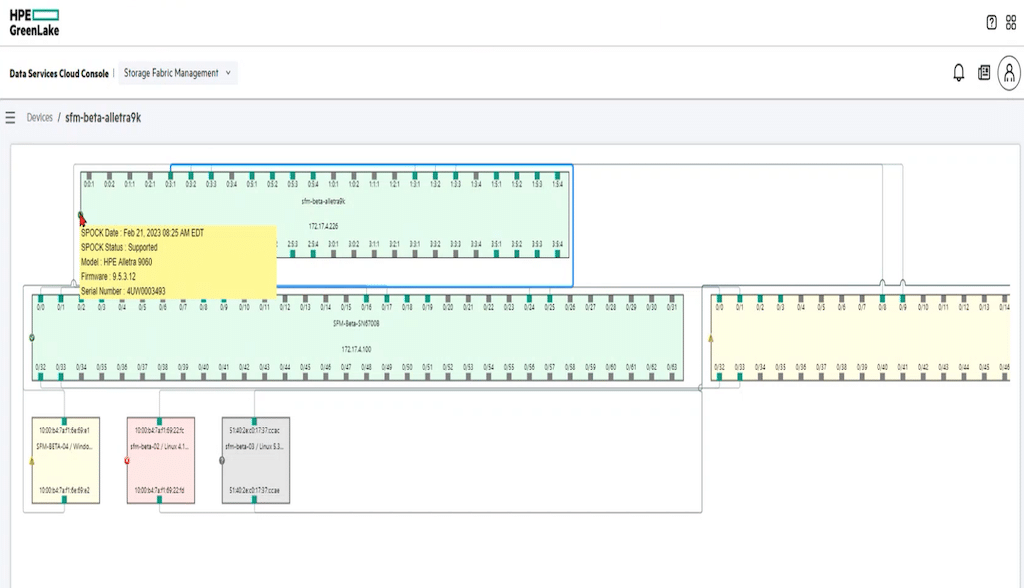
The report generates a graphical view of the switches, color-coded to reflect supported (green), update available (yellow), and not supported or unknown switch type (gray).
Hovering over the green arrow, yellow warning symbol, or any other hotlink in this display will open a short informational box.
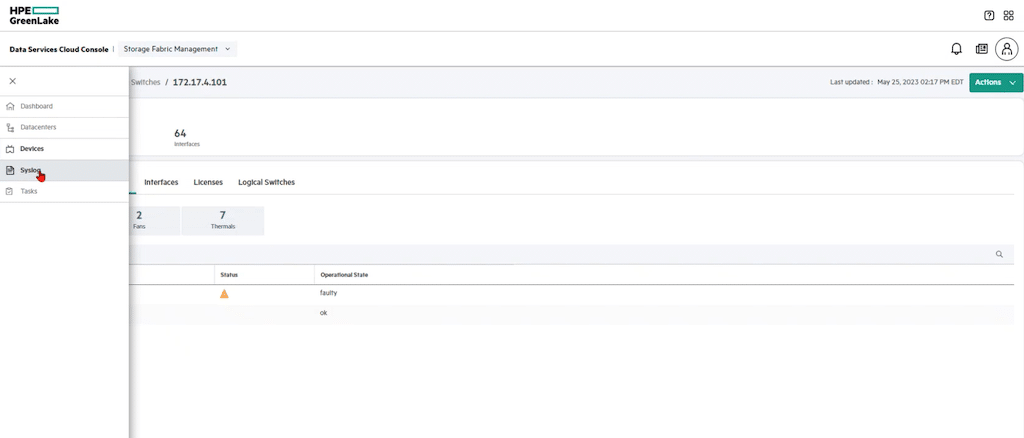
Another helpful display is Syslog. Syslog is accessed from the main pull-down menu.
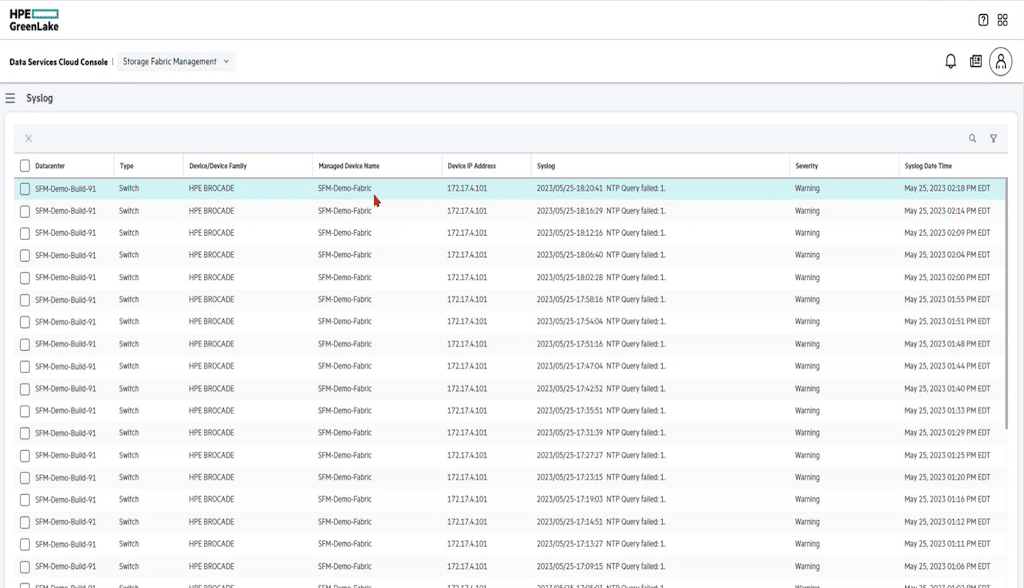
Selecting Syslog from the drop-down menu will open a screen with the Syslog data. It is also possible to enable or disable syslog.
Test Drive HPE GreenLake for Storage Fabric Management
Take HPE GreenLake for a no-cost, no-obligation test drive. This guided, hands-on experience allows you to explore cloud services in a live production environment. This is a comprehensive introduction to HPE GreenLake for Storage Fabric Management, with a massive selection of options for users to test.
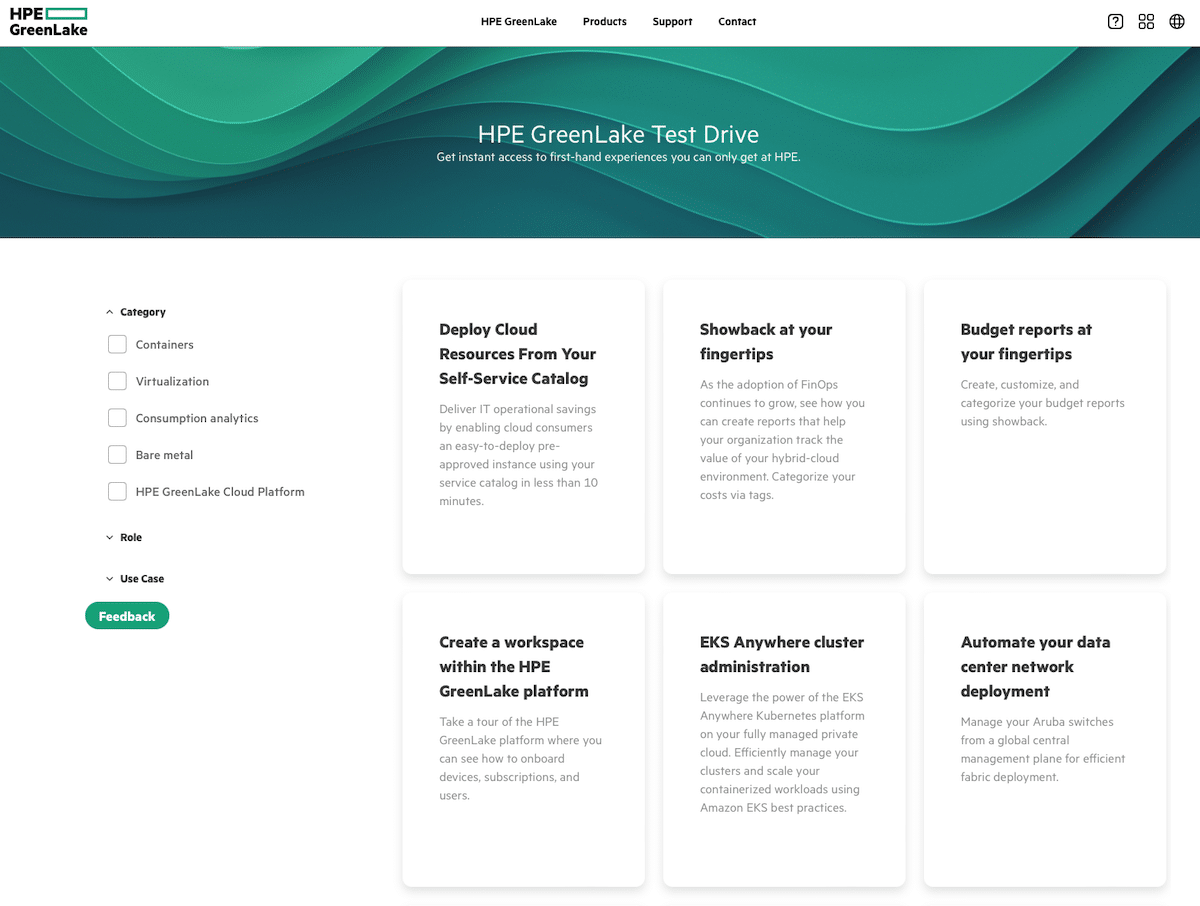
This is just a taste of what’s available when signing up for the test drive. There are over 20 topics to choose from. The left side of the window lets users select a specific category to test. Checking any or all of the boxes in the category panel will reveal only relevant tests for that choice. Selecting any of the blocks in the window will take you to that specific management area.
Choose from among several configurations based on modular building blocks and offered in cost-optimized, balanced, or performance options. Order, receive, and implement resources quickly, seamlessly grow capacity ahead of demand and only pay for what you use above your reserve capacity with transparent, near-real-time visibility into costs and usage.
This is a well-thought-through test drive for anyone interested in HPE GreenLake for Storage Fabric Management.
Final Thoughts
HPE GreenLake for Storage Fabric Management delivers the toolset to simplify SAN management tasks, making life easier for IT administrators. The user interface is intuitive, and the navigation tools will speed up management, monitoring, configuration, and troubleshooting–all of which are critical in busy data centers tasked with more responsibilities.
The system can easily incorporate new hardware support as HPE GreenLake for Storage Fabric Management develops. This is true for the hardware and protocol support. HPE supports Brocade switches and Fibre Channel out of the gate. Still, they’re openly signaling their plan to add further support from their portfolio with HPE M-Series Ethernet Switching, Aruba Networking, and other data center mainstays like Cisco.
What’s interesting about this particular GreenLake service is that customers can start with existing infrastructure. In other cases, like GreenLake File Services, for instance, there’s an investment of some kind in hardware. With HPE GreenLake for Storage Fabric Management, customers with an existing Brocade fabric can start immediately. This makes the latest fabric management offering the easiest GreenLake service to start testing.
180-day trial program for HPE GreenLake for Storage Fabric Management.
Additional information regarding HPE GreenLake for Storage Fabric Management can be found here.
This report is sponsored by HPE. All views and opinions expressed in this report are based on our unbiased view of the product(s) under consideration.
Engage with StorageReview
Newsletter | YouTube | Podcast iTunes/Spotify | Instagram | Twitter | TikTok | RSS Feed

