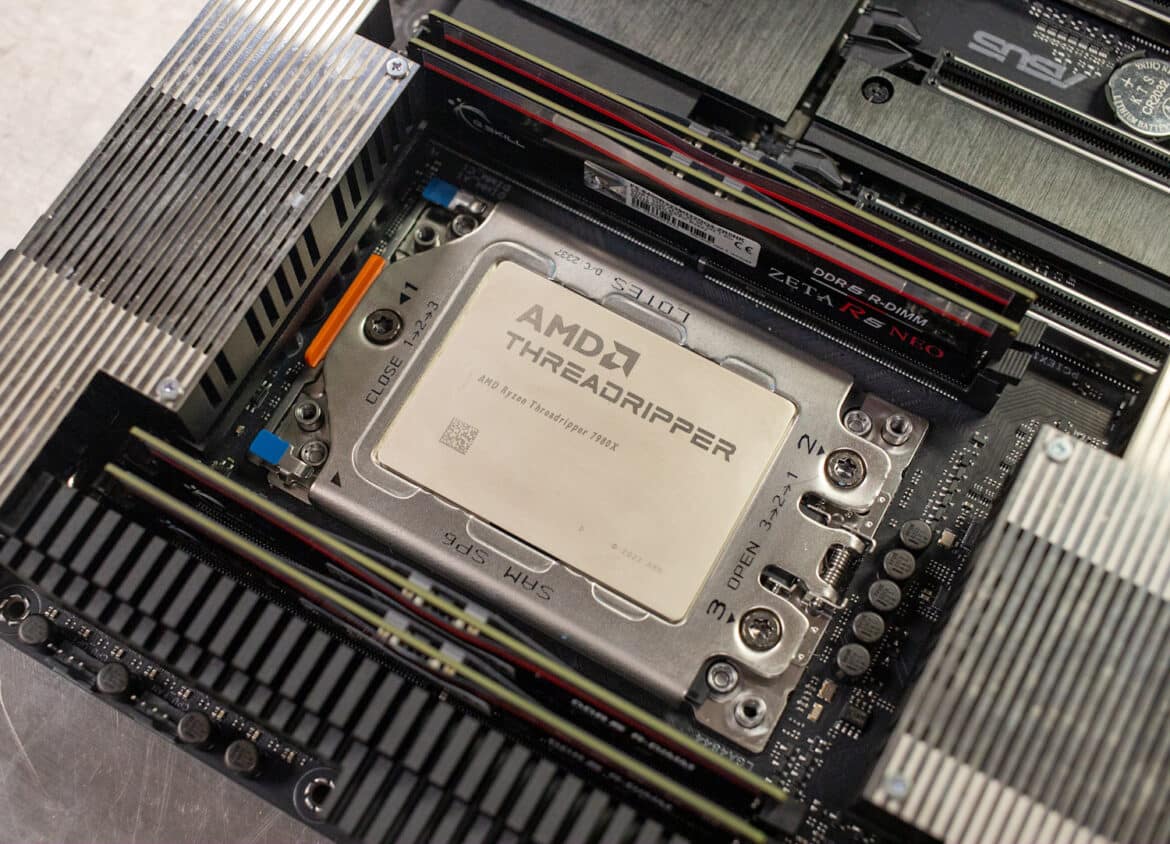
We don’t often dip into the traditional desktop systems or CPU space, we usually stop at workstations, that may or may not be equipped with server CPUs. But AMD has the desktop prosumer world abuzz with a new set of non-PRO Ryzen Threadripper High-End Desktop (HEDT) chips that range from 24 to 64 cores. For those that don’t require the performance and manageability in the PRO family, the AMD Ryzen Threadripper 7000 Series stands out as an easily overclockable option for enthusiasts that every last drop of performance out of their PC. In this AMD Ryzen Threadripper 7980X Review, we take a look at the top-end 64-core SKU, the 7970X 32-core SKU, and the highest-end AMD Ryzen Threadripper PRO 7995WX 96-core CPU for reference.
We don’t often dip into the traditional desktop systems or CPU space, we usually stop at workstations, that may or may not be equipped with server CPUs. But AMD has the desktop prosumer world abuzz with a new set of non-PRO Ryzen Threadripper High-End Desktop (HEDT) chips that range from 24 to 64 cores. For those that don’t require the performance and manageability in the PRO family, the AMD Ryzen Threadripper 7000 Series stands out as an easily overclockable option for enthusiasts that every last drop of performance out of their PC. In this AMD Ryzen Threadripper 7980X Review, we take a look at the top-end 64-core SKU, the 7970X 32-core SKU, and the highest-end AMD Ryzen Threadripper PRO 7995WX 96-core CPU for reference.
High-end Desktop (HEDT) Primer
High-end Desktop (HEDT) CPUs mirror the growing needs of professionals and enthusiasts who engage in tasks like 3D rendering, scientific simulations, and high-end gaming, which require more power than standard consumer CPUs.
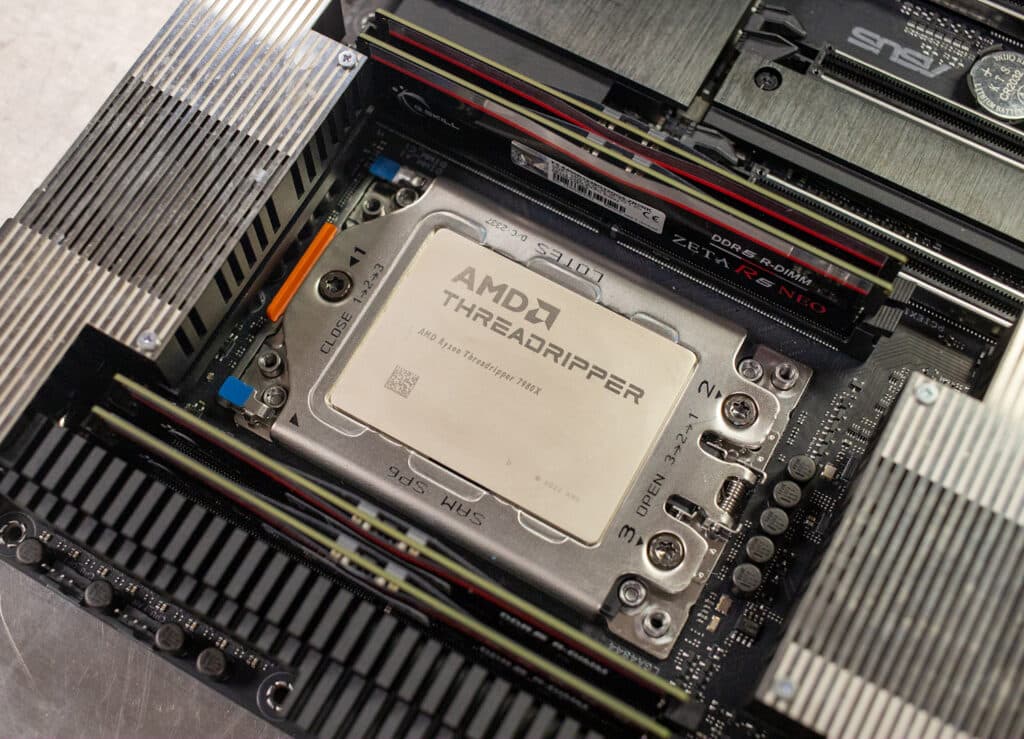
Intel initially led the HEDT market with its Core i7 Extreme and X-series processors, which provided an increased core count, better memory configurations, and additional PCIe lanes compared to their mainstream counterparts. Ultimately, these CPUs catered to users who wanted or required more than what standard desktop processors could provide, marking a new segment of high-performance computing at the desktop level.
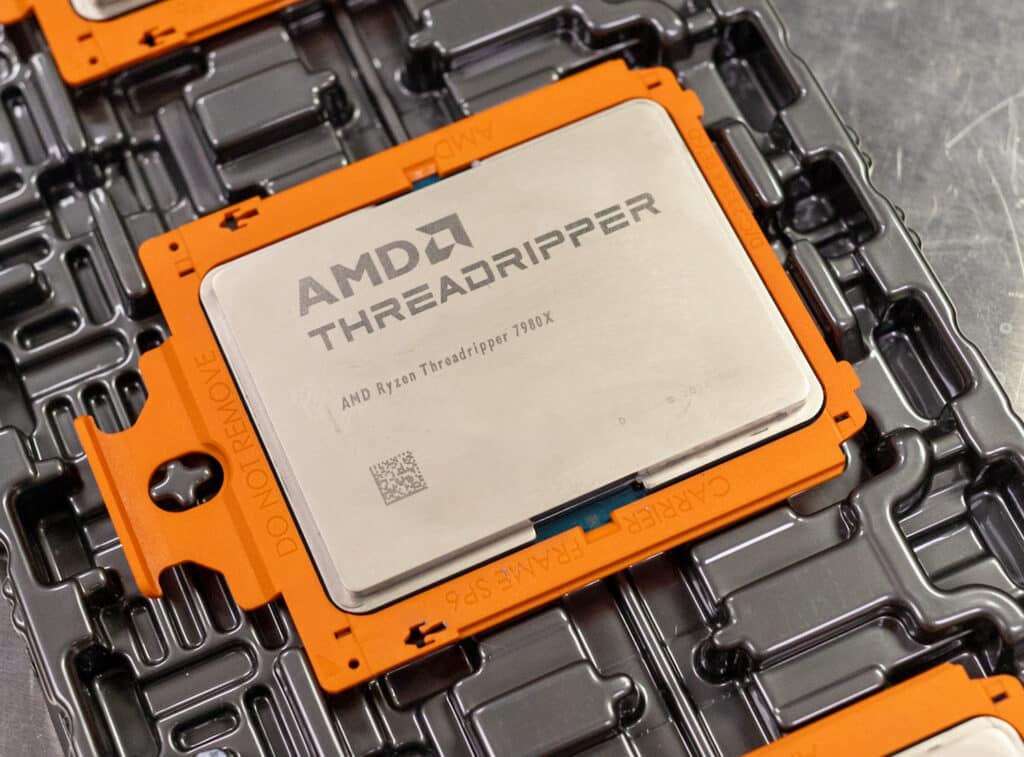
When AMD launched its Ryzen Threadripper series, it introduced serious competition for Intel and pushed the boundaries of what was possible in desktop computing. Generally speaking, this new line of CPUs appealed to a broad range of professionals and enthusiasts, like content creators and scientists, who required robust multitasking capabilities and high-level parallel processing power.
The release of the Threadripper 5000 series solidified AMD’s position in the HEDT market. Based on the advanced Zen 3 architecture, these processors significantly improved instructions per cycle (IPC), energy efficiency, and impressive computational power. The Threadripper 5000 series was known for balancing high core counts with enhanced single-threaded performance, a very important feature for numerous applications.
Needless to say, when AMD announced the Ryzen Threadripper 7000 Series last month, the HEDT gang was excited. The 7000 Series still brings tremendous power to the table but they are more affordable than the PRO CPUs and are much more accessible when it comes to overclocking.
Ready For Extreme Performance?
The AMD Ryzen Threadripper 7000 Series marks the return of Threadripper to the high-end desktop market with the ultimate, highly overclockable, high-end desktop experience, along with the highest clock speeds achievable on a Threadripper processor. Power, performance, and efficiency are all maximized with the innovative 5nm process and “Zen 4” architecture, available in both the DIY market and through SI partners.
The AMD Ryzen Threadripper PRO 7000 Series is a total game-changer for the workstation crowd. Imagine the previous generation’s power, then crank it up to eleven. Built on 5nm “Zen 4” architecture, they are the top dogs in the world of professional applications and heavy-duty multitasking.
These processors sport serious muscle with up to 96 cores and 192 threads. That’s the most found in any workstation processor, perfect for tackling intense tasks like simulations, generative design, rendering, and compiling software. These processors pack up to 384MB of L3 cache and support eight channels of DDR5 memory. That means more room and speed for memory-hungry apps.
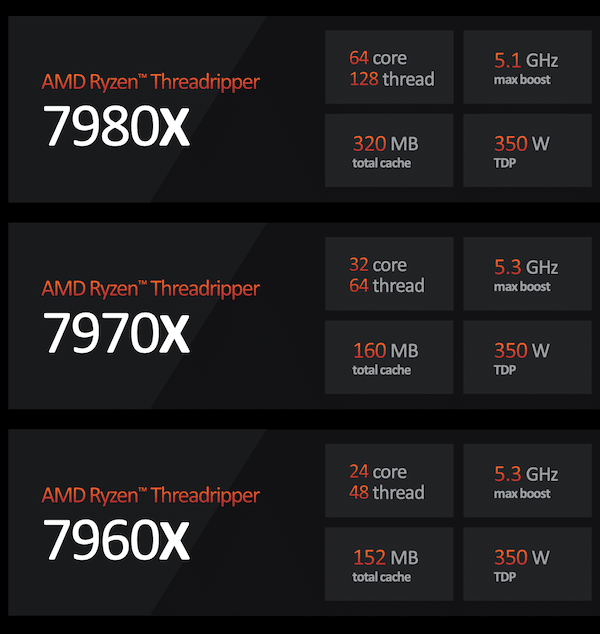
AMD Ryzen Threadripper 7000 Series Specifications Overview
AMD Ryzen Threadripper 7980X: This is the high-end model of the series and features 64 cores and 128 threads, this processor provides immense multitasking and parallel processing capabilities. Moreover, with a base clock speed of 3.2 GHz and a boost up to 5.1 GHz, it ensures rapid execution of both single-threaded and multi-threaded applications.
The processor is equipped with a massive 256MB of L3 cache, enhancing data retrieval and processing efficiency, and supports quad-channel memory, allowing for high bandwidth data transfer. The Threadripper 7980X also has a substantial TDP of 350W, reflecting its high performance and likely necessitating robust cooling solutions.
The 7980X offers up to 48 lanes of PCIe Gen5 for ample bandwidth for high-speed storage, multiple GPUs, and other PCIe devices. Overclocking capabilities enable enthusiasts and professionals to push its performance even further. As the flagship model of non-PRO 7000-series variants, the 7980X retails for just under $5K, positioning itself as the ultimate premium option for users.
AMD Ryzen Threadripper 7970X: This model comes with 32 CPU cores and 64 threads, offering a balance between high multi-threaded performance and energy efficiency. It can reach a max boost clock of up to 5.3 GHz, which is slightly higher than the 7980X, allowing for quick task handling. The base clock is set at a robust 4.0 GHz. Like its higher-end sibling, it lacks an included thermal solution and also has a TDP of 350W, necessitating a robust cooling solution.
AMD Ryzen Threadripper 7960X: The 7960X, with 24 CPU cores and 48 threads, is tailored for users who need strong multi-threaded capabilities but may not require the extreme core counts of the higher models. It shares the same max boost clock of up to 5.3 GHz as the 7970X and has a slightly higher base clock of 4.2 GHz. With no thermal solution provided and a TDP of 350W, it requires an effective cooling system to keep performance levels stable.
Just for comparison, let’s take a look at the Threadripper PRO 7000 Series:
AMD Ryzen Threadripper PRO 7995WX: This top-tier model from the PRO lineup boasts an unprecedented 96 CPU cores and 192 threads, making it a titan for professional workstations. Its max boost clock reaches up to 5.1 GHz, while the base clock starts at 2.5 GHz, allowing it to handle extensive multitasking and demanding applications with ease. The absence of a thermal solution and a TDP of 350W implies that a high-end cooling system is essential for this CPU. I
Incidentally, we recently reviewed this SKU in the HP Z6 G5 A workstation. Most large systems vendors will be shipping integrated workstations with the PRO chips in the next 2-3 months.
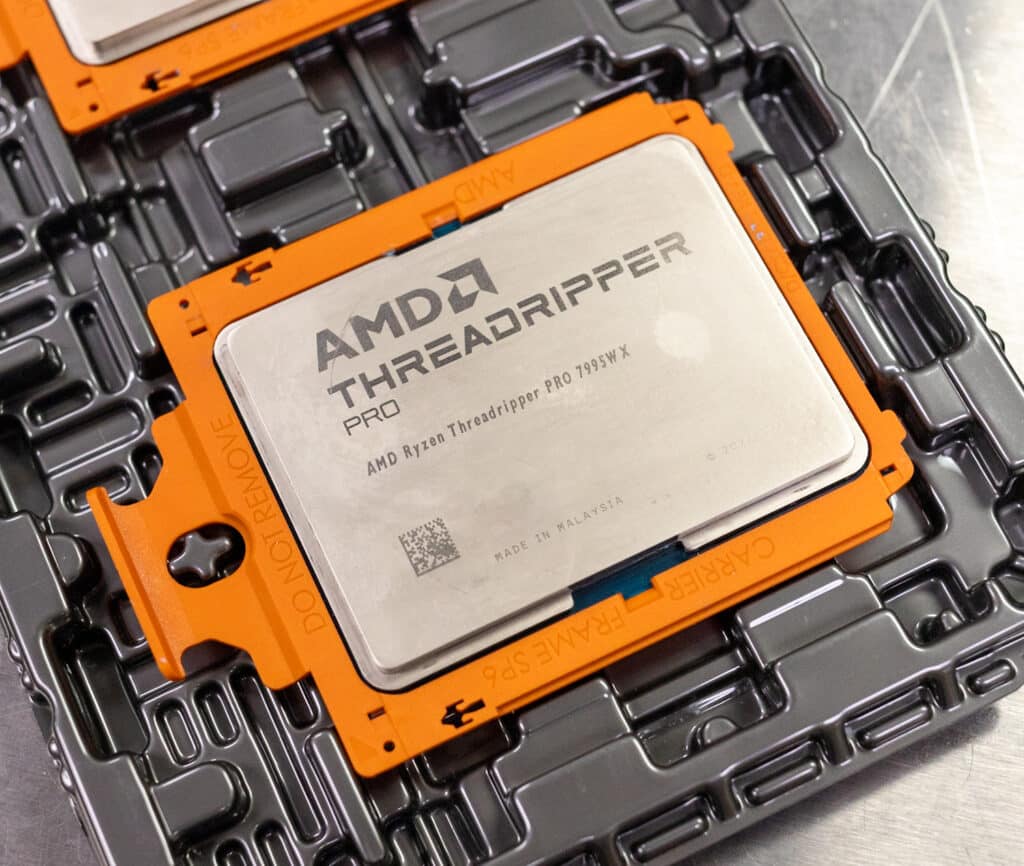
AMD Ryzen Threadripper PRO 7985WX: A step down from the highest model, the 7985WX still provides an impressive 64 cores and 128 threads, suitable for intense computing tasks such as 3D rendering and complex simulations. It can achieve a max boost clock of up to 5.1 GHz and has a base clock of 3.2 GHz. As with other models in the series, it requires a separate cooling solution due to the lack of an included thermal solution and a TDP of 350W.
AMD Ryzen Threadripper PRO 7975WX: Designed for professionals who need a balance of core count and power efficiency, the 7975WX offers 32 cores and 64 threads. With a max boost clock of up to 5.3 GHz and a base clock of 4.0 GHz, it is adept at handling a variety of demanding applications. The 350W TDP and lack of an included thermal solution mean users will need to invest in a capable cooling system.
AMD Ryzen Threadripper PRO 7965WX and Below: These models, including the 7965WX with 24 cores and 48 threads, down to the 7945WX with 12 cores and 24 threads, cater to a range of professional users who require fewer cores but still demand high-thread performance for specialized tasks. They offer max boost clocks up to 5.3 GHz, with base clocks that vary from 4.2 GHz to 4.7 GHz as the core counts decrease. Each of these CPUs shares the same need for an external cooling solution and has a TDP of 350W.
Key Specs Overview – AMD Ryzen Threadripper 7000 and 7000 PRO
| Model | # of CPU Cores | # of Threads | Max. Boost Clock | Base Clock | Default TDP |
|---|---|---|---|---|---|
| AMD Ryzen Threadripper 7980X | 64 | 128 | Up to 5.1 GHz | 3.2 GHz | 350W |
| AMD Ryzen Threadripper 7970X | 32 | 64 | Up to 5.3 GHz | 4.0 GHz | 350W |
| AMD Ryzen Threadripper 7960X | 24 | 48 | Up to 5.3 GHz | 4.2 GHz | 350W |
| AMD Ryzen Threadripper PRO 7995WX | 96 | 192 | Up to 5.1 GHz | 2.5 GHz | 350W |
| AMD Ryzen Threadripper PRO 7985WX | 64 | 128 | Up to 5.1 GHz | 3.2 GHz | 350W |
| AMD Ryzen Threadripper PRO 7975WX | 32 | 64 | Up to 5.3 GHz | 4.0 GHz | 350W |
| AMD Ryzen Threadripper PRO 7965WX | 24 | 48 | Up to 5.3 GHz | 4.2 GHz | 350W |
| AMD Ryzen Threadripper PRO 7955WX | 16 | 32 | Up to 5.3 GHz | 4.5 GHz | 350W |
| AMD Ryzen Threadripper PRO 7945WX | 12 | 24 | Up to 5.3 GHz | 4.7 GHz | 350W |
| *Note, each model requires a dedicated GPU and does not some with a cooler in the box. | |||||
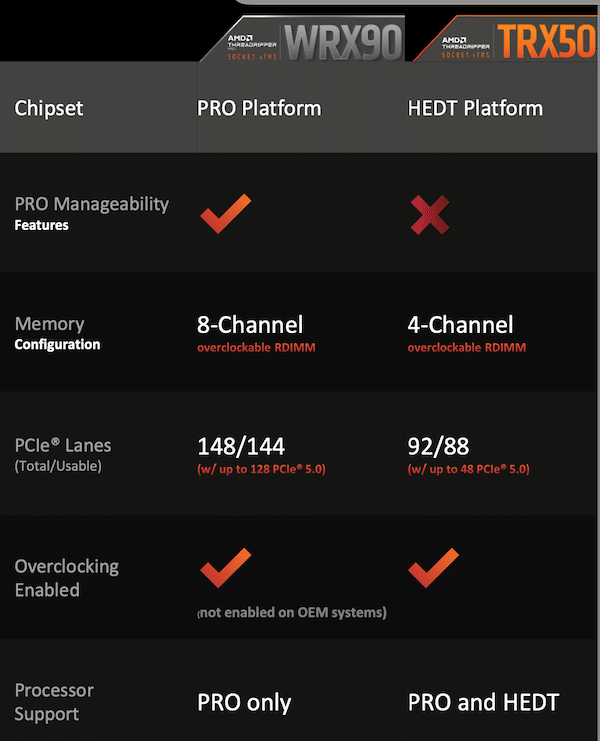
The flagship PRO 7995WX is certainly an extraordinary CPU tailored for the rigors of a professional workstation, offering an expanded set of features like additional memory channels and a greater number of PCIe lanes to handle intensive computing tasks. That said, while this processor is technically compatible with consumer motherboards, it’s important to note that it would not unlock its full potential due to its limitations. Specifically, you lose half the memory channels, and PCIe lanes would be noticeably reduced, resulting in the underutilization of the workstation’s advanced capabilities.
AMD Ryzen Threadripper 7000 Series Performance
Testing configuration
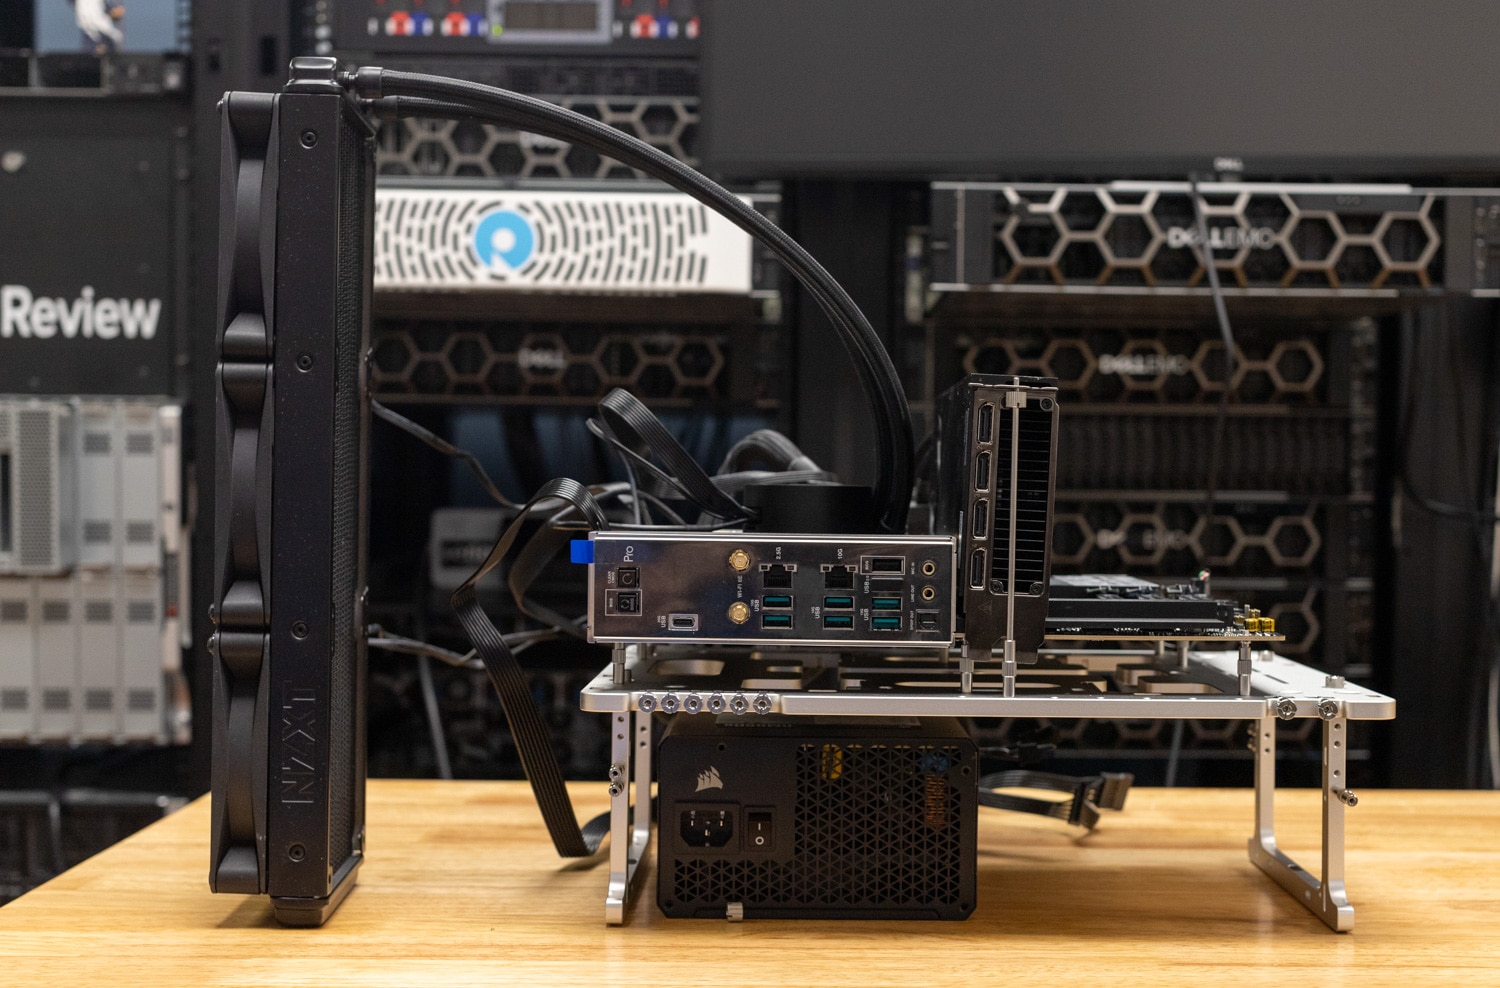
To evaluate the capabilities of the AMD Ryzen Threadripper 7000 Series, we have assembled a unique testing environment with the use of the Open Benchtable. While we did delve into some extreme overclocking as a second round of testing, for the baselines we ran our system as an end user might in a daily driver configuration. We used the EXPO II memory setting which allowed the 128GB of GSKILL memory to operate at 6400 speed, and attached the small, albeit stout NZXT Kraken AIO cooler, and allowed the system to manage all of it’s own thermals. We saw water temperatures idle below 32c and fully loaded it remained under 50c, as reported by the NZXT kraken. We did not test the motherboard features fully, skipping things like the WiFi and Bluetooth, but the 10g networking worked flawlessly. Drive speed was irrelevant to the CPU testing, but we did use a Samsung 980 Pro m.2 in the first slot under the GPU, which noted some thermal concerns. For power we employed our own EVGA Supernova 1600w G+ to feed the powerful CPU’s, but the ASUS TRX50-SAGE WiFi does support dual PSU, however we did not test this for redundancy support.
Key components of our setup:
- AMD Threadripper PRO 7995WX CPU (96 cores, 192 threads, 5.1GHz max boost, 350W TDP)
- AMD Threadripper 7980X CPU (64 cores, 128-thread, 5.1GHz max boost, 350W TDP)
- AMD Threadripper 7970X CPU (32 cores, 64 threads, 5.3GHz max boost, 350W TDP)
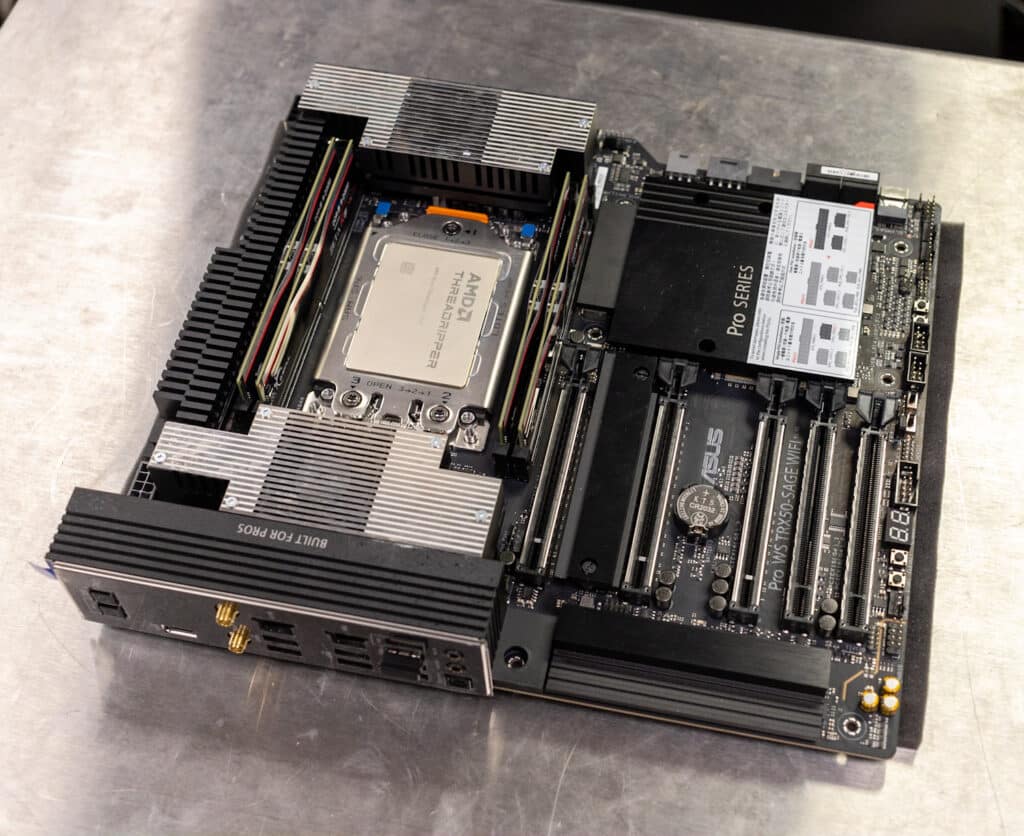
- ASUS Pro WS TRX50-SAGE WIFI Motherboard
- NVIDIA RTX 6000 Ada
- 128GB (4×32) RDIMM Memory (GSKILL 6400 EXTO II)
- NZXT Kraken 360mm AIO Liquid Cooler
Testing Note: We conducted tests using the pre-release BIOS version 0217. We anticipate minimal differences in upcoming releases, primarily in post-behavior aspects.
Benchmarks
Our selected benchmarks include tests like SPECviewperf, SPECworkstation, Cinebench, Geekbench, 3Dmark, and Blender, which are strategically chosen to test various aspects of the CPUs’ performance.
SPECviewperf and SPECworkstation will demonstrate how the Threadripper CPU handles 3D rendering, digital content creation, and CAD applications in professional and creative tasks. These tests underscore the CPUs’ suitability for professionals who demand high computational and graphical performance.
Cinebench and Geekbench will provide insights into the raw processing capabilities of the Ryzen Threadripper 7980X, particularly focusing on multi-threading and single-core performance. These benchmarks are expected to reveal these CPUs’ remarkable speed and efficiency in both heavy-duty and everyday computing tasks. In gaming and graphics simulations, as tested by 3Dmark, we will look at computational power with graphical processing efficiency. This will be crucial for users requiring a processor that excels in gaming and professional graphics applications. Blender benchmarks will test the Threadripper 7000 Series in real-world 3D creation scenarios.
There are more tests below, so let’s get right into it.
SPECviewperf 2020
Our first test is SPECviewperf 2020, the worldwide standard for measuring graphics performance of professional applications under the OpenGL and Direct X application programming interfaces. The viewsets (or benchmarks) represent graphics content and behavior from actual applications without having to install the applications themselves. The newest version of this benchmark went through significant updates late last year, including new viewsets taken from traces of the latest versions of 3ds Max, Catia, Maya, and Solidworks applications. In addition, they added support within all viewsets for both 2K and 4K resolution displays.
| SPECviewperf2020 Viewsets (Higher is better) | Threadripper 7980X with NVIDIA RTX 6000 Ada |
Transport HX FT65T-B8050 (AMD Genoa-X 9684X, NVIDIA A6000) | Dell Precision 7865 (AMD 5995WX, RTX A6000) | Dell Precision 7960 (Xeon w9-3495X, RTX 6000 Ada) |
| 3dsmax-07 | 212.03 | 137.15 | 140.79 | 218.62 |
| Catia-06 | 146.09 | 101.31 | 100.57 | 114.68 |
| Creo-03 | 211.36 | 141.58 | 137.39 | 128.74 |
| Energy-03 | 88.9 | 43.1 | 42.95 | 84.46 |
| Maya-06 | 559.54 | 341.36 | 334.18 | 424.08 |
| Medical-03 | 130.96 | 68.33 | 35.98 | 74.16 |
| Snx-04 | 951.06 | n/a | 453.83 | 932.85 |
| Sw-05 | 293/96 | 168.18 | 170.08 | 299.69 |
In the SPECviewperf2020 benchmark, the Ryzen Threadripper 7980X showcased impressive performance, significantly outperforming other CPUs in most tested viewsets. For instance, in the Maya-06 viewset, the Threadripper 7980X scored a remarkable 559.54, substantially higher than its closest competitors, including the AMD Genoa-X 9684X and the Dell Precision models with AMD 5995WX and Xeon w9-3495X CPUs. This dominance is consistent across various viewsets, such as Catia-06 and Creo-03, where the Threadripper 7980X again leads with scores of 146.09 and 211.36, respectively, underlining its superiority in handling complex graphical tasks. The Ryzen Threadripper 7980X, with its 64 cores demonstrates its robust capability in rendering and graphical simulations. It establishes itself as a top-tier choice for professionals seeking unparalleled performance in demanding applications.
SPECworkstation 3
SPECworkstation3 specializes in benchmarks designed for testing all key aspects of workstation performance; it uses over 30 workloads to test CPU, graphics, I/O, and memory bandwidth. The workloads fall into broader categories such as Media and Entertainment, Financial Services, Product Development, Energy, Life Sciences, and General Operations. We will list the broad-category results for each instead of the individual workloads. The results are an average of all the individual workloads in each category.
| SPECworkstation 3 (Higher is better) |
Threadripper 7980X with NVIDIA RTX 6000 Ada |
Transport HX FT65T-B8050 (AMD Genoa-X 9684X, NVIDIA A6000) |
| Media and Entertainment | 9.81 | 7.45 |
| Product Development | DNF | DNF |
| Life Sciences | 15.27 | 14.35 |
| Financial Services | 23.85 | 25.45 |
| Energy | 0 | 20.97 |
| General Operations | 4.42 | 2.64 |
| GPU Compute | 10.87 | 7.4 |
In the SPECworkstation 3 benchmark, the Ryzen Threadripper 7980X demonstrates notable performance, particularly in the ‘Media and Entertainment’ and ‘Life Sciences’ categories, scoring 9.81 and 15.27, respectively. These results surpass those of the Transport HX FT65T-B8050, including an AMD Genoa-X 9684X and NVIDIA A6000, indicating the Threadripper’s superior handling in these areas. However, in the ‘Financial Services’ category, the Threadripper trails slightly with a score of 23.85 compared to the Transport HX’s 25.45. This indicates that while the 7980X excels in certain sectors, its performance can vary across different types of workloads.
In ‘General Operations’ and ‘GPU Compute,’ the 7980X continues to hold an edge with scores of 4.42 and 10.87, further cementing its position as a strong contender in diverse computational tasks. Overall, the Ryzen Threadripper 7980X establishes itself as a versatile and powerful CPU, albeit with some variations in performance across different workloads.
Blender OptiX
Blender is an open-source 3D modeling application. This benchmark was run using the Blender Benchmark utility. The score is samples per minute, with higher being better.
| Blender OptiX (Samples per minute; Higher is better) | Threadripper PRO 7995WX (96 core) (CPU-only) |
Threadripper 7980X (64 core) (CPU-only) |
Threadripper 7980X with NVIDIA RTX 6000 Ada (GPU) | Threadripper 7970X (32core) (CPU-only) |
TYAN Transport HX FT65T-B8050 (AMD Genoa-X 9684X, NVIDIA A6000) | Dell Precision 7865 (AMD 5995WX, RTX A6000) | Dell Precision 7960 (Xeon w9-3495X, RTX 6000 Ada) | AMD Bergamo 9684X (CPU-only) |
| Monster | 952 | 784 | 6,628 | 481 | 2,875 | 2,839 | 6,709 | 879 |
| Junkshop | 613 | 524 | 3,075 | 321 | 1,714 | 1,595 | 3,165 | 605 |
| Classroom | 437 | 378 | 3,108 | 237 | 1,490 | 1,384 | 3,176 | 421 |
When focusing on CPU-only operations, the Threadripper PRO 7995WX, boasting a 96-core setup, leads the pack with its superior sample processing ability, achieving a high of 952 samples per minute in the ‘Monster’ test. This is a clear indication of its prowess in handling complex, CPU-intensive rendering tasks. In contrast, the 64-core Threadripper 7980X performs admirably but trails behind the PRO model, as expected given the fewer core counts.
Overall, the Blender OptiX benchmark results illustrate the Threadripper’s strong capabilities in rendering tasks while highlighting the competitive performance of the Xeon w9-3495X.
Luxmark
Another 3D benchmark we will look at is LuxMark, an OpenCL GPU benchmarking utility. Again, the HX FT65T-B8050 displayed similar results to the Threadripper Dell Precision 7865.
| Luxmark (Higher is better) | Threadripper PRO 7995WX with NVIDIA RTX 6000 Ada (96 core) |
Threadripper 7980X with NVIDIA RTX 6000 Ada (64 core) |
Threadripper 7970X with NVIDIA RTX 6000 Ada (32 core) |
TYAN Transport HX FT65T-B8050 (AMD Genoa-X 9684X) | Dell Precision 7865 (AMD 5995WX) | Dell Precision 7960 (Xeon w9-3495X) |
| Hallbench | 33,026 | 32,167 | 33,141 | 20,904 | 20,991 | 31,731 |
| Food | 14,478 | 14,378 | 14,549 | 7,927 | 7,866 | 13,471 |
The Threadripper PRO 7995WX shows a strong performance in the ‘Hallbench’ scene, scoring 33,026, which interestingly is slightly lower than the 32-core 7970X’s score of 33,141. This minor divergence could be attributed to the specific optimization of the LuxMark benchmark for different core counts or the nature of the ‘Hallbench’ scene itself. Meanwhile, the 64-core 7980X positions itself comfortably in the middle with a score of 32,167.
When the task shifts to the ‘Food’ scene, the scores between the Threadripper models converge more closely, with the 7970X edging out a marginal lead at 14,549, the PRO 7995WX following with 14,478, and the 7980X closely behind at 14,378. These results suggest that in certain rendering scenarios, having a higher core count does not necessarily equate to a proportionate increase in performance, indicating a point of diminishing returns when it comes to raw core counts.
Comparing the Threadripper CPUs to the other processors in the benchmark, it’s clear that the 7000 Series holds a significant lead over the TYAN Transport and Dell Precision models equipped with the AMD Genoa-X 9684X and the 5995WX, respectively. Both of these alternatives score significantly lower, particularly in the ‘Food’ scene. The Xeon w9-3495X, however, shows competitive performance, especially in the ‘Hallbench’ test where it nearly matches the 7980X and outperforms the other non-Threadripper CPUs.
ESRI
Next up is the Environmental Systems Research Institute (Esri) benchmark. Esri is a supplier of Geographic Information System (GIS) software. Esri’s Performance Team designed their PerfTool add-in scripts to launch the ArcGIS Pro automatically. This application uses a “ZoomToBookmarks” function to browse various predefined bookmarks and create a log file with all the key data points required to predict the user experience. The script automatically loops the bookmarks three times to account for caching (memory and disk cache). In other words, this benchmark simulates heavy graphical use that one might see through Esri’s ArcGIS Pro software.
The tests consist of three main datasets. Two are 3-D city views of Philadelphia, PA, and Montreal, QC. These city views contain textured 3-D multipatch buildings draped on a terrain model and draped aerial images. The third dataset is a 2-D map view of the Portland, OR region. This data contains detailed information for roads, land use parcels, parks and schools, rivers, lakes, and hill-shaded terrain.
The 7980X produced impressive results and, overall, better than the Xeon w9-3495X.
First up is the Montreal model, where the 7980X showed better average FPS than the rest of the competition, though it fell to second place in minimum average FPS (just behind the Xeon w9-3495X).
| ESRI ArcGIS Pro 2.3 Montreal | |
| Average FPS | Average |
| Threadripper 7980X with NVIDIA RTX 6000 Ada (64 core) |
825.23 |
| TYAN Transport HX FT65T-B8050 (AMD Genoa-X 9684X, NVIDIA A6000) | 582.63 |
| Dell Precision 7865 (AMD 5995WX, A6000) | 574.46 |
| Dell Precision 7960 (Xeon w9-3495X, RTX 6000 Ada) | 809.92 |
| Minimum FPS | Average |
| Threadripper 7980X with NVIDIA RTX 6000 Ada (64 core) |
371.62 |
| TYAN Transport HX FT65T-B8050 (AMD Genoa-X 9684X, NVIDIA A6000) | 283.24 |
| Dell Precision 7865 (AMD 5995WX, A6000) | 272.18 |
| Dell Precision 7960 (Xeon w9-3495X, RTX 6000 Ada) | 345.45 |
Next is the Philly model. Here it was just a hair behind in FPS compared to the Xeon w9-3495X.
| ESRI ArcGIS Pro 2.3 Philly | |
| Average FPS | Average |
| Threadripper 7980X with NVIDIA RTX 6000 Ada (64 core) |
597.79 |
| TYAN Transport HX FT65T-B8050 (AMD Genoa-X 9684X, NVIDIA A6000) | 461.57 |
| Dell Precision 7865 (AMD 5995WX, A6000) | 451.09 |
| Dell Precision 7960 (Xeon w9-3495X, RTX 6000 Ada) | 603.84 |
| Minimum FPS | Average |
| Threadripper 7980X with NVIDIA RTX 6000 Ada (64 core) |
316.77 |
| TYAN Transport HX FT65T-B8050 (AMD Genoa-X 9684X, NVIDIA A6000) | 256.25 |
| Dell Precision 7865 (AMD 5995WX, A6000) | 254.78 |
| Dell Precision 7960 (Xeon w9-3495X, RTX 6000 Ada) | 321.11 |
Portland is the last model, where the Ryzen Threadripper 7980X had noticeably better average and minimum FPS than the rest of the board.
| ESRI ArcGIS Pro 2.3 Portland | |
| Average FPS | Average |
| Threadripper 7980X with NVIDIA RTX 6000 Ada (64 core) |
3,549.31 |
| TYAN Transport HX FT65T-B8050 (AMD Genoa-X 9684X, NVIDIA A6000) | 2,538.7 |
| Dell Precision 7865 (AMD 5995WX, A6000) | 1,986.56 |
| Dell Precision 7960 (Xeon w9-3495X, RTX 6000 Ada) | 2,172.16 |
| Minimum FPS | Average |
| Ryzen Threadripper 7980X (64 Core) | 1,558.39 |
| TYAN Transport HX FT65T-B8050 (AMD Genoa-X 9684X, NVIDIA A6000) | 1,144.50 |
| Dell Precision 7865 (AMD 5995WX, A6000) | 1,280.95 |
| Dell Precision 7960 (Xeon w9-3495X, RTX 6000 Ada) | 1,270.35 |
OctaneBench
Next, we look at OctaneBench, a benchmarking utility for OctaneRender (another 3D renderer with RTX support similar to V-Ray).
As you can see below, the performance is again very similar between the Ryzen Threadripper 7980X and Xeon w9-3495X, with the former just beating out the latter in all categories.
These scores indicate that the GPU can handle demanding rendering tasks rapidly and efficiently, which is crucial for professionals in fields like 3D animation and visual effects. That said, it also implies that the 7980X effectively manages its role in the rendering process, ensuring that the system is well-balanced and that the CPU is not a performance bottleneck.
| OctaneBench (Score, higher is better) | Kernel | Threadripper 7980X with NVIDIA RTX 6000 Ada (64 core) |
TYAN FT65T-B8050 (AMD Genoa-X 9684X) | Dell Precision 7865 (AMD 5995WX) | Dell Precision 7960 (Xeon w9-3495X) |
| Interior | Info channels | 44.47 | 18.38 | 18.39 | 42.64 |
| Interior | Direct lighting | 131.31 | 68.09 | 66.64 | 125.49 |
| Interior | Path tracing | 163.35 | 88.12 | 86.40 | 156.94 |
| Idea | Info channels | 26.45 | 11.64 | 11.33 | 24.40 |
| Idea | Direct lighting | 103.54 | 53.49 | 52.14 | 99.20 |
| Idea | Path tracing | 123.47 | 65.79 | 64.19 | 118.34 |
| ATV | Info channels | 69.15 | 28.92 | 28.75 | 67.51 |
| ATV | Direct lighting | 130.47 | 75.17 | 74.09 | 127.96 |
| ATV | Path tracing | 164.89 | 94.61 | 93.20 | 161.16 |
| Box | Info channels | 35.83 | 15.57 | 15.60 | 34.24 |
| Box | Direct lighting | 122.76 | 67.38 | 66.25 | 119.04 |
| Box | Path tracing | 133.68 | 76.12 | 75.01 | 130.36 |
Blackmagic RAW Speed Test
We have also started running Blackmagic’s RAW speed test, which tests video playback performance. Additionally, this test is more of a hybrid test pooling both CPU and GPU in a Real-World scenario for RAW decoding.
| Blackmagic RAW Speed Test (Higher is better) | Threadripper PRO 7995WX with NVIDIA RTX 6000 Ada (96 core) |
Threadripper 7980X with NVIDIA RTX 6000 Ada (64 core) |
Threadripper 7970X with NVIDIA RTX 6000 Ada (32core) |
TYAN FT65T-B8050 (AMD Genoa-X 9684X) | Dell Precision 7865 (AMD 5995WX) | Dell Precision 7960 (Xeon w9-3495X) |
| 8K CPU | 142 FPS | 153 FPS | 162 FPS | 115 FPS | 122 FPS | 124 FPS |
| 8K CUDA | 157 FPS | 176 FPS | 217 FPS | 185 FPS | 153 FPS | 194 FPS |
The Blackmagic RAW Speed Test results present interest results for the AMD Threadripper 7000 series. Contrary to expectations, the 32-core Threadripper 7970X leads the trio with an impressive 162 FPS in the CPU test and a remarkable 217 FPS utilizing CUDA, which suggests an exceptional balance between core count and processing efficiency for video tasks. The 64-core 7980X, while not quite reaching the same peak, still delivers a robust 153 FPS in CPU and 176 FPS in CUDA, outperforming the 96-core Threadripper PRO 7995WX, which clocks in at 142 FPS and 157 FPS, respectively. These results could be indicative of the diminishing returns on performance with increasing core counts in certain workloads or may reflect a scenario where the RAW Speed Test is unable to fully leverage the additional cores.
When compared to the non-Threadripper CPUs, the TYAN and Dell Precision systems equipped with AMD Genoa-X 9684X and AMD 5995WX processors show lower performance, while the Dell Precision with the Xeon w9-3495X demonstrates competitive CUDA performance.
7-Zip Compression
The built-in memory benchmark in the popular 7-Zip utility demonstrates the CPU performances of each machine well. We run this test at a 128MB dictionary size when possible.
The 7980X Threadripper was the best performer here compared to the Xeon W9-3495X in the 7960, the FT65T-B8050 with the AMD Genoa-X 9684X, and the other Threadripper CPU in the Dell Precision.
| 7-Zip Compression Benchmark (Higher is better) | Threadripper PRO 7995WX (96 core)* |
Threadripper 7980X (64 core) |
Threadripper 7970X (32core) |
TYAN FT65T-B8050 (AMD Genoa-X 9684X) | Dell Precision 7865 (AMD 5995WX, A6000) | Dell Precision 7960 (Xeon w9-3495X, RTX 6000 Ada) |
| Compressing | ||||||
| Current CPU Usage | 5,629% | 5,733% | 5,288% | 4,327% | 3,302% | 3,279% |
| Current Rating/Usage | 4.177 GIPS | 6.129 GIPS | 4.441 GIPS | 3.571 GIPS | 6.913 GIPS | 6.917 GIPS |
| Current Rating | 235.109 GIPS | 351.361 GIPS | 234.824 GIPS | 154.498 GIPS | 228.231 GIPS | 226.810 GIPS |
| Resulting CPU Usage | 5,615% | 5,726% | 5,401% | 4,317% | 3293% | 3,316% |
| Resulting Rating/Usage | 5.464 GIPS | 6.109 GIPS | 5.588 GIPS | 3.597 GIPS | 6.973 GIPS | 6.934 GIPS |
| Resulting Rating | 306.827 GIPS | 349.777 GIPS | 302.364 GIPS | 155.293 GIPS | 229.630 GIPS | 229.905 GIPS |
| Decompressing | ||||||
| Current CPU Usage | 5,952 | 5,882% | 6,283% | 4,703% | 6,181% | 6,106% |
| Current Rating/Usage | 6.229 GIPS | 6.630 GIPS | 6.180 GIPS | 5.235 GIPS | 5.265 GIPS | 3.760 GIPS |
| Current Rating | 370.738 GIPS | 390.024 GIPS | 388.255 GIPS | 155.293 GIPS | 325.422 GIPS | 229.591 GIPS |
| Resulting CPU Usage | 5,924% | 5,886% | 6,255% | 4,657% | 6,188% | 5,860% |
| Resulting Rating/Usage | 6.380 GIPS | 6.701 GIPS | 6.217 GIPS | 5.297 GIPS | 5.265 GIPS | 2.954 GIPS |
| Resulting Rating | 377.931 GIPS | 394.393 GIPS | 388.885 GIPS | 246.655 GIPS | 325.813 GIPS | 231.485 GIPS |
| Total Rating | ||||||
| Total CPU Usage | 5,770% | 5,806% | 5,828% | 4,478% | 4,740% | 4,588% |
| Total Rating/Usage | 5.922 GIPS | 6.405 GIPS | 5.202 GIPS | 4.447 GIPS | 6.119 GIPS | 5.444 GIPS |
| Total Rating | 343.379 GIPS | 372.085 GIPS | 345/624 GIPS | 200.974 GIPS | 277.721 GIPS | 230.695 GIPS |
*7-zip is core limited to 64 cores
In the 7-Zip Compression Benchmark, the AMD Threadripper series showcases its strength in multi-threaded processing, particularly in data compression and decompression tasks. The Threadripper PRO 7995WX delivers solid performance, achieving a total rating of 343.379 GIPS (Giga Instructions Per Second). This is impressive, but it’s slightly outpaced by the 64-core 7980X, which hits a higher total rating of 372.085 GIPS.
The 32-core Threadripper 7970X also performs well. With a total rating of 345.624 GIPS, showcasing that it’s more than capable in handling intensive compression tasks. When comparing these results to the other CPUs in the benchmark, it’s evident that the Threadripper series, particularly the 7980X, stands out in terms of performance efficiency, even against other high-core-count CPUs like the AMD Genoa-X 9684X and the Dell Precision models.
Geekbench 6
Geekbench 6 is a cross-platform benchmark that measures overall system performance. However, looking at the single-core vs. multi-core and the OpenCL benchmark would be interesting. Higher scores are better.
You can find comparisons to any system you want in the Geekbench Browser.
| Geekbench 6 | Threadripper PRO 7995WX (96 core) |
Threadripper 7980X with NVIDIA RTX 6000 Ada (64 core) |
Threadripper 7970X (32 core) |
TYAN Transport HX FT65T-B8050 (AMD Genoa-X 9684X) | Dell Precision 7960 (Xeon w9-3495X) | AMD Bergamo 9754 1p/128c (stock configuration) |
| CPU Benchmark – Single-Core | 2,822 | 2,882 | 2,963 | 2,097 | 2,302 | 1,738 |
| CPU Benchmark – Multi-Core | 25,2551 | 27,331 | 26,227 | 21,077 | 18,157 | 18,683 |
| GPU Benchmark – OpenCL | N/A | 359,939 | N/A | 211,091 | 303,158 | N/A |
For single-core performance, the Threadripper CPUs show a progressive increase in scores with decreasing core counts: the 32-core 7970X leads with a score of 2,963, followed by the 64-core 7980X at 2,882, and the 96-core PRO 7995WX trailing slightly at 2,822
In the multi-core segment, the 7980X surprisingly outperforms the PRO 7995WX, scoring 27,331 against the latter’s 25,2551. The 7970X also puts up a strong showing with 26,227, indicating that despite having fewer cores, these CPUs are highly efficient in tasks that leverage multiple cores simultaneously. This might reflect a balance between the number of cores, their individual performance, and the architecture’s ability to effectively utilize all available cores.
The 7980X was the only GPU we tested with the GPU Benchmark (OpenCL), which generated a staggering score of 359,939, showcasing its capability in GPU-accelerated tasks.
When compared to other CPUs like the AMD Genoa-X 9684X and the Xeon w9-3495X, the Threadripper models generally exhibit superior performance, particularly in multi-core processing.
Cinebench R23
Maxon’s Cinebench R23 is a CPU rendering benchmark that utilizes all CPU cores and threads. We ran it for both multi- and single-core tests. Higher scores are better.
| Cinebench R23 | Threadripper PRO 7995WX (96 core) |
Threadripper 7980X (64 Cores) |
Threadripper 7970X (32 core) |
TYAN FT65T-B8050 (AMD Genoa-X 9684X) | Dell Precision 7960 (Xeon w9-3495X) | AMD Bergamo 9754 1p/128c (stock configuration) |
| CPU (Multi-Core) (Points) |
100,964 | 93,065 | 62,638 | 94,754 Points | 58,774 | 103,876 |
| CPU (Single-Core) (Points) |
1,814 | 1,906 | 1,935 | 1,299 | 1,689 | 1,098 |
| MP Ratio | 55.65x | 48.84x | 32.37x | 72.96x | 34.79x | 94.65x |
In the multi-core test, the Threadripper PRO 7995WX showed a score of 100,964 points, underscoring its exceptional capability in handling multi-threaded workloads. However, the AMD Bergamo 9754, with 128 cores, slightly surpasses it with 103,876 points. The 64-core 7980X also shows strong performance at 93,065 points, while the 32-core 7970X scores a respectable 62,638 points. This tiered performance across the Threadripper lineup demonstrates the scaling efficiency of their architecture with increasing core counts.
In single-core performance, however, the trend reverses. The 7970X leads among the Threadrippers with 1,935 points, followed by the 7980X at 1,906 points, and the PRO 7995WX trailing at 1,814 points. This indicates that while the PRO 7995WX excels in tasks that leverage multiple cores, its individual core performance isn’t as optimized as its counterparts with fewer cores. This is a common theme in high-core-count CPUs where the focus is on parallel processing rather than single-thread efficiency.
Cinebench 2024
Here are the results for the 2024 version of Cinebench, looking at the CPU and GPU performance.
| Cinebench R23 | Threadripper PRO 7995WX (96 core) (CPU-only) |
Threadripper 7980X (64 core) (CPU-only) |
Threadripper 7980X with NVIDIA RTX 6000 (GPU) | Threadripper 7970X (32 core) (CPU-only) |
| CPU (Multi-Core) (Points) |
5,421 | 5,568 | 31,276 -GPU | 3,619 |
| CPU (Single-Core) (Points) |
108 | 113 | 117 | |
| MP Ratio | 50.4x | 49.19x | 30.94 |
The 64-core 7980X leads in the multi-core CPU test with 5,568 points, slightly outperforming the 96-core Threadripper PRO 7995WX, which scores 5,421 points, and significantly surpassing the 32-core 7970X at 3,619 points. In single-core tests, the trend is inverse, with the 7970X scoring the highest at 117 points, followed by the 7980X at 113, and the PRO 7995WX at 108, indicating better single-core efficiency in models with fewer cores.
The GPU-accelerated performance of the 7980X showed an impressive 31,276 points.
The MP Ratio results further reflect the efficiency of each CPU in utilizing its cores, with the 7980X showing a more balanced performance between single and multi-core tasks.
UL Procyon AI Inference
UL’s Procyon estimates a workstation’s performance for professional apps. We ran the AI Inference test for Windows Machine Learning on CPU, GPU, and NVIDIA Tensor RT. Lower times are better, and higher overall scores are better.
| UL Procyon Average Inference Times | AI Windows ML AMD Ryzen Threadripper 7980X (64 core) | Ryzen Threadripper 7980X (AI Tensor RT – NVIDIA RTX 6000 Ada) | Ryzen Threadripper 7980X (AI Windows ML – NVIDIA RTX 6000 Ada) |
| MobileNet V3 | 3.47 | 0.32 | 0.50 |
| ResNet 50 | 5.96 | 1.00 | 0.88 |
| Inception V4 | 23.45 | 2.99 | 2.17 |
| DeepLab V3 | 22.66 | 2.68 | 8.21 |
| YOLO V3 | 33.88 | 2.49 | 3.64 |
| REAL-ESRGAN | 2058.28 | 79.37 | 83.85 |
| Overall Score | 165 | 1,768 | 1,367 |
The AMD Ryzen Threadripper 7980X demonstrates varied performance across different models and configurations. When using AI Windows ML, the Threadripper 7980X shows longer inference times, such as 3.47 seconds for MobileNet V3 and 2058.28 seconds for REAL-ESRGAN. However, the performance significantly improves with AI Tensor RT and A6000 Ada, or AI Windows ML with A6000 Ada, evidenced by much shorter inference times like 0.32 and 0.50 seconds for MobileNet V3, respectively. This substantial improvement in processing speed, particularly with the support of A6000 Ada, highlights Threadripper’s capability to handle complex AI tasks more efficiently when paired with powerful GPUs.
y-cruncher
y-cruncher is a multi-threaded and scalable program that can compute Pi and other mathematical constants to trillions of digits. Since its launch in 2009, y-cruncher has become a popular benchmarking and stress-testing application for overclockers and hardware enthusiasts. Faster is better in this test.
| y-cruncher (Total Computation time) | Ryzen Threadripper PRO 7995WX (96 core) |
Ryzen Threadripper 7980X (64 core) |
Threadripper 7970X (32 core) |
TYAN FT65T-B8050 (AMD Genoa-X 9684X) | Dell Precision 7960 (Xeon w9-3495X) | AMD Genoa-X 9684X 1P/96C |
| 1 billion digits (Seconds) |
9.657 | 8.693 | 7.795 | 10.233 | 12.788 | 10.296 |
| 2.5 billion digits (Seconds) |
22.953 | 21.319 | 20.627 | 20.543 | 34.459 | N/A |
| 10 billion digits (Seconds) |
100.739 | 105.875 | 98.674 | 72.568 | 157.770 | 72.377 |
Here, the performance of the AMD Ryzen Threadripper CPUs varies significantly depending on the complexity of the task. For calculating 1 billion digits, the 32-core Threadripper 7970X leads with the fastest computation time of 7.795 seconds, outperforming its higher-core-count counterparts. The 64-core 7980X follows at 8.693 seconds, while the 96-core Threadripper PRO 7995WX takes slightly longer at 9.657 seconds.
As the computational challenge increases to 2.5 billion and 10 billion digits, the differences in processing times become more pronounced. For 2.5 billion digits, all Threadripper models show an increase in computation time, with the PRO 7995WX completing the task in 22.953 seconds, closely followed by the 7980X and the 7970X. However, in the 10 billion digits calculation, the 7980X records a longer time (105.875 seconds) than both the PRO 7995WX (100.739 seconds) and the 7970X (98.674 seconds).
3Dmark
Based on the images provided, the 3DMark results show that the new AMD Ryzen Threadripper 7980X processor with NVIDIA’s RTX 6000 Ada exhibits strong performance across various benchmarks. The “Fire Strike Extreme” and “Time Spy Extreme” scores indicate impressive graphics capabilities, while the “PCI Express feature test” demonstrates significant data transfer capabilities. The “CPU Profile” scores reveal the processor’s ability to handle multiple tasks efficiently, reflecting its adeptness at multitasking.
Here is a rundown of all the results:
| AMD Ryzen Threadripper 7980X 64 Core processor with NVIDIA’s RTX 6000 Ada | ||
|---|---|---|
| Benchmark Test | Score | Assessment |
| Fire Strike Extreme | 31,808 | Indicates powerful graphics performance. |
| Fire Strike Ultra | 21,101 | Reflects high-end performance capabilities. |
| PCI Express Feature Test | 26.80 GB/s | Impressive data transfer capability. |
| Port Royal | 19,684 | Good performance in ray-tracing rendering. |
| Speed Way | 7,674 | Good performance in rendering a racing game. |
| Time Spy | 17,214 | Overall strong gaming performance. |
| Time Spy Extreme | 15,895 | Good capabilities at higher resolutions. |
| CPU Profile | 26,512 (max threads) | Efficient management of various levels of multitasking. |
Conclusion
The AMD Ryzen Threadripper 7000 Series is an impressive entry into the HEDT market, redefining expectations for power and performance. As expected, the new AMD Ryzen Threadripper 7000 Series certainly had an incredible showing during our gauntlet of benchmarks. We specifically looked at the two highest core parts, the 7980X, and 7970X models, comparing with the Threadripper PRO 7995WX for good measure.
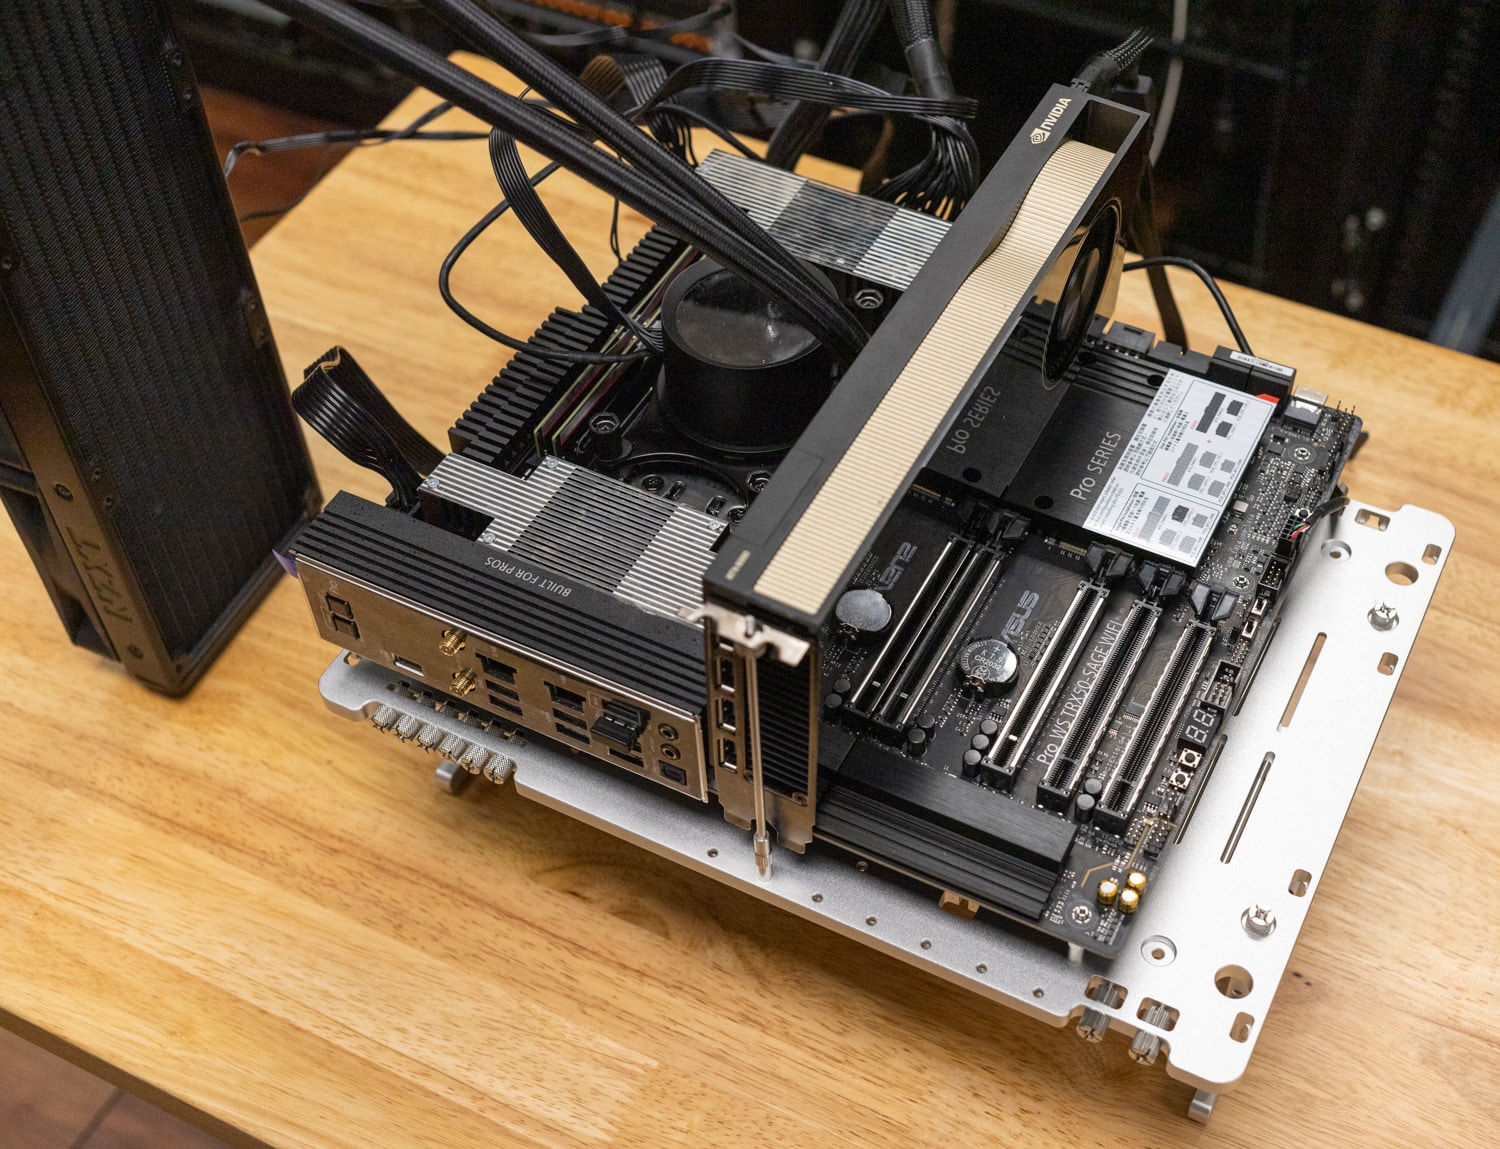
The testbed this time around is a little different, AMD sent us the ASUS Pro WS TRX50-SAGE WIFI motherboard, along with the requisite accessories to complete the review. The AMD TRX50 Chipset supports PRO processors, which means that both standard HEDT 7000 and PRO Threadripper CPUs can be used in our baord. However, using a PRO processor in a “consumer” motherboard comes with limitations, such as losing half the memory channels and a noticeable reduction in PCIe lanes.
The 64-core AMD Ryzen Threadripper 7980X struck a notable balance between high-core-count efficiency and single-threaded performance. It excelled in a variety of tasks, from rendering and simulations to general computing, showing a blend of power and versatility. This model proved to be particularly adept in scenarios that required a balance of multi-threading and single-core capabilities, making it a strong contender for users needing a blend of speed and raw processing power.
While having fewer cores, the 32-core 7970X did not really lag significantly in performance. It showcased impressive overall results, where it often outperformed its higher-core-count counterparts in single-core benchmarks thanks to the increased clock speed. This model is particularly well-suited for tasks that require a high degree of single-thread efficiency, such as gaming and less parallel-intensive applications, while still providing considerable multi-threading capabilities for more demanding tasks at a lesser cost.
Overall the new Ryzen Threadripper 7000 CPUs look very impressive. In some cases, like single-treaded work, they rival not only the Threadripper PRO units but also the highest-end EPYC server CPUs. While not exactly an apples-to-apples comparison, the data is instructive for scale. Clearly now more than ever it’s important to understand the end user’s application needs, selecting the right chips to go into builds. If nothing else, AMD has given the industry a ton of amazing options, system builders should have no trouble putting together truly powerful builds that can be tailored for any workload. Oh, and then there’s the overclocking benefit that the 7000’s offer.
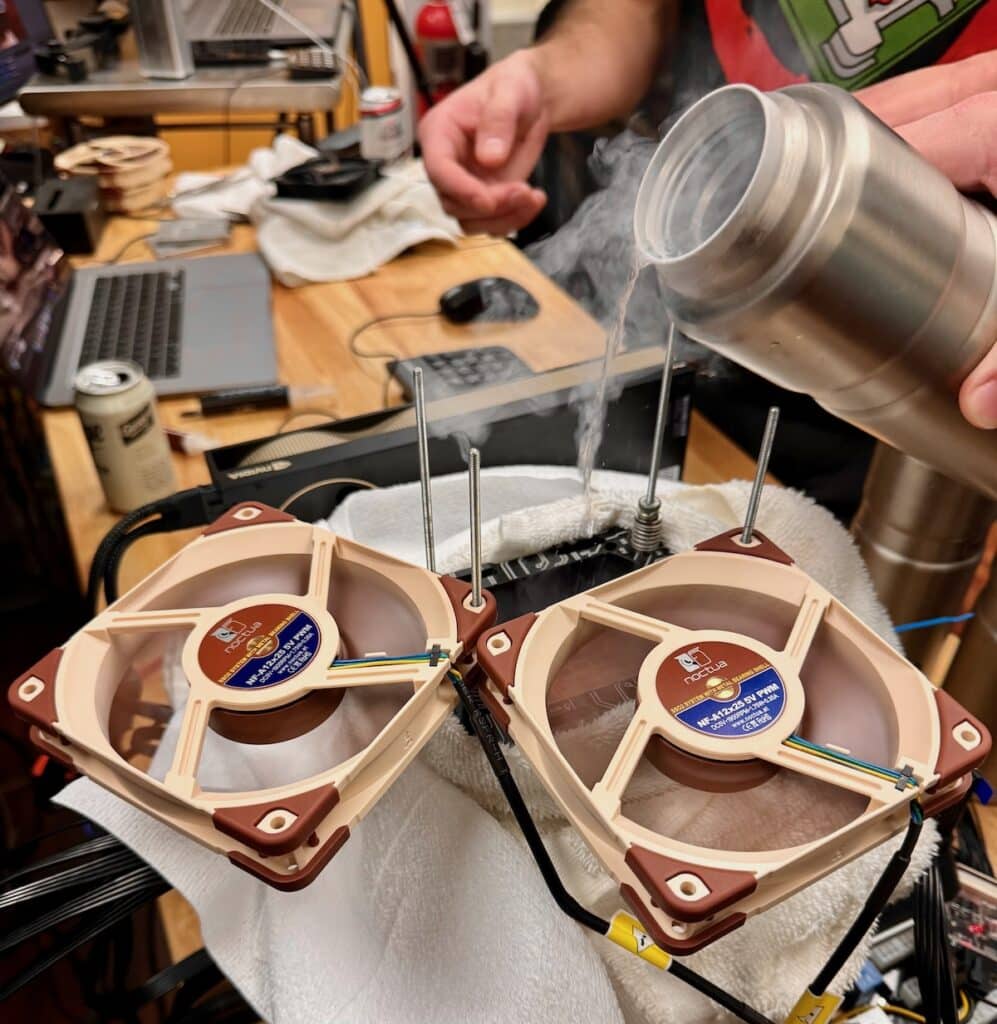
Looking ahead, excitement is brewing on our end for part 2 of this review where we will explore overclocking these CPUs with liquid nitrogen. This next phase promises to push the limits of what’s possible with the new Threadripper series, unlocking world-record levels of performance. So, stay tuned for another in-depth dive into AMD’s Threadripper 7000 Series, as we continue to explore its remarkable capabilities in the realm of high-performance computing.
Engage with StorageReview
Newsletter | YouTube | Podcast iTunes/Spotify | Instagram | Twitter | TikTok | RSS Feed

