Following our recent hypervisor article, we dive deeper and analyze the top hypervisors regarding features, web interfaces, and performance capabilities. Specifically, we are comparing KVM on RHEL, Proxmox, VMWare ESXI 8, and Microsoft HyperV.
In the wake of VMWare’s recent acquisition by Broadcom, the tech community has been abuzz with discussions about the changes, most notably the shift to subscription-based licensing. This has prompted many companies and MSPs to scout for more cost-effective hypervisor options. In response to this growing interest, we have compared leading hypervisors, presenting them as viable alternatives for those considering a switch or exploring options in the market.
Our goal is to analyze these hypervisors regarding their features, web interfaces, and performance capabilities. Specifically, we are comparing KVM on RHEL, Proxmox, VMWare ESXI 8, and Microsoft HyperV.

KVM on RHEL (RedHat Enterprise Linux)
KVM (Kernel-based Virtual Machine) is a Linux-based open-source hypervisor that transforms Linux into a type-1 hypervisor by embedding core virtualization capabilities into the Linux kernel. While KVM can be hosted on any Linux distribution, Red Hat Enterprise Linux (RHEL) is popular due to its robust support and enterprise-grade features.
RHEL is a versatile Linux distribution that can be installed with or without a desktop environment. The management interface, Cockpit, is an optional service that can be added during installation. Cockpit, an open-source project not exclusive to RHEL, facilitates basic Linux instance and service management. However, it is not primarily designed as a hypervisor management tool and lacks certain features like memory ballooning. This limitation is not due to the hypervisor but rather the management interface.
For more advanced virtualization and container orchestration, Red Hat offers OpenShift, a comprehensive platform with a cloud-first approach that can also be hosted on-premises. OpenShift provides robust tools for managing containerized applications and infrastructure, including advanced networking, storage, and security capabilities. However, OpenShift has a minimum production requirement of at least three nodes, making it less suitable for smaller deployments.
Proxmox
Proxmox, based on Debian, is another KVM implementation gaining traction in homelabs and enterprises, though not yet on the scale of ESXi or HyperV. It’s free and open-source and offers subscription-based support and updates.
Its web UI is superior to Cockpit for virtualization tasks, simplifies resource management, and includes advanced features and tuneables. Proxmox also offers advanced backups, snapshots, and firewall management. However, it doesn’t fully match VMWare’s breadth, especially for tasks like vGPU setup, which require command-line intervention. Feature-wise, Proxmox mirrors KVM on RHEL, maintaining parity with leading hypervisors.
VMWare ESXi
VMWare’s ESXi is renowned for its comprehensive feature set. While it stands alone as a hypervisor, its full capabilities are unlocked with vCenter, which centralizes management.
Being a hypervisor first, built from the ground up. ESXi’s web UI is the most refined among its competitors. It brings almost all functionalities, including features like vGPU management, into the web-based interface, rarely necessitating console access. Tied with solutions like VMWare Horizon, ESXi offers an integrated VDI solution. Its standalone and cluster capabilities are further enhanced by services like vCenter, VSAN, and Horizon, making it a robust one-stop option.
Hyper-V
Microsoft’s Hyper-V has established itself, particularly in Windows-centric environments. Management in Hyper-V is handled via Hyper-V Manager for smaller setups or SCVMM for larger environments. The UI is user-friendly, especially for those accustomed to Windows, and it also offers features like vGPU management straight from the UI. Hyper-V excels in Windows-based virtualization and integrates well with other Microsoft solutions, such as Azure, facilitating easy upgrades and cloud migrations. While it’s an obvious choice for Windows-focused environments, it may not be as well-suited for other use cases.
How Well Did They Perform?
Let’s compare the performance of these hypervisors and see how they stack among each other.
Testing Methodology
Our primary objective is to evaluate the performance overhead associated with each hypervisor, using it as a key metric for comparison. Our tests focus on comparing Multithreaded Performance, Memory Bandwidth, and Storage I/O Performance.
Our benchmarks include Linux Kernel Compilation, Apache, OpenSSL, SQLite, Stream, and FIO. They are administered at least three times using the Phoronix Test Suite and repeated until a low variance in results is achieved. During testing, features like web interfaces or desktop environments are closed to ensure optimal conditions.
Our baseline is the bare metal performance, and all numbers are scaled relative to it as a percentage. The same tests are then replicated for each hypervisor; we configure a VM running Ubuntu. Crucially, each VM is allocated the entirety of the host’s resources. The VMs are configured using default settings without any additional optimizations.
Following some concerns regarding the results, we wanted to provide additional context behind our testing methodology. The tests were designed to simulate the experience of someone new to the environment, such as a user migrating from an ESXi or Hyper-V-focused setup. When we refer to “defaults,” we mean the preselected options when creating a VM, with the only configured settings being those for resource allocation (vCPUs, RAM, and Storage).
Concerns were also raised about why all resources were allocated for these tests. There are two main reasons for this approach. Comparing these results to bare metal as a baseline provides more context for our measured performance. Secondly, it allows us to judge performance across NUMA nodes. In production environments, it is challenging to avoid NUMA node jumps, making it essential to include this aspect in our tests.
We felt additional clarification was warranted. To address these concerns, we have rerun all tests, including an optimized Proxmox configuration and further tests with more realistic VM resource allocations.
In our new tests, optimized Proxmox uses host as CPU type, NUMA Enabled, q35 as Machine, and OVMF (UEFI) as BIOS. Cache was set to Write Back for storage since we are using a Raid Controller, and SSD Emulation was turned on. In all other cases with all other hypervisors, only resources were allocated to the VM with their respective UIs, and no additional settings were changed.
Test Setup
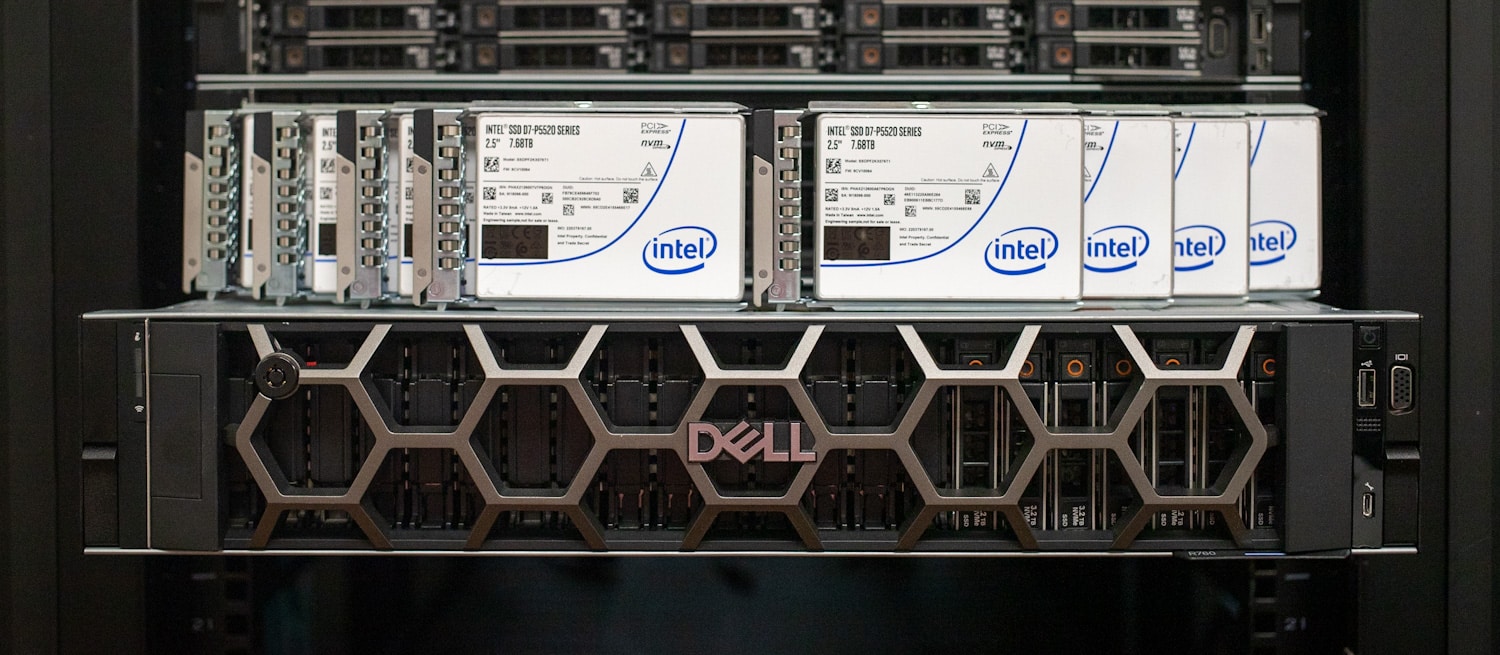
For our tests, we’re employing the Dell R760.
Specifications:
- Intel Xeon Sapphire Rapids 6430
- 256GB DDR5
- 8 x 7.68TB Solidigm P5520 in RAID5 on Dell PERC12
(Note: The server used for the original tests was upgraded to accommodate the new Emerald Rapids processors. As a result, the original results cannot be directly compared with the new results. Therefore, all tests were rerun to ensure consistency and accuracy.)
These new tests will be run on the Dell R760 with Direct Liquid Cooling.
Specifications:
- Intel Xeon Emerald Rapids 8580
- 256GB DDR5
- 8 x 7.68TB Solidigm P5520 in RAID5 on Dell PERC12
Test Results
Let’s dive deeper into the individual test results.
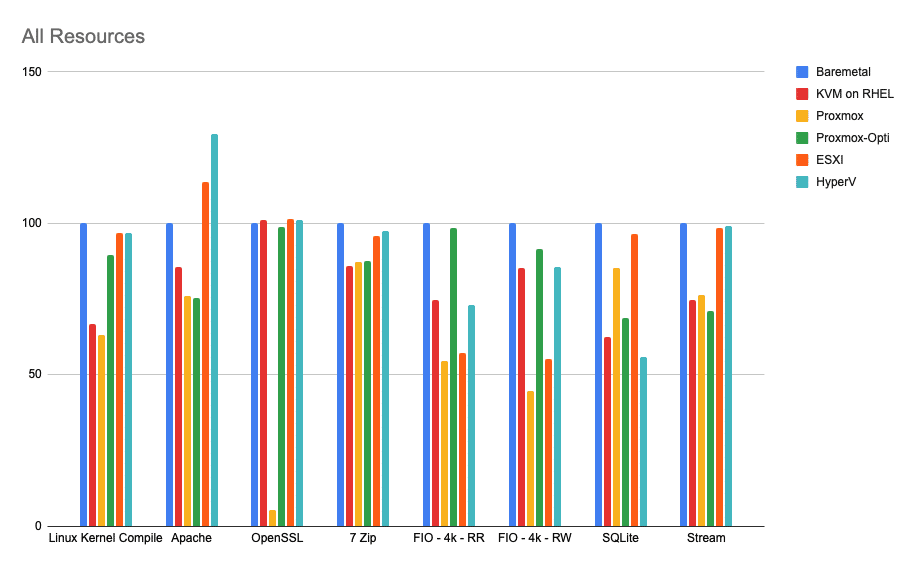
The Linux Kernel Compile test, which is CPU-intensive and measures the time taken to compile the Linux kernel, showed that ESXi and Hyper-V performed exceptionally well, achieving 96.79% and 96.70% of bare metal performance, respectively. KVM on RHEL achieved 66.61%, while stock Proxmox lagged with 63.28%. However, Optimized Proxmox scored a respectable 89.71% of bare metal performance.
In the Apache benchmark, which evaluates the performance of the Apache web server under high concurrent connections and requests, ESXi and Hyper-V demonstrated impressive results, with 113.64% and 129.62% of bare metal performance, respectively. KVM on RHEL achieved 85.72%, stock Proxmox scored 75.90%, and Optimized Proxmox scored 75.31%. Notably, ESXi and Hyper-V exceeded bare metal performance, likely due to hardware accelerators in newer chips, suggesting these hypervisors can utilize these accelerators without manual configuration and tuning.
The OpenSSL test, which measures the cryptographic performance of the CPU, showed that ESXi, Hyper-V, and KVM on RHEL performed remarkably well, with 101.35%, 101.27%, and 101.15% of bare metal performance, respectively. Stock Proxmox struggled with only 5.33%, whereas Optimized Proxmox scored 98.91%.
In the 7-Zip compression test, which evaluates the compression and decompression performance, ESXi and Hyper-V demonstrated strong performance, with 95.98% and 97.56% of bare metal performance, respectively. KVM on RHEL, stock Proxmox, and Optimized Proxmox all came close at 85.81%, 87.17%, and 87.43%, respectively.
The FIO test, which measures the performance of the storage subsystem with 4k block size random read and write, showed that ESXi achieved 57.41% for random read and 55.27% for random write, while Hyper-V scored 72.95% for random read and 85.71% for random write. KVM on RHEL achieved 74.60% for random read and 85.37% for random write. Stock Proxmox came in at 54.71% for random read and 44.71% for random write, while Optimized Proxmox performed the best in this test with 98.57% for random read and 91.49% for random write.
The SQLite test, which measures the performance of the SQLite database, showed that ESXi demonstrated 96.44% of bare metal performance. Hyper-V scored 55.94%, while KVM on RHEL achieved 62.52%. Interestingly, stock Proxmox came in at 85.27%, scoring better than Optimized Proxmox, which came in at 68.86%. The exact cause is not entirely apparent, but the tests were run twice on fresh installs of the hypervisor and VM to ensure repeatability.
The Stream benchmark, which evaluates memory bandwidth performance, showed that ESXi and Hyper-V demonstrated strong performance, with 98.30% and 99.01% of bare metal performance, respectively. KVM on RHEL, stock Proxmox, and Optimized Proxmox scored close to each other at 74.60%, 76.24%, and 71.04%, respectively.
Overall, Hyper-V emerged as the top performer, averaging 92% of bare metal performance. ESXi was slightly behind with an average performance of 89%, Optimized Proxmox was a close third at 85%, KVM on RHEL came in fourth at 79%, and stock Proxmox trailed behind at 61%.
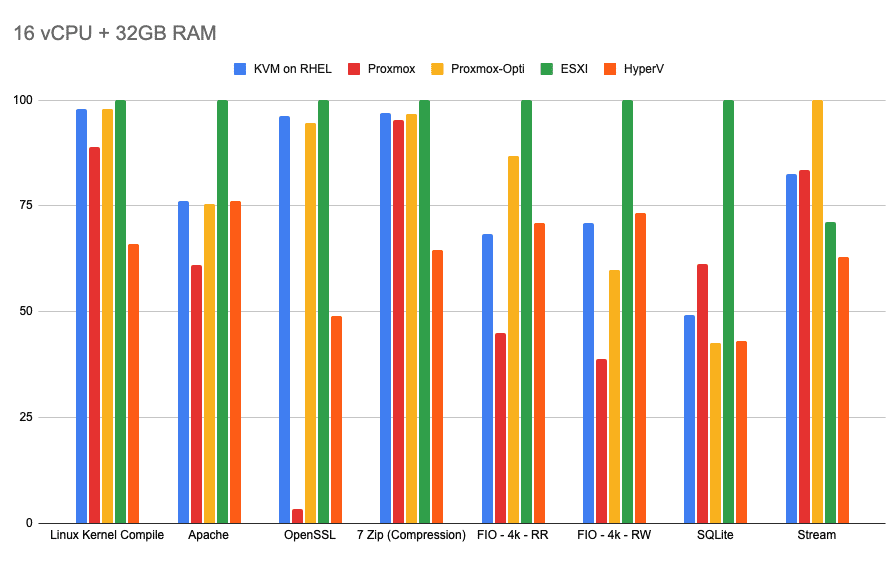
In a more realistic VM resource allocation scenario, the numbers were normalized to the best performer in each category. For the Linux Kernel Compile benchmark, ESXi scored the best, with KVM on RHEL coming in second with 97.90% and Optimized Proxmox at a close third with 97.88%. Stock Proxmox came in fourth with 88.90%, and Hyper-V lagged with 66.05%.
For the Apache benchmark, ESXi once again scored the best, with KVM on RHEL coming in second with 76.25% and Hyper-V coming in at a close third with 76.14%. Optimized Proxmox was also very close with 75.36%, while stock Proxmox came in last with 61.11%.
In the OpenSSL benchmark, ESXi maintained its position by scoring the best, with KVM on RHEL coming in second with 96.25%, Optimized Proxmox coming in third with 94.48%, Hyper-V only getting 48.96%, and stock Proxmox finishing last with 3.42%.
For the 7-Zip compression test, ESXi continued to score the best, with KVM on RHEL, Optimized Proxmox and stock Proxmox coming in very close at 96.84%, 96.59%, and 95.40%, respectively, while Hyper-V still lagged behind with 64.48%.
In the FIO test, ESXi scored the best in both random read and random write. For random read, Optimized Proxmox came in second with 86.81%, Hyper-V came third with 71.02%, KVM on RHEL fourth with 68.44%, and stock Proxmox last with 45.05%. The random write test told a similar story, with Hyper-V coming in second with 73.43%, KVM on RHEL third with 70.92%, Optimized Proxmox fourth with 59.91%, and stock Proxmox coming in last with 38.79%.
The SQLite test was more interesting, with ESXi still scoring the best, stock Proxmox coming in second, and KVM on RHEL, Hyper-V, and Optimized Proxmox coming last at 49.23%, 43.06%, and 42.61%, respectively.
In the Stream test, Optimized Proxmox scored the best, with stock Proxmox second at 83.56%, KVM on RHEL third with 82.47%, ESXi fourth with 71.21%, and Hyper-V last with 63.02%.
Conclusion
Overall, in the worst-case all-resources test, Hyper-V took the win by scoring an average of 92.34%, followed by ESXi at 89.36%, Optimized Proxmox at 85.16%, KVM on RHEL at 79.55%, and finally stock Proxmox at 61.58% compared to bare metal. With a more realistic resource allocation, ESXi took the win by scoring the best in all tests except Stream, achieving an average score of 96.4%, followed by Optimized Proxmox with 81.7%, KVM on RHEL with a close 79.79%, Hyper-V trailing behind with only 63.27%, and stock Proxmox coming in last with 59.69%.
In our tests, ESXi performed the best on average. Among open-source alternatives, Optimized Proxmox demonstrated commendable performance, but the performance was less than ideal without the optimizations. KVM on RHEL lagged behind in our worst-case scenario test but was very close to Optimized Proxmox in more realistic tests. Hyper-V’s results with realistic resource allocation were surprising; a more in-depth analysis would explain why the results were as seen, but that is out of the scope of this article.
Engage with StorageReview
Newsletter | YouTube | Podcast iTunes/Spotify | Instagram | Twitter | TikTok | RSS Feed


