It’s evident that the latest Gen5 SSDs, such as the Western Digital SN861, are influencing business outcomes. If you need proof, look no further than their impact on the AI revolution.
Sponsored by Western Digital
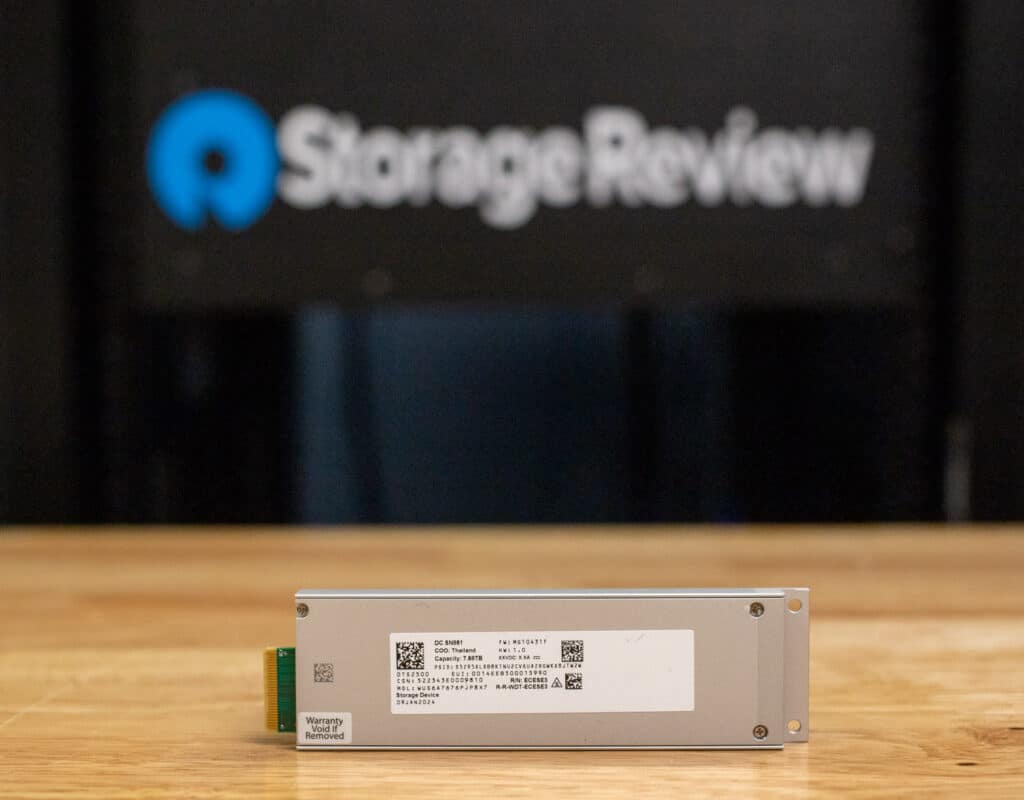
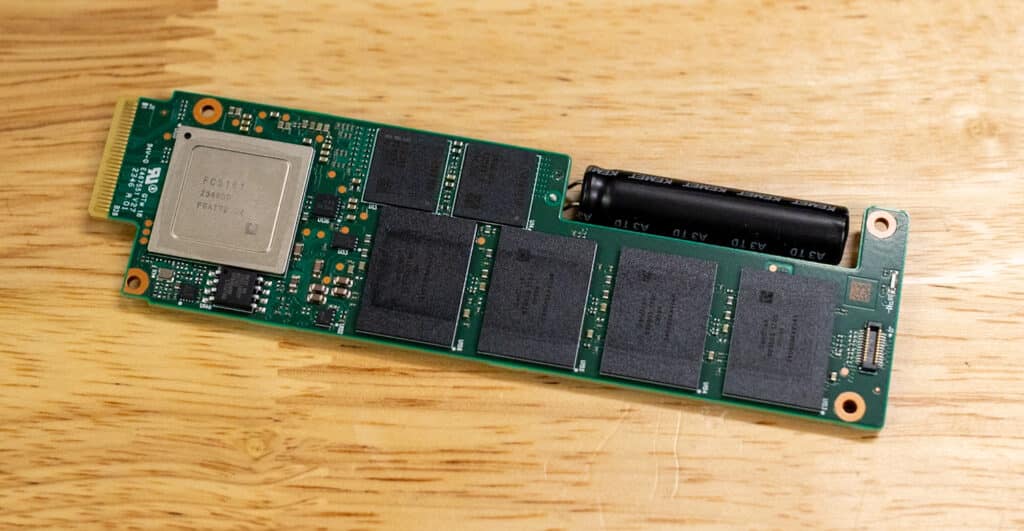
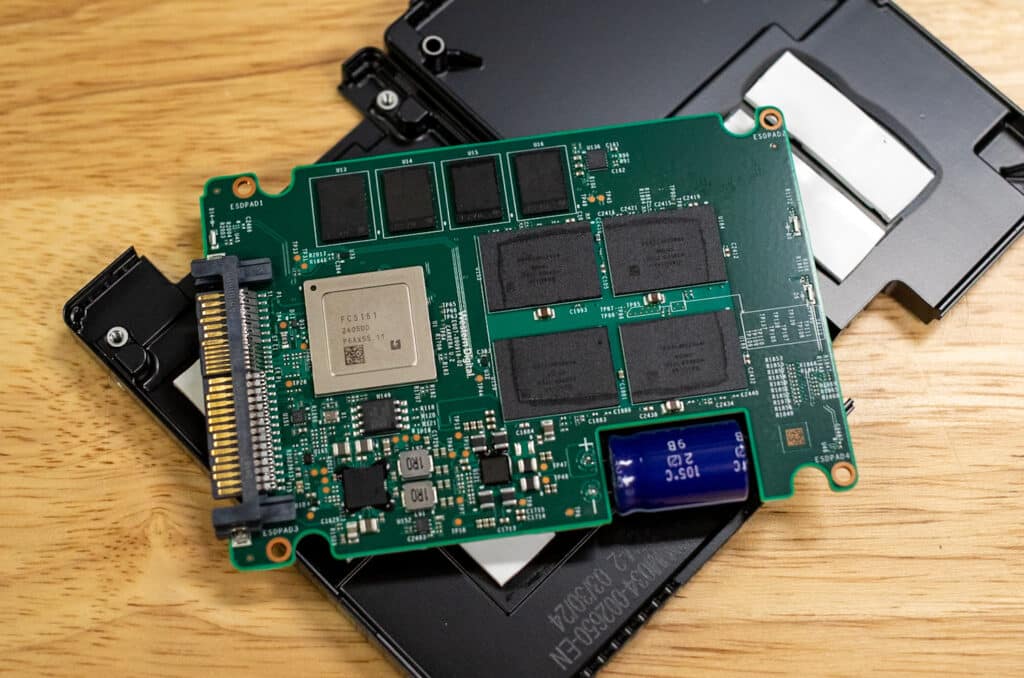
The Western Digital Ultrastar® DC SN861 SSD is designed to meet the high-performance needs of both hyperscale data centers and enterprise environments. The SN861 supports a PCIe® Gen5 interface and comes in various form factors, including U.2 and E1.S, enabling it to fit multiple deployment scenarios. It’s not as simple as making the SN861 in different form factors, though; Western Digital has wisely engineered the SN861 feature set to align with its target markets.
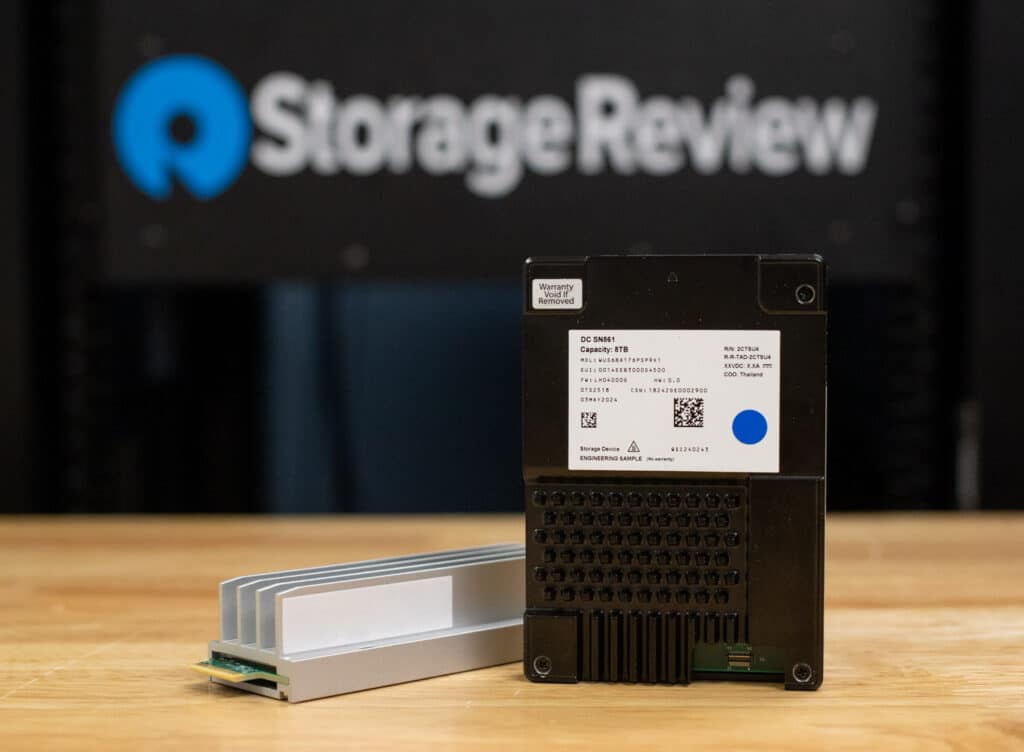
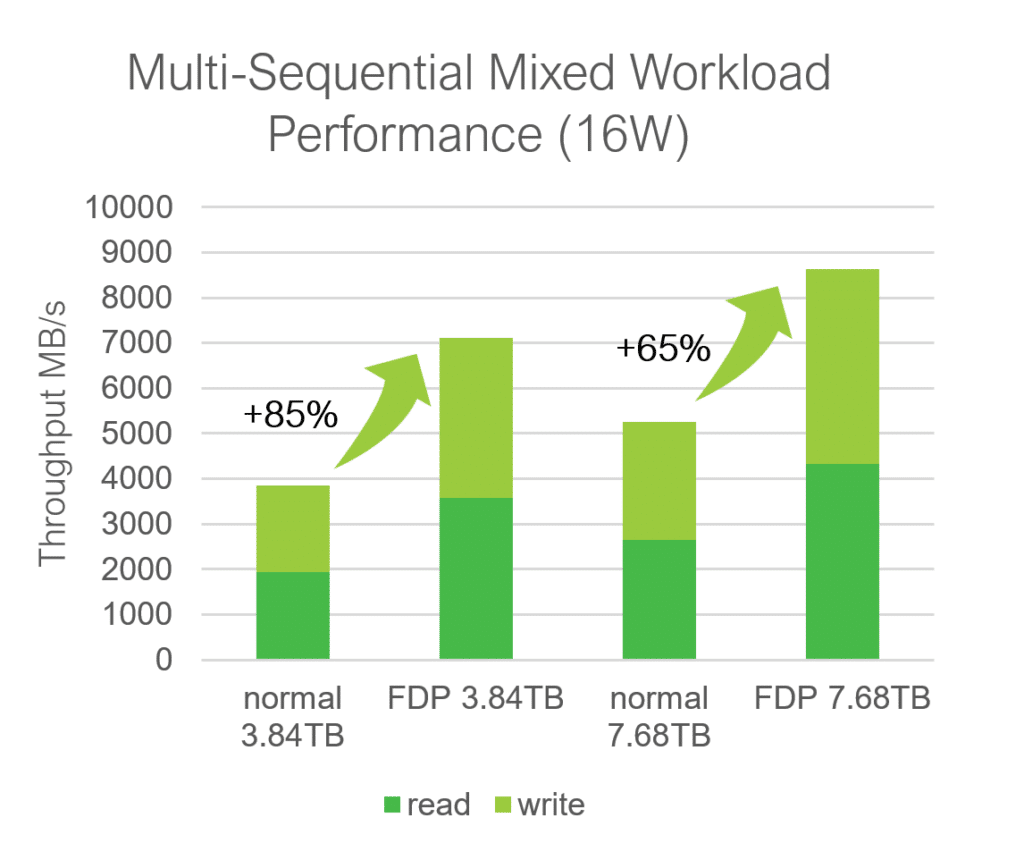
The Gen5 interface gives the SN861 an immediate performance boost over the prior-gen SN655. The benefits of the new drive run much more deeply, with capabilities like Flexible Data Placement (FDP) in the E1.S form factor. FDP reduces write amplification and optimizes data placement. The SN861 includes advanced security features such as end-to-end data protection, AES-XTS encryption, and TCG OPAL 2.01. The controller also helps reduce SSD power consumption, averaging below 5 watts at idle. Additionally, the drive supports multiple standards like NVMe® 2.0 and OCP Cloud Spec 2.0.
While the security and efficiency features are critical, every generational refresh includes a significant performance jump, and the SN861 is no different. The drive delivers sequential read speeds up to 13,700 MB/s and random read IOPS up to 3.3 million, essential for applications such as AI/ML and big data analytics. Both versions of the SN861 consume an average of 20 watts during operation and less than 5 watts at idle. Power is tunable, so adjusting the drive’s power profile to match the expected workload is easy. Hyperscalers, for instance, often run their E1.S drives at much lower power states.
Interestingly, while the two form factors of the SN861 are technically very similar in design, Western Digital has tuned each drive for specific workloads. In the E1.S version, for instance, this means features like FDP and performance-tuned for cloud workloads. The U.2 drive, on the other hand, will find its way into high-performance enterprise workloads and undoubtedly emerging workloads like AI that can benefit from the massive jump in drive performance.
EDSFF and FDP
FDP provides significant benefits for hyperscalers like Meta by optimizing the performance and reliability of their SSDs in workloads such as CacheLib. FDP reduces the Write Amplification Factor (WAF), leading to improved write speeds and extended SSD lifespan, which is crucial for handling massive data processing tasks.
The technology enhances data organization by intelligently grouping similar data, minimizing overprovisioning, and reducing the need for intensive garbage collection. FDP also supports multiple namespaces, ensuring consistent performance across different workloads. This optimization improves application performance and endurance and significantly lowers the total cost of ownership (TCO) for large-scale storage infrastructures.
Support for FDP in the E1.S version of the Ultrastar SN861 affirms that the drive is ready for hyperscalers’ needs, but FDP is just one part of the equation. The E1.S version of the drive needs to deliver on hyperscale performance requirements, specifically QoS around read performance.
U.2 For Enterprise
As exciting as the E1.S drive is for hyperscale use cases, the U.2 SN861 is the drive most enterprises will adopt. We put the drive through a series of tests to measure overall performance in our standard test suite.
Western Digital Ultrastar DC SN861 SSD Data Sheet
| 1.60TB | 1.92TB | 3.20TB | 3.84TB | 6.40TB | 7.68TB | |
|---|---|---|---|---|---|---|
| Endurance | 3 DWPD | 1 DWPD | 3 DWPD | 1 DWPD | 3 DWPD | 1 DWPD |
| Security | ||||||
| Form Factor | ||||||
| Interface | ||||||
| NVMe Specification | ||||||
| Performance (Projected) | 1.60TB | 1.92TB | 3.20TB | 3.84TB | 6.40TB | 7.68TB |
| Read Throughput (max MB/s, Seq 128KiB) | 13,700 | 13,700 | 13,700 | 13,700 | 13,700 | 13,700 |
| Write Throughput (max GB/s, Seq 256KiB) | 3,600 | 3,600 | 7,200 | 7,200 | 7,500 | 7,500 |
| Read IOPS (max, Rnd 4KiB) | 2,100K | 2,100K | 3,300K | 3,300K | 3,300K | 3,300K |
| Write IOPS (max, Rnd 4KiB) | 350K | 165K | 665K | 330K | 800K | 430K |
| Read Latency (µS) | 65 | 65 | 65 | 65 | 65 | 65 |
| Write Latency (µS) | 8 | 8 | 8 | 8 | 8 | 8 |
| Reliability | ||||||
| MTTF (hours, projected) | ||||||
| Uncorrectable Bit Error Rate (UBER) | ||||||
| Annualized Failure Rate (AFR, projected) | ||||||
| Limited Warranty (years) | ||||||
| Power Management (Projected) | ||||||
| Requirement (DC, +/- 10%) | ||||||
| Operating Modes (avg, max) | ||||||
| Idle (Average) | ||||||
| Physical Size | ||||||
| z-height (mm) | ||||||
| Dimensions (width x length, mm) | ||||||
| Environmental | ||||||
| Operating Temperature (Ambient) | ||||||
| Non-Operating Temperature | ||||||
To measure the performance of the enterprise NVMe® Gen5 SSDs used in this comparison, we leveraged a fio test suite for four corners workloads and Vdbench for mixed workloads. The fio script package we leveraged is an automated script set up to precondition and lightly test drives in a consistent manner, found here on github. We used this to perform 256K sequential read and write tests for peak bandwidth and 4K random read and write tests for peak throughput.
| Peak Throughput and Bandwidth |
Western Digital SN861 7.68TB | KIOXIA CM7-R 7.68TB | Samsung PM1743 7.68TB | Samsung PM9A3 7.68TB |
| 256K sequential read (1T/64Q) | 13,283MB/s | 12,092MB/s | 14,495MB/s | 6,751MB/s |
| 256K sequential write (1T/64Q) | 7,696MB/s | 5,796MB/s | 6,052MB/s | 4,055MB/s |
| 4K random read (8T/32Q) | 2,108,065 IOPS | 1,963,066 IOPS | 1,900,838 IOPS | 1,068,508 IOPS |
| 4K random write (8T/32Q) | 473,658 IOPS | 301,061 IOPS | 319,758 IOPS | 206,660 IOPS |
When we look at the top-line performance figures from the Western Digital SN861, it makes good use of its Gen5 interface. In sequential read, it measured 13.3GB/s, which came in second compared to the Samsung PM1743, which measured 14.5GB/s. In sequential write, the SN861 came in first, sweeping the other two comparable Gen5 models, with a speed of 7.7GB/s, with 6.1GB/s from the Samsung PM1743 as the next closest.
Random 4K read performance was notably strong, measuring 2.11M IOPS, with 1.96M IOPS from the KIOXIA CM7-R as the next closest. When we looked at random 4K write performance, the Western Digital SN861 also came in first, with a speed of 474K IOPS, with the Samsung PM1743 with 320K IOPS as the next closest model. In our four-corners workloads, the Western Digital SN861 got the top figure in three of the four tests.
To test the SN861 Gen5 SSD, we leveraged the Dell® PowerEdge® R760 in our test lab. It is a highly versatile 2U rackmount server that supports two 4th generation Intel Xeon processors and has configurations that support up to 24 NVMe drives. This server is intended for mixed workloads, databases, and VDI. It should be noted that the version of the CM7-R we’re testing in this review came from a Dell server with Dell’s firmware build. This drive may perform differently with KIOXIA’s stock firmware.
Dell PowerEdge R760 Configuration:
- Dual Intel® Xeon® Gold 6430 (32 cores/64 threads, 1.9GHz base)
- 1TB DDR5 RAM
- Ubuntu 22.04
For ultimate flexibility, we also worked with Serial Cables, who supplied us with an 8-bay PCIe Gen5 JBOF for U.2/U.3, M.2, and EDSFF SSD testing. This allows us to test all current and emerging drive types on the same test hardware. VDbench was also leveraged to compare scaled performance across our SSD selection in different workload types. Our testing process for these benchmarks fills the entire drive surface with data and then partitions a drive section equal to 25% of the drive capacity to simulate how the drive might respond to application workloads. This differs from full entropy tests, which use 100 percent of the drive and take them into a steady state. As a result, these figures will reflect higher-sustained write speeds.
Profiles:
- 16K Sequential Read: 100% Read, 32 threads, 0-120% iorate
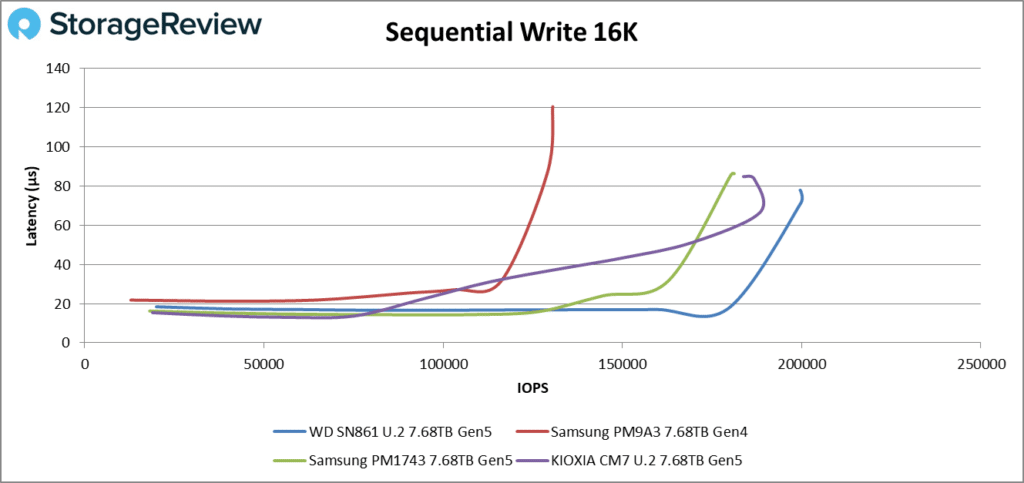
- 16K Sequential Write: 100% Write, 16 threads, 0-120% iorate
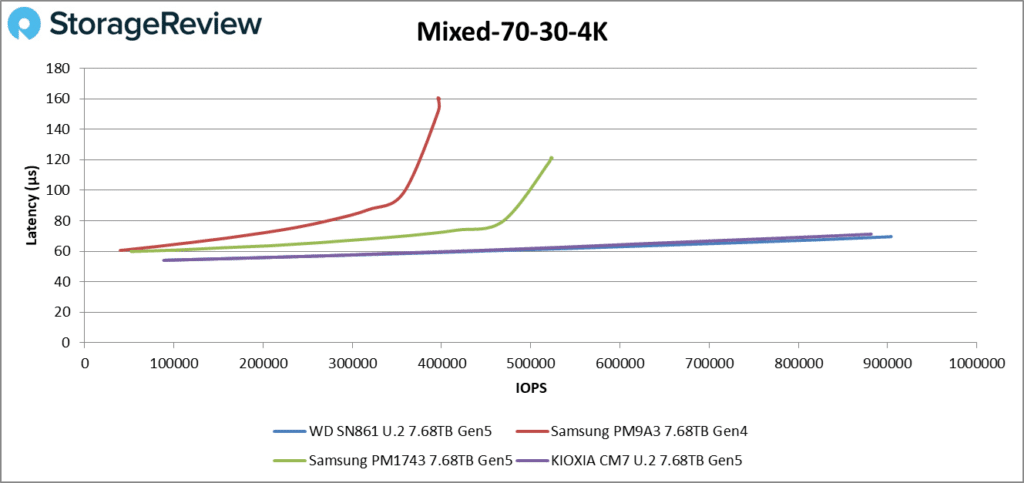
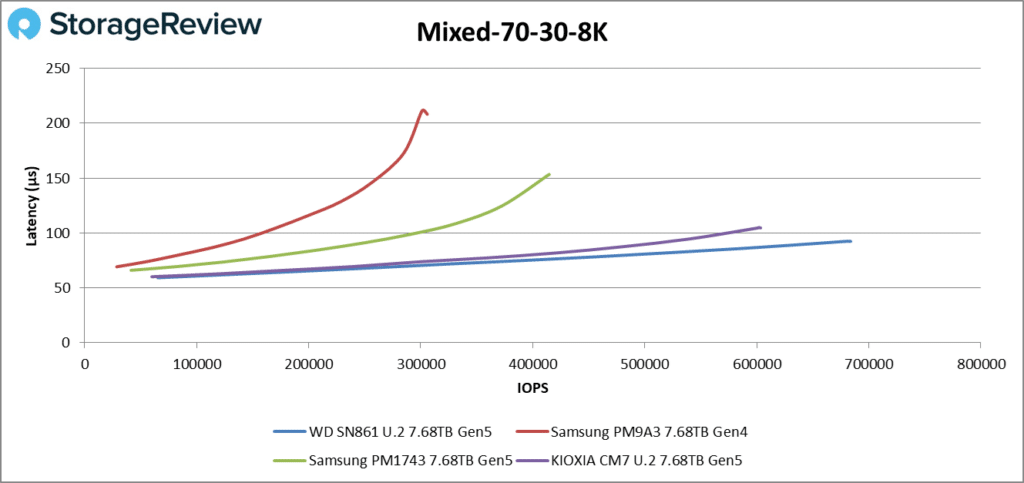
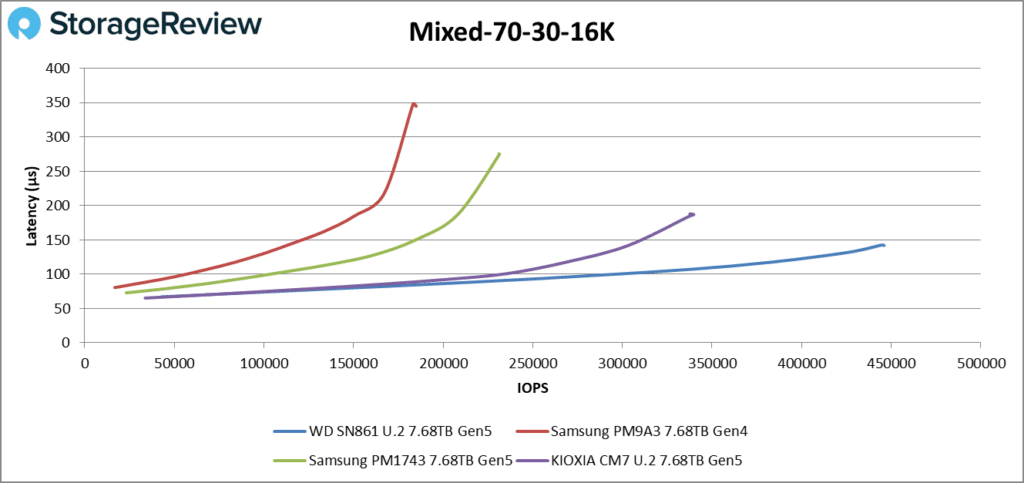
- 4K, 8K, and 16K 70R/30W Random Mix, 64 threads, 0-120% iorate
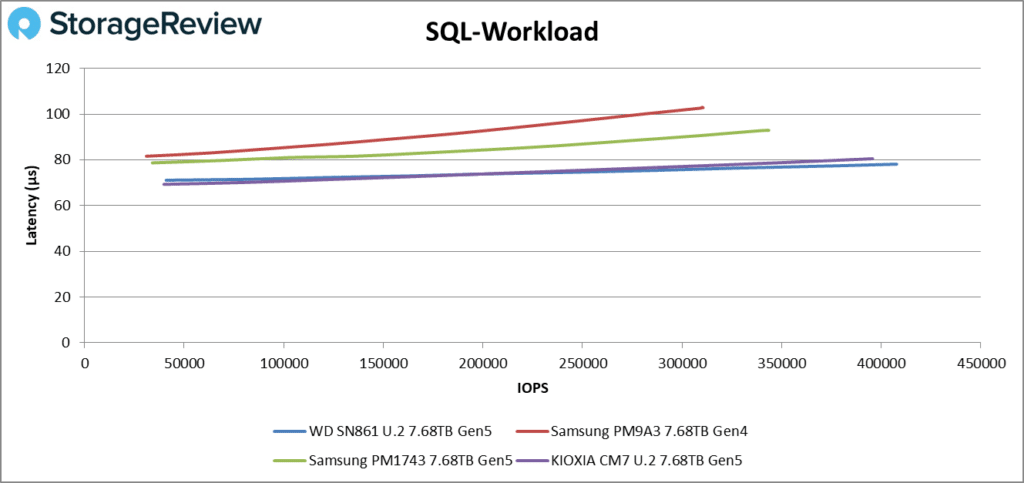
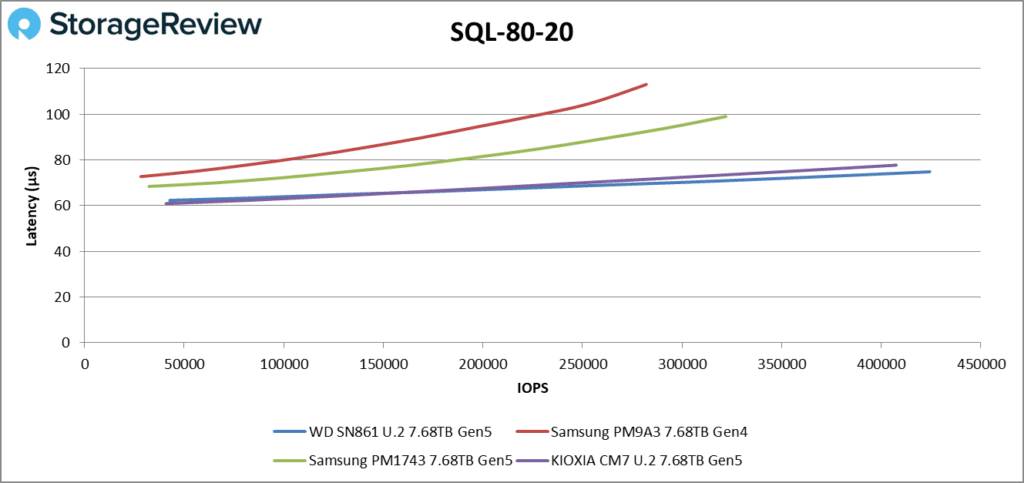
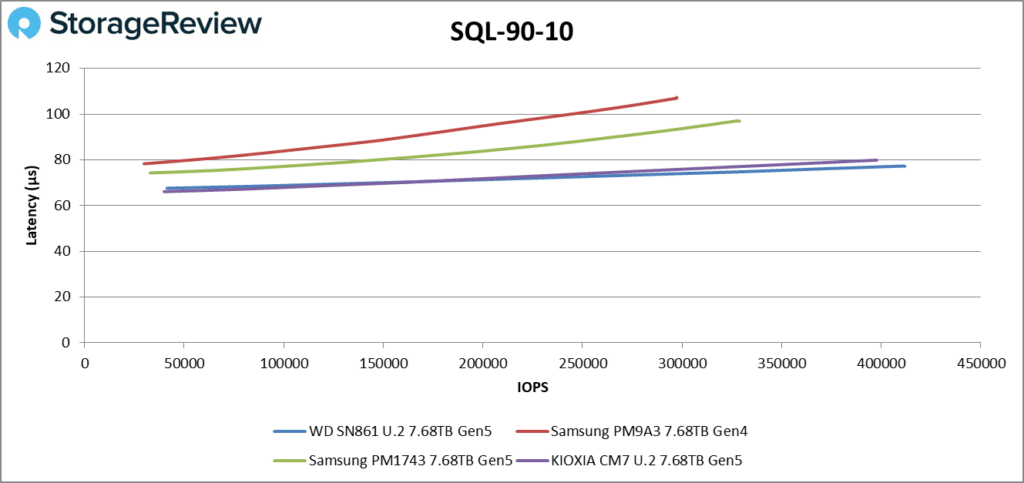
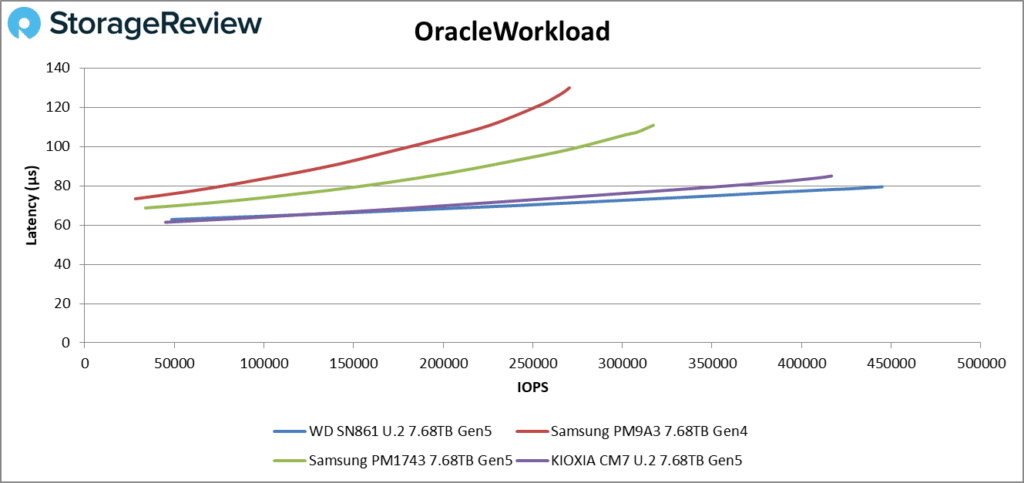
- Synthetic Database: SQL and Oracle
- VDI Full Clone and Linked Clone Traces
Our first Vdbench test measured sequential 16K read performance with a 32-thread load. Here, we measured a peak throughput of 325K IOPS and 5.1GB/s at 98 μs from the Western Digital SN861, which was neck and neck with the KIOXIA CM7-R, measuring 329K IOPS. The PCIe Gen5 Samsung PM1743 measured 289K IOPS, and the Samsung PM9A3 we brought as a reference Gen4 SSD measured 227K IOPS.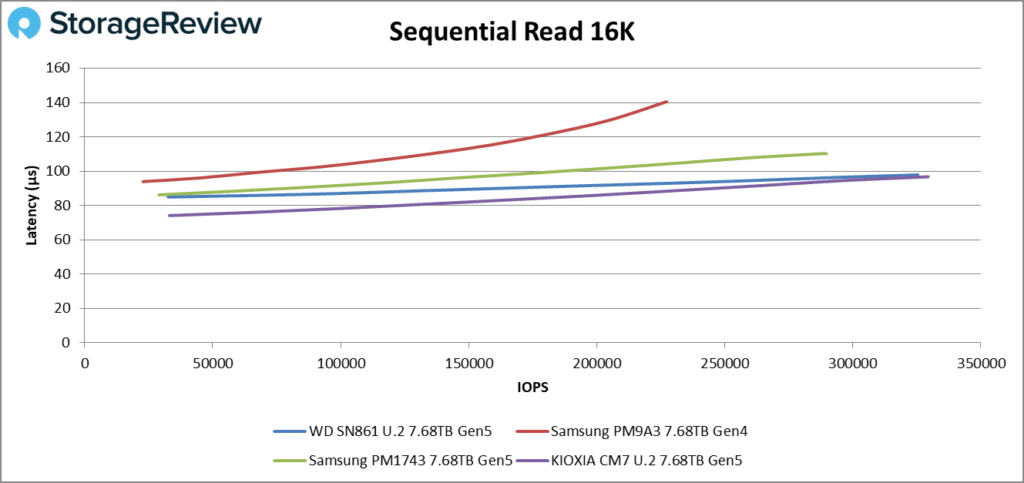
Western Digital SN861 and AI
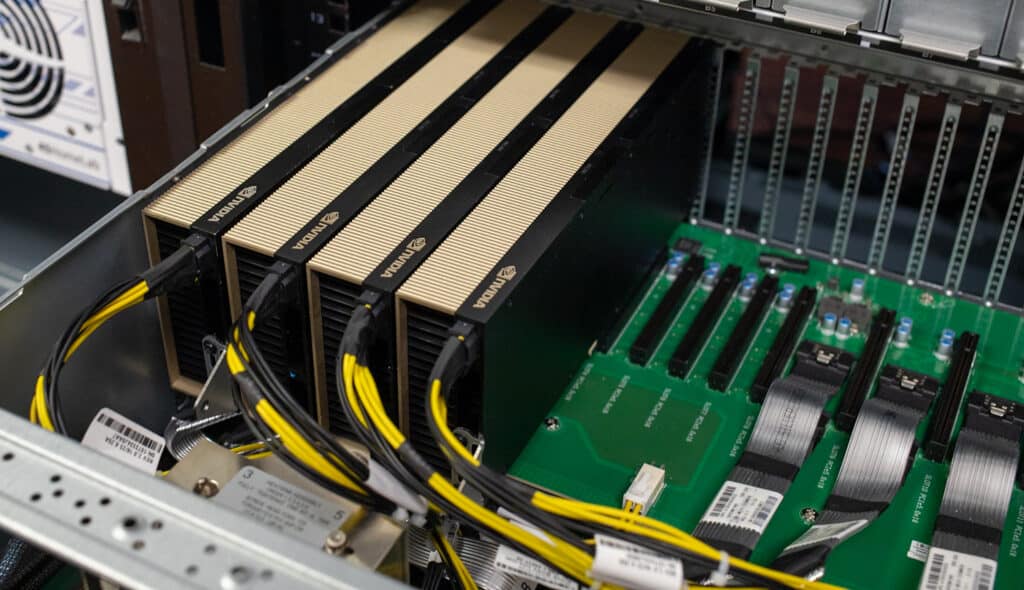
In a somewhat related path to the work with the SN861 in this report, we’ve also been working with the prior-generation Western Digital Ultrastar DC SN655 within the OpenFlex™ Data24 platform the Western Digital systems group provides. In a demo for FMS ’24, we showed off an AI demo with a GPU server, the Data24 NVMe-oF™ platform, and Gen4 SN655 SSDs.
Our tests with NVIDIA® IndeX® focused on leveraging its advanced volumetric visualization capabilities to handle massive datasets with high fidelity. IndeX utilizes GPU acceleration to provide real-time interactive visualization of 3D volumetric data, which is critical for industries like oil and gas exploration, medical imaging, and scientific research.
To achieve optimal performance, especially in GPU-intensive environments, it is necessary to ensure high-speed data exchange between GPUs and storage. For instance, to thoroughly saturate the bandwidth of an NVIDIA H100 GPU, we needed to achieve approximately 64GB/s of throughput, which involves using high-performance NVMe storage solutions and technologies like NVIDIA GPUDirect™. This integration reduces latency and maximizes data throughput, ensuring efficient GPU utilization for faster and more effective processing of large-scale datasets.
When we look at the bandwidth differences in what the Gen4 SN655 can do at 6.8GB/s peak versus 13.7GB/s from the SN861, it’s obvious to see the advantages of moving to a Gen5 SSD. To hit 64GB/s with the previous generation model, you need ten SSDs, while the SN861 could hit that target with just five. This difference could allow you to increase the drive count for additional bandwidth or capacity.
Performance and capacity will be critical for storage to scale with the needs of AI and other advanced applications. The Gen5 interface and overall performance boost the SN861 offers over Gen4 drives are very compelling in this regard, meaning these drives can support more GPUs within a single storage system and ensure those GPUs are being fed at a rate fast enough to ensure full utilization.
Conclusion
The SN861 marks a substantial leap forward for Western Digital. The drive comes in form factors to support hyperscale and enterprise customers alike, with drive features like FDP in the E1.S drive tuned for their prospective use cases. The Gen5 interface is the most apparent benefit for the drives though, delivering an impressive all-around performance profile.
The Western Digital SN861 offered strong performance out of the gate, taking three top spots in our initial four-corner workloads measuring peak sequential bandwidth and random throughput. Highlights include a random 4K read performance of 2.11M IOPS and random 4K write performance measuring 474K IOPS. Sequential read performance was strong, coming in second compared to the Samsung PM1743 with 13.3GB/s, although it was able to take over the lead in sequential write bandwidth measuring 7.7GB/s.
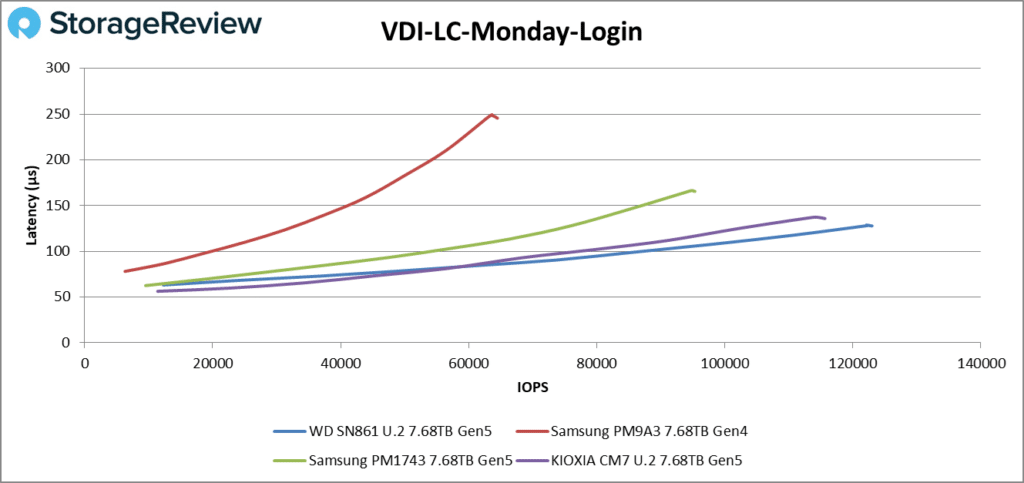
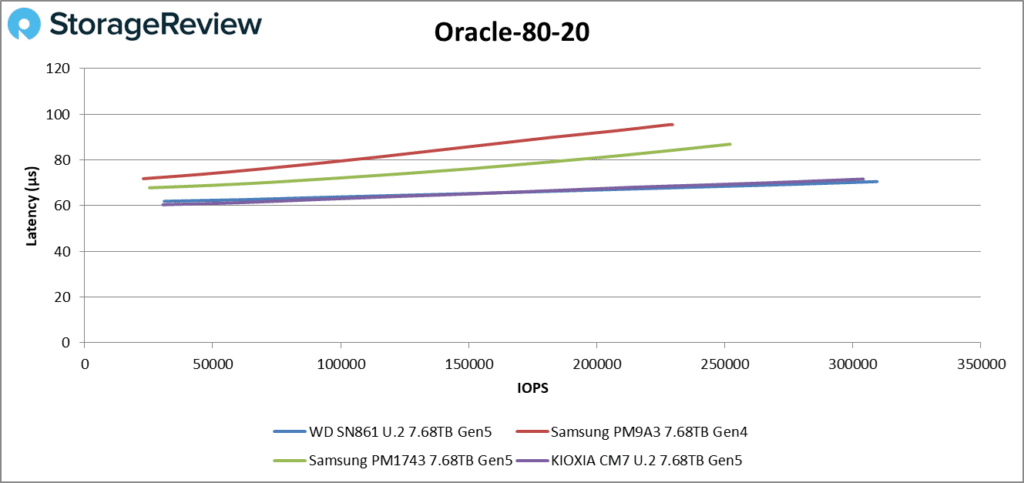
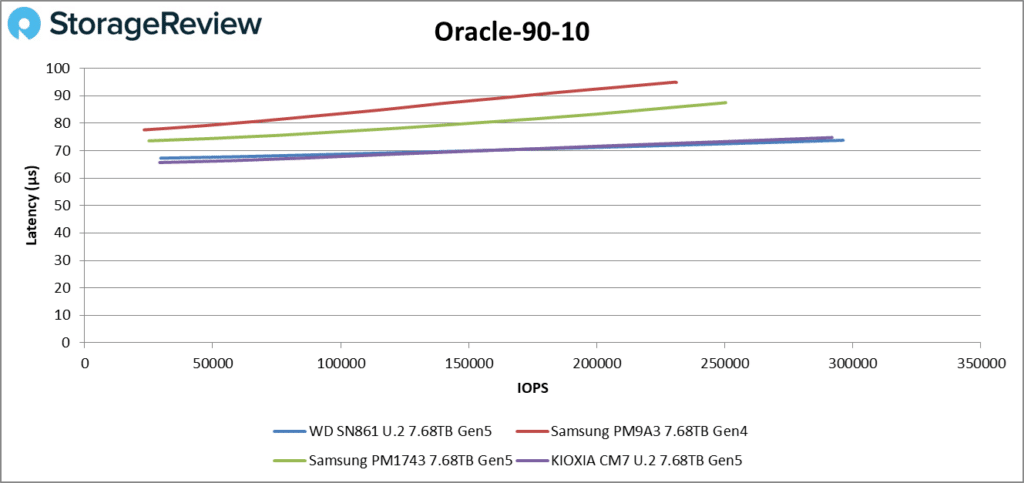
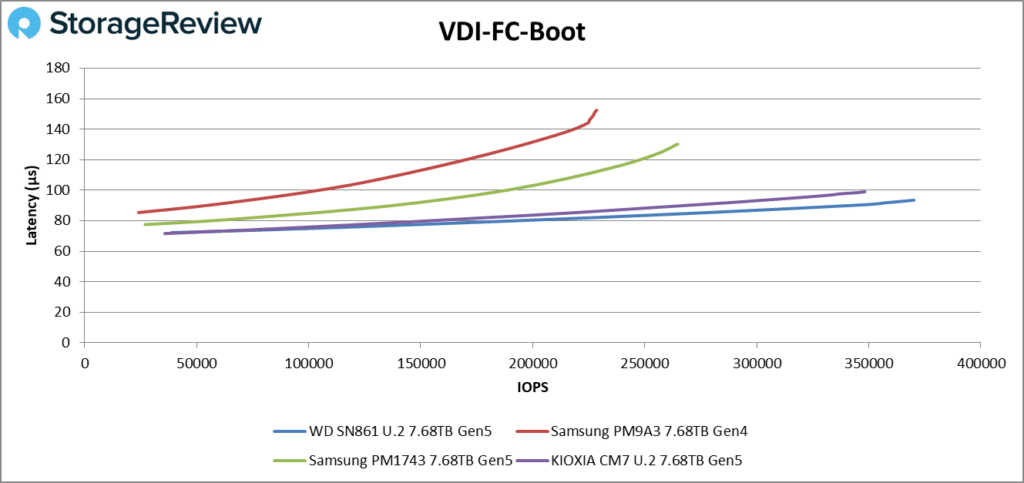
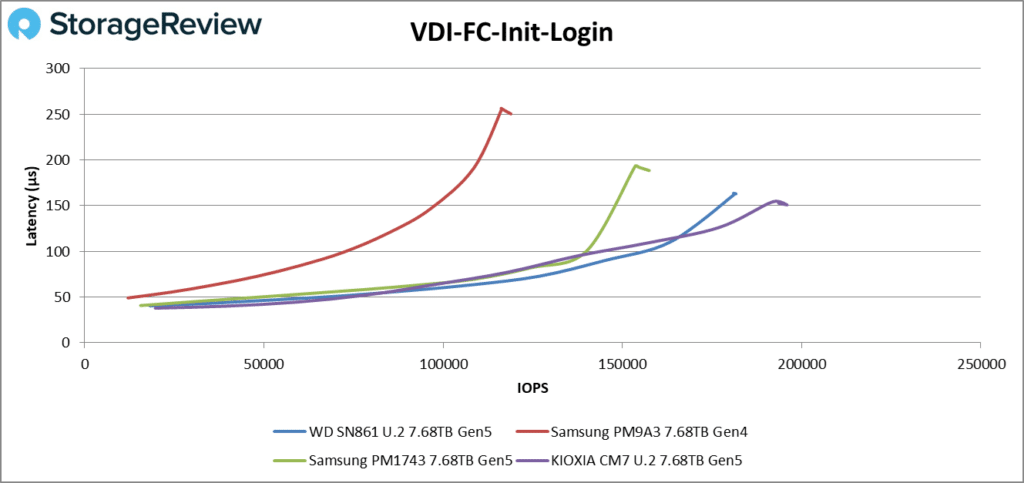
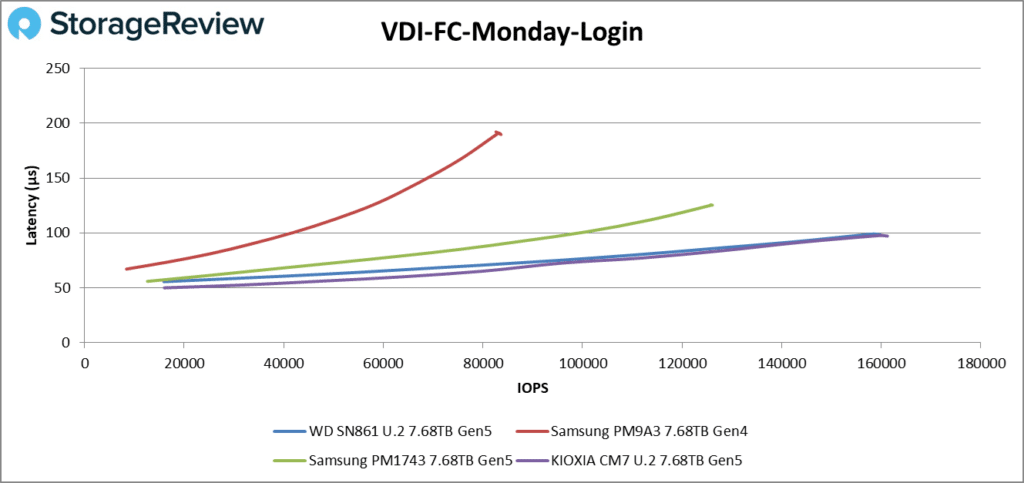
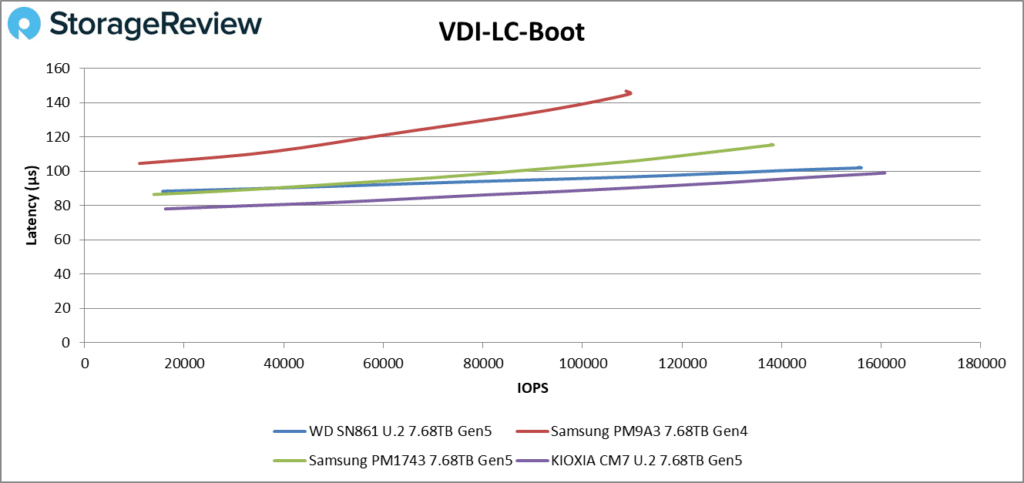
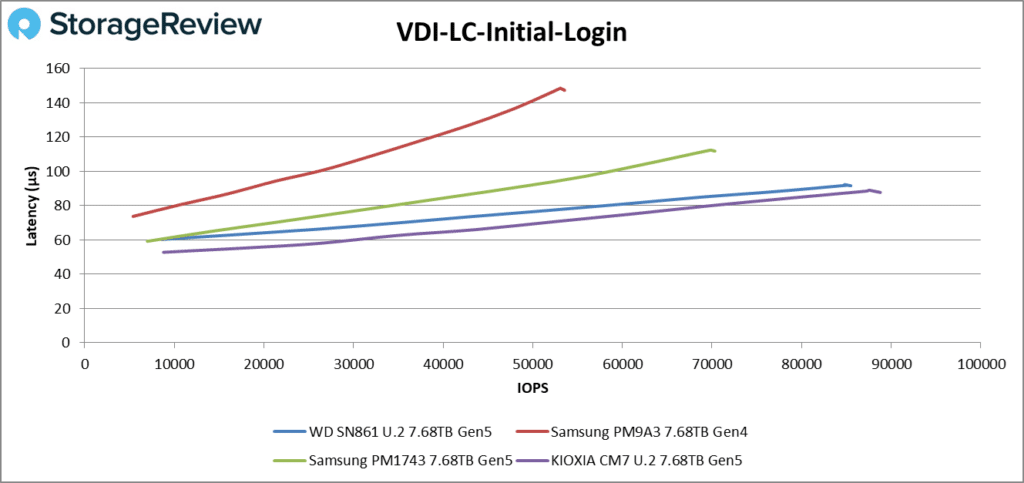
In our VDbench workloads, which primarily focused on mixed workloads or smaller block-size transfers, the SN861 continued to perform exceptionally well. We measured a strong 16K sequential write speed of 200K IOPS and strong leads in the 70/30 R/W mix tests covering 4K, 8K, and 16K transfer sizes. In our VDI workloads, the SN861 traded the top spot with the KIOXIA CM7-R, which were neck and neck in some areas. Overall, the Western Digital SN861 had a strong showing across our testing lineup.
It’s evident that the latest Gen5 SSDs, such as the Western Digital SN861, are influencing business outcomes. If you need proof, look no further than their impact on the AI revolution. We’ve seen it in our testing; AI systems need fast storage to keep GPUs working, whether in a cache like the NVIDIA IndeX example above or within shared storage arrays or GPU servers. Western Digital has done very well in positioning the SN861 for these advanced workloads while also offering FDP-enabled SKUs for hyperscalers.
Western Digital Data Center Storage
Engage with StorageReview
Newsletter | YouTube | Podcast iTunes/Spotify | Instagram | Twitter | TikTok | RSS Feed

