To explore how different desktop architectures handle AI workloads, we approached Dell with a straightforward request: provide us with the most powerful systems in their gaming and workstation families. The goal? To determine how a top-tier gaming desktop optimized for consumer performance compares against a high-end workstation designed for professional-grade tasks when running AI workloads – each with the best NVIDIA GPU in the class.
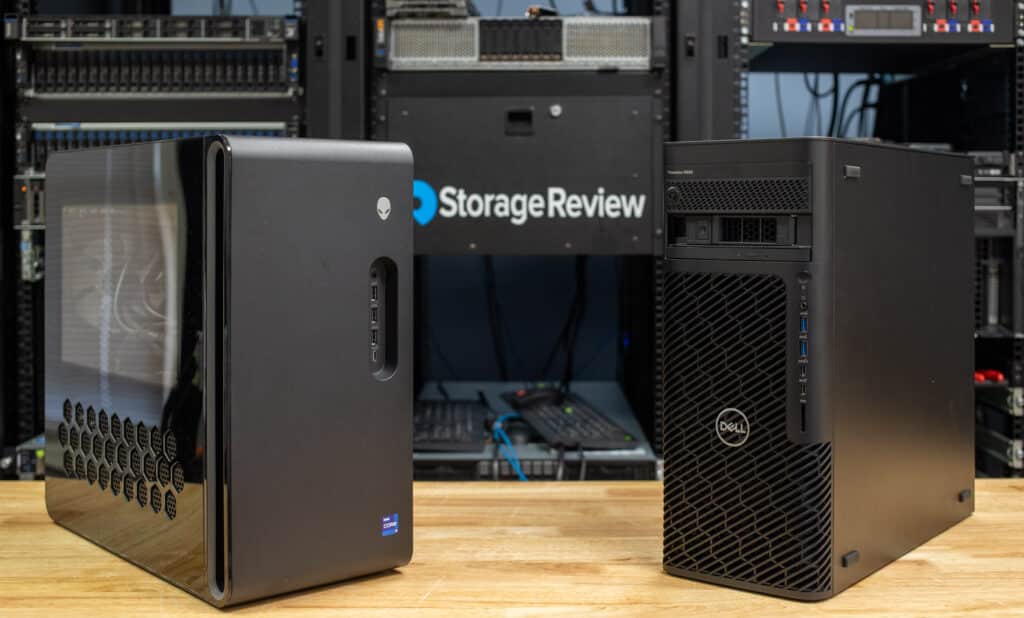
Dell delivered the Alienware Aurora R16, representing their pinnacle of PC gaming. This system is a powerhouse for gaming and high-performance consumer applications, featuring the NVIDIA RTX 4090 GPU with 24GB of GDDR6X memory, an Intel Core i9-14900KF processor, and a compact design. With its relatively affordable build price, the Aurora R16 raises the question: can a system built for gaming also tackle AI?
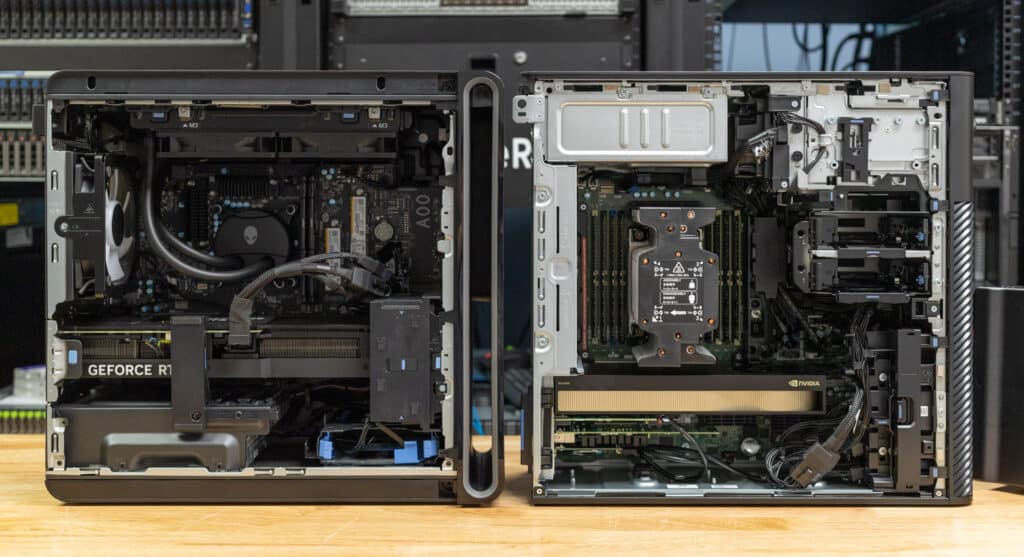
Dell sent the Precision 5860 to represent the workstation family, a system purpose-built for heavy-duty professional use, including our intended AI use case. Equipped with the NVIDIA RTX 6000 Ada GPU featuring 48GB of GDDR6 memory, an Intel Xeon W7-2595X processor, and 128GB of ECC DDR5 memory, this workstation is engineered to handle complex, compute-intensive tasks. However, with a price tag about 4X higher than the Aurora R16, we had to ask: does its specialized hardware justify the cost for AI workloads?
This article compares these two systems to uncover how much the workstation’s extra GPU memory, ECC RAM, and CPU performance impact AI tasks and whether a gaming desktop can provide a viable alternative for budget-conscious AI enthusiasts.
Dell Precision 5860 & Alienware Aurora R16 Specs
We’re not so delusional in this task to recognize that the Precision 5860 has a massive performance advantage, with double the GDDR memory, more DRAM slots, a much more powerful CPU…the list goes on. Our configuration carried a price at the time of testing of about $12K vs. the $3K Alienware configuration. As we explore the systems, keep that in mind and remember the goal in this piece is to see if and where the Alienware and the RTX 4090 within can keep up with the much beefier RTX 6000 Ada.
Dell Precision 5860 Specifications
| Processor Options | Intel Xeon “Sapphire Rapids” w3 through w7, up to 26 cores |
| Operating System |
|
| Memory Options | Up to 2TB DDR5-4800 ECC (8 DIMM slots) |
| Storage Options |
|
| Graphics |
|
| Ports | Front:
Rear:
|
| Optical Drive | Optional slim DVD burner |
| Slots |
|
| Dimensions | U.S.:
|
| Power Options |
|
| Warranty |
|
Dell Alienware Aurora R16 Specifications
| Component | |
|---|---|
| Processor | Intel® Core™ i7-i9 14700-14900KF, 20-24 cores, 5.4 up to 6.0 GHz P-Core Thermal Velocity) |
| Operating System | Windows 11 Home or Pro, English |
| Graphics | NVIDIA® GeForce RTX™ 4060-4090, 8-24 GB GDDR6X |
| Memory | 16 – 64 GB DDR5, 5200 – 5600 MT/s (2 DIMM slots) |
| Storage | 1-4 TB PCIe Gen 4 NVMe SSD |
| Power Supply | 500W or 1000W Platinum Rated PSU Options |
| Cooling | 240mm Liquid-Cooled CPU |
| Ports (Front) |
|
| Ports (Rear) |
|
| Audio | Realtek high-performance Audio chip (ALC1220) |
| Dimensions |
|
| Wi-Fi | Intel® Killer™ Wi-Fi 6E AX1675, 2×2, 802.11ax, MU-MIMO, Bluetooth® wireless card |
| Warranty | 1Y Basic On-site Service after remote diagnosis with Hardware-Only Support |
Dell Precision 5860 & Dell Alienware Aurora R16 Build and Design
Dell Precision 5860 workstation
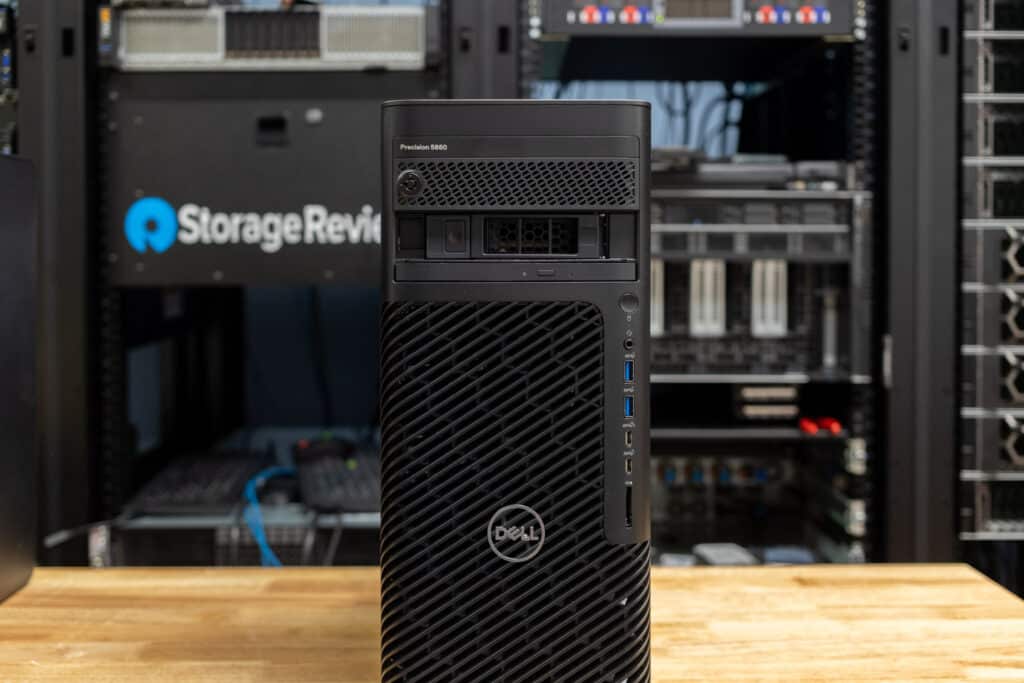
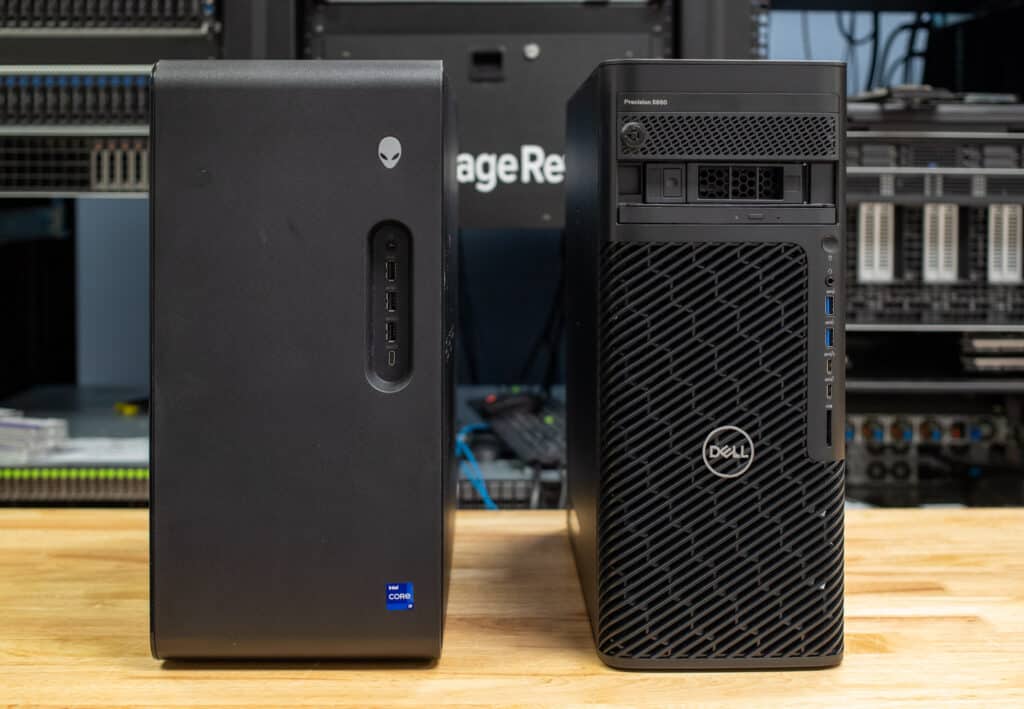
Getting started with build and design, we revisited the Dell Precision 5860, a previously reviewed workstation. The front panel, crafted from a sustainable mix of recycled plastics and steel, maintains the unit’s sleek and consistent aesthetic while offering various connectivity options. Below are the connectivity options you will find on the front:
- There are two USB-A (5Gbps) and two USB-C (10Gbps) ports, including one with PowerShare for charging devices while powered off.
- Full-size SD card reader and universal audio jack.
- Optional features like a slim optical drive and lockable flex bays for hot-swappable NVMe or SATA drives add to its professional-grade versatility.
- Power button
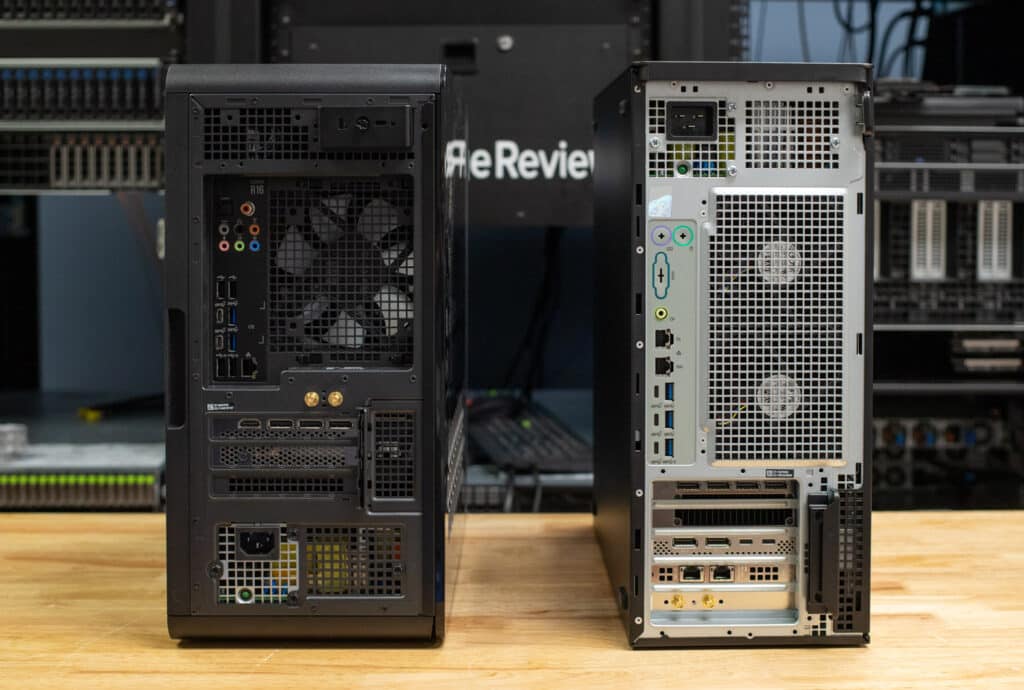
Now, on to the rear of the unit. Efficient cooling and power are essential for a system of this caliber. The rear panel features expansive airflow grates and offers power supply options of 750W or 1,350W, ensuring reliable support for high-performance components. On the rear, you’ll find connectivity options:
- 1GbE and 10GbE Ethernet.
- Three USB-A (5Gbps) and three USB-C (10Gbps) ports.
- Audio line-out, with the option for additional ports via PCIe expansion.
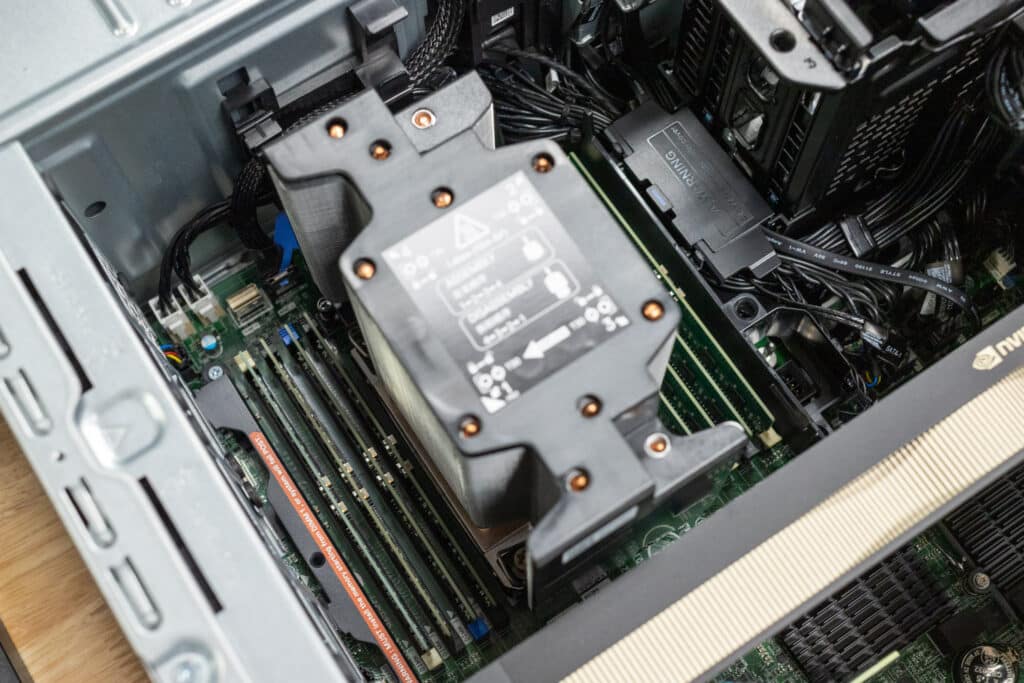
On the inside of the unit, you will find the Precision 5860 offers excellent serviceability and customization options, such as:
-
- One Gen5 PCIe x16 slot, supporting up to dual NVIDIA RTX 6000 Ada GPUs.
- Full-height Gen4 PCIe x16 slot.
- (2) Full-height Gen4 PCIe x8 slot open-ended.
- Full-height Gen4 PCIe x8 slot (x4 electrical) open-ended.
- (2) M.2 2230/2280 PCIe NVMe Gen4 SSD slots.
- (2) SATA slots for 2.5/3.5-inch HDD/SSD.
- The FCLGA4677 Socket is cooled by an advanced tower heatsink with 11 heat pipes, ensuring thermal efficiency during sustained workloads.
- 8 DDR5 ram slots with RDIMM and ECC support.
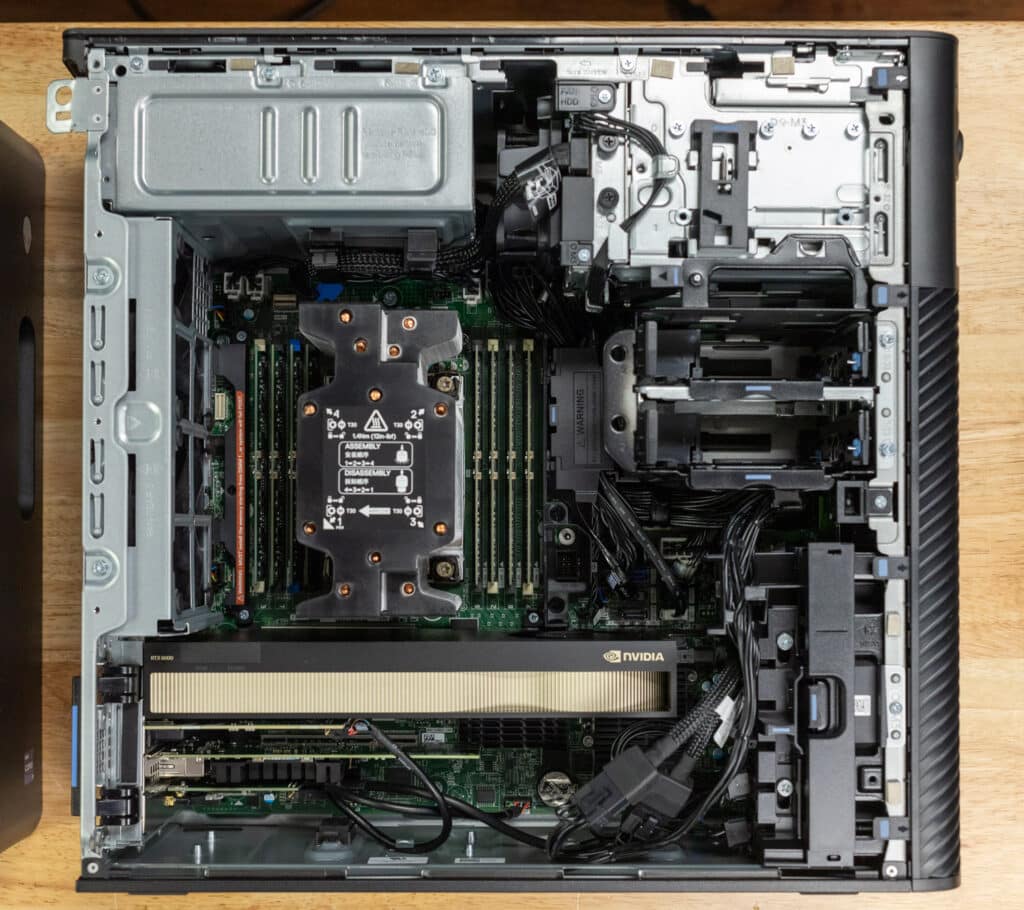
The Precision 5860 combines enterprise-grade components with exceptional scalability, featuring 8 RAM slots and multiple storage options, including 3.5-inch and 2.5-inch HDDs, SSDs, and NVMe drives. It also supports multiple GPUs, including dual NVIDIA RTX 6000 Ada GPUs, making it highly adaptable for demanding workloads. While the system’s PSU and motherboard are non-upgradable, its robust connectivity, advanced cooling, and support for ECC memory ensure it remains a reliable, long-term solution for users requiring top-tier performance and flexibility in enterprise environments.
Dell Alienware Aurora R16
Now, on to the second unit new to us at Storagereview, the Dell Alienware R16. Physically, the R16 maintains a refined design that, while not as bold as the typical Alienware look, still preserves that iconic aesthetic. It features a clear plexiglass side panel for visibility of the internal components and ventilation for the lower half of the GPU. The chassis measurements are:
- Height: 16.46 inches (418.00 mm)
- Width: 7.75 inches (197.00 mm)
- Depth: 18.05 inches (458.40 mm)
- Weight: 33.89 lbs (15.37 kg)
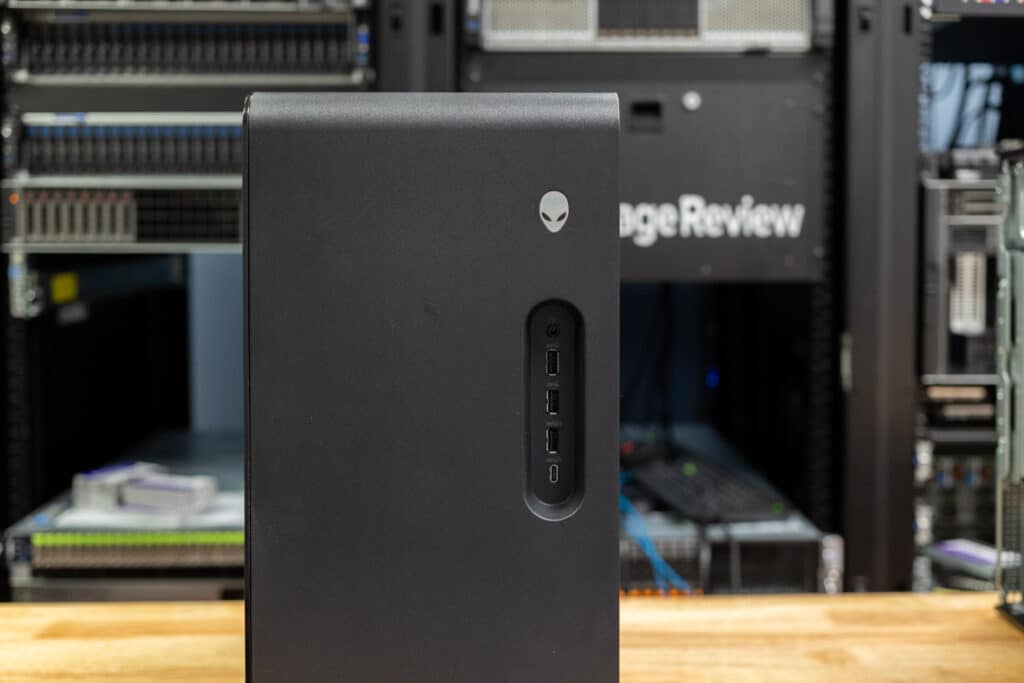
Shifting focus to the front panel of the R16, it offers a solid selection of connectivity ports, including:
- Power button (Alien head)
- A Global headset port for audio.
- Two USB 3.2 Gen 1 (5Gbps) ports for peripherals.
- A USB 3.2 Gen 1 (5Gbps) PowerShare port that allows charging while powered off.
- A USB 3.2 Gen 2 Type-C (10Gbps) PowerShare port for fast data transfer and charging.
Its sleek aesthetic is further enhanced with RGB lighting zones illuminating the rear fan, side of the case, and the Alienware logo, adding a personal touch to the system. These lighting effects are easily customizable and managed through the Alienware Command Center, allowing users to personalize the lighting to match their style or enhance their gaming setup.
The side panel, made of clear plexiglass, showcases the system’s internals, including:
- A 240mm, all-in-one liquid cooling system ensures efficient heat management for the Intel processor.
- RGB lighting zones on the rear fan, side panel, and Alienware logo.
The rear panel of the R16 features an array of ports, ensuring versatility for gaming and high-performance workflows:
- Audio Ports: One rear L/R surround, one optical S/PDIF, one side L/R surround, one audio Input/Microphone, one line-out, one coaxial S/PDIF, one Center/Subwoofer LFE, and one line-in.
- USB Ports: One USB 3.2 Gen 2 Type-C® (10Gbps), one USB 3.2 Gen 2×2 Type-C (20Gbps), two USB 2.0 Type-A with Smart Power Technology, two USB 2.0 Type-A, and two USB 3.2 Gen 1 Type-A (5Gbps).
- Networking: One RJ45 Ethernet port (1GbE) and a dual Self-Complementary Antenna (SCA) port for enhanced Wi-Fi.
- Security: Slots for Kensington security cable and Padlock.
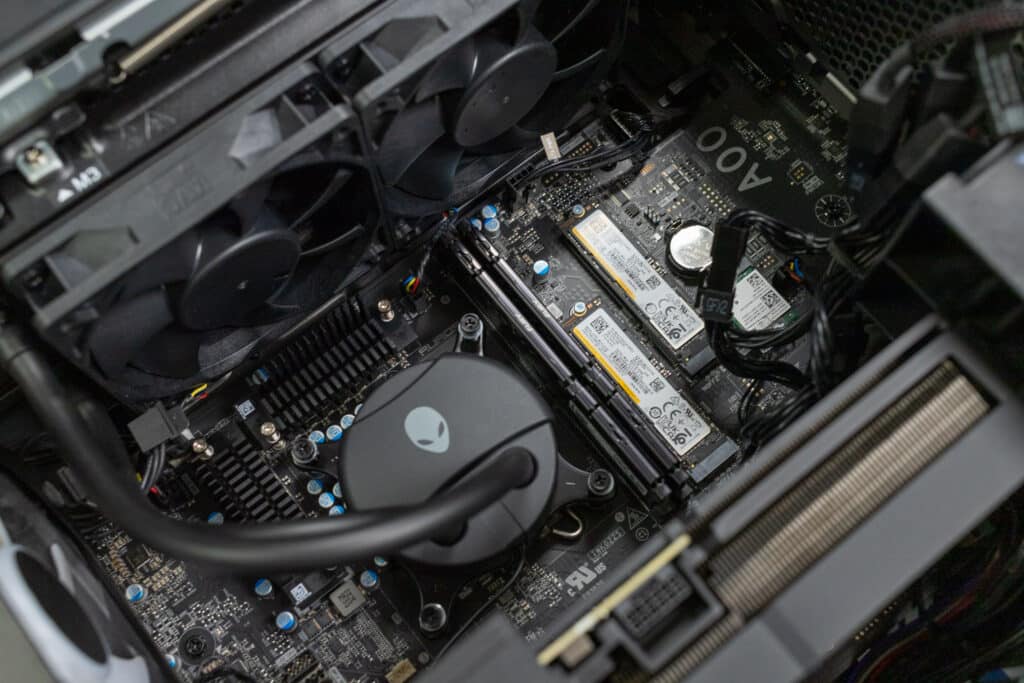
Internally, the R16 offers configurations with:
- Intel Core i7-14700F to Intel Core i9-14900KF processors, offering up to 20-24 cores and 68MB cache.
- NVIDIA GeForce RTX 4060 to RTX 4090 graphics cards, with up to 8-24GB of GDDR6X memory, ensuring top-tier graphical performance for demanding games and applications.
- A 1-4 TB PCIe NVMe SSD for lightning-fast storage and minimal load times.
- A 500-1000W Platinum-rated power supply that, like the motherboard, is non-upgradable, making it a fixed component within the system.
- An all-in-one 240mm liquid cooling system to ensure optimal thermal management during intense sessions.
- Two DDR5 RAM slots, with a minimum configuration of 16GB and an upgradeable capacity of up to 64GB at 5200-5600 MHz.
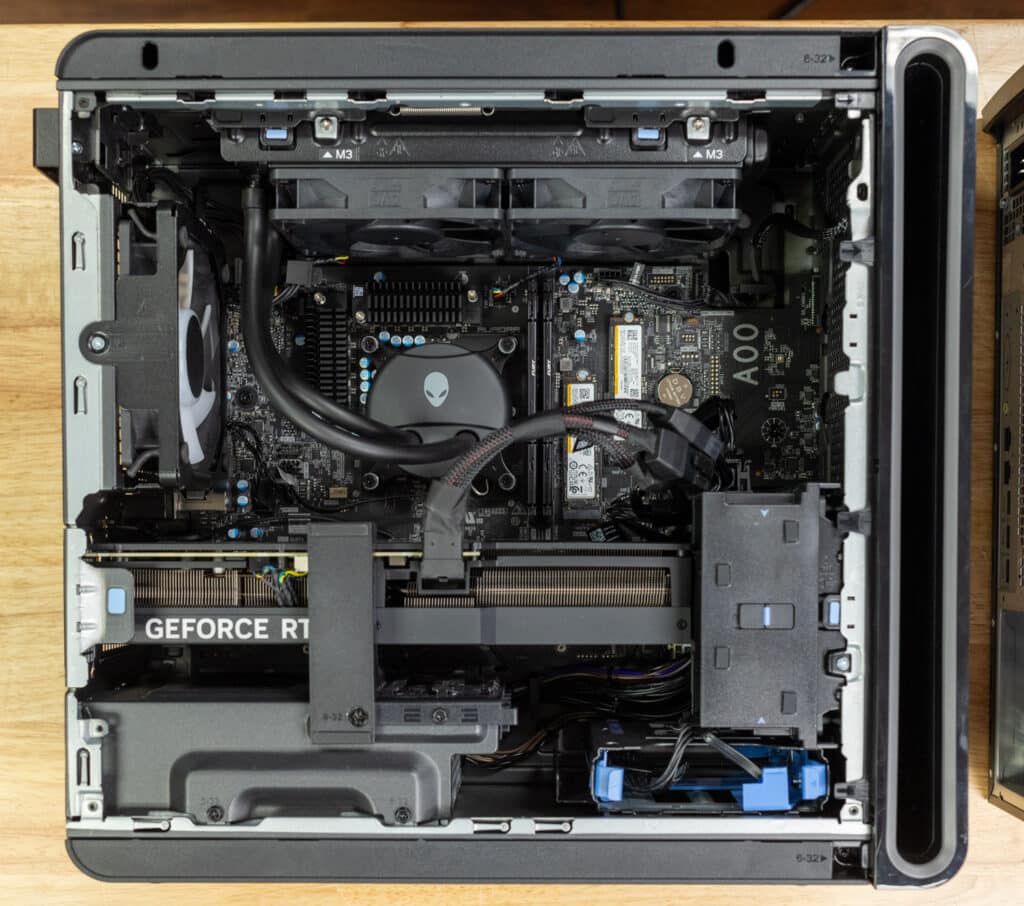
The R16 combines high-end components and customizable performance, making it suitable for home gaming and high-level creative work. While the system’s PSU, motherboard, and RAM are non-upgradable, with a maximum of 64GB supported across its two RAM slots, its performance capabilities make it an ideal choice for users looking for a long-term, high-performance solution.
Dell Precision 5860 Tower & Dell Alienware Aurora R16 Benchmarks
Before we take a look at the benchmarks, here are the configurations of each unit we tested.
| Specification | Dell Precision 5860 Tower | Dell Alienware Aurora R16 |
|---|---|---|
| CPU | Intel Xeon w7-2595X (26 core 52 Thread) | Intel i9-14900KF (8P + 16E Cores 32 Threads) |
| CPU Clock Speed | 2.8 GHz (Base) 4.8 GHz (Turbo) | 2.8 GHz (Base) 4.8 GHz (Turbo) |
| CPU TDP | 250W (Min) 300W (Max) | 125W (Min) 253W (Max) |
| RAM | 128GB DDR5 (8x 16gb DDR5 Sk Hynix) | 32GB DDR5 (2x 16gb DDR5 Kingston Fury Beast) |
| RAM Clock Speed | 5600 MHz | 5600 MHz |
| GPU | NVIDIA RTX 6000 ADA | NVIDIA RTX 4090 |
| GPU Memory Size | 48 GB GDDR6 | 24 GB GDDR6X |
| GPU Memory Bandwidth | 960.0 GB/s | 1.01 TB/s |
| GPU Base Clock | 915 MHz | 2235 MHz |
| GPU Boost Clock | 2505 MHz | 2520 MHz |
| GPU TDP | 300 W | 450 W |
| Suggested PSU | 700 W | 850 W |
| GPU Memory Clock | 2500 MHz (20 Gbps effective) | 1313 MHz (21 Gbps effective) |
| GPU Slot Width | Dual-slot | Triple-slot |
| GPU Length | 267 mm (10.5 inches) | 304 mm (12 inches) |
| GPU Width | 112 mm (4.4 inches) | 137 mm (5.4 inches) |
| Motherboard Chipset | W790 | Z690 |
| Operating System | Microsoft Windows 11 Pro | Microsoft Windows 11 Home |
| Storage | 2x SAMSUNG PM9A1 1TB M.2 SSDs in RAID0 | 3x SAMSUNG PM9F1 1TB M.2 SSDs (two are RAID0) |
Blender OptiX 4.0 / 4.1
Blender is an open-source 3D modeling application. This benchmark was run using the Blender Benchmark utility. The score is samples per minute, with higher being better.
Looking at the data, Dell Precision excels in CPU performance. It consistently outpaced Dell Alienware across tasks like rendering the Monster and Junkshop scenes, making it better suited for complex CPU-intensive workflows. Alienware takes a slight lead regarding GPU performance, delivering faster render times in all GPU-focused tasks, such as the Classroom and Junkshop scenes. Both systems handle GPU tasks efficiently, but Alienware edges ahead for users prioritizing GPU rendering speed.
| Blender 4.2.0 | Dell Precision 5860 Tower (Intel Xeon w7-2595X, 128GB, NVIDIA RTX 6000 Ada) | Dell Alienware Aurora R16 (Intel i9-14900KF, 32GB, NVIDIA GeForce RTX 4090) |
|---|---|---|
| CPU | ||
| Monster | 270.71 | 211.69 |
| Junkshop | 178.14 | 143.21 |
| Classroom | 130.32 | N/A |
| GPU | ||
| Monster | 5528.98 | 5593.47 |
| Junkshop | 2576.73 | 2709.25 |
| Classroom | 2661.92 | 2766.24 |
Geekbench 6
Geekbench 6 is a cross-platform benchmark that measures overall system performance. The Geekbench Browser allows you to compare any system to it.
In the Geekbench 6 benchmark, Dell Alienware dominates in single-core CPU performance, scoring 3,061 compared to the Dell Precision’s 2,112, making it better for tasks that rely on speed in individual processes. The Alienware also holds a noticeable edge in multi-core performance, with a score of 19,969 versus the Precision’s 15,738, excelling in tasks requiring multiple threads like rendering or simulations. For GPU performance, the Alienware leads again with a score of 324,190 compared to the Precision’s 272,472, making it better suited for demanding graphics tasks. While the Precision still performs well, the Alienware’s overall power and speed make it the better choice for users needing fast, high-performance computing for various workloads.
| Geekbench 6 (Higher is better) |
Dell Precision 5860 Tower (Intel Xeon w7-2595X, 128GB, NVIDIA RTX 6000 ADA) | Dell Alienware Aurora R16 (Intel i9-14900KF, 32GB, NVIDIA GeForce RTX 4090) |
|---|---|---|
| CPU Single-Core | 2112 | 3061 |
| CPU Multi-Core | 15,738 | 19,969 |
| GPU | 272,472 | 324,190 |
Cinebench R23
The Cinebench R23 benchmark tool evaluates a system’s CPU performance by rendering a complex 3D scene using the Cinema 4D engine. It measures single-core and multi-core performance, providing a comprehensive view of the CPU’s capabilities in handling 3D rendering tasks.
The Cinebench R23 results show Dell Precision performing significantly faster in multi-core workloads than Dell Alienware, making it far more capable of handling tasks that leverage multiple CPU cores. However, the Alienware demonstrates a clear advantage in single-core performance, executing tasks reliant on individual core speed much faster than the Precision. The gap in multi-core scaling further highlights Precision’s dominance in parallel processing efficiency, while Alienware prioritizes raw single-threaded speed.
| Cinebench R23 (Higher is better) | Dell Precision 5860 Tower (Intel Xeon w7-2595X, 128GB, NVIDIA RTX 6000 ADA) | Dell Alienware Aurora R16 (Intel i9-14900KF, 32GB, NVIDIA GeForce RTX 4090) |
|---|---|---|
| CPU Multi-Core | 41,255 pts | 32,256 pts |
| CPU Single-Core | 1,375 pts | 2,247 pts |
| MP Ratio | 30.00 x | 14.35 x |
Cinebench 2024
Cinebench 2024 extends R23’s benchmark capabilities by adding GPU performance evaluation. It continues to test CPU performance but also includes tests that measure the GPU’s ability to handle rendering tasks.
In the Cinebench 2024 results, the Dell Precision outpaces the Dell Alienware in multi-core CPU performance, showcasing robust capabilities in workloads that utilize all available cores. However, the Alienware delivers faster single-core performance, making it noticeably quicker for tasks reliant on single-threaded processing. Regarding GPU performance, Alienware edges ahead, completing rendering tasks slightly faster than Precision. The multi-core ratio further emphasizes the Precision’s efficiency in scaling across cores, while the Alienware focuses more on delivering higher single-core speeds and GPU rendering power.
| Cinebench R24 (Higher is better) | Dell Precision 5860 Tower (Intel Xeon w7-2595X, 128GB, NVIDIA RTX 6000 ADA) | Dell Alienware Aurora R16 (Intel i9-14900KF, 32GB, NVIDIA GeForce RTX 4090) |
|---|---|---|
| CPU Multi Core | 2,184 pts | 1,922 pts |
| CPU Single Core | 82 pts | 132 pts |
| GPU | 30,626 pts | 33,149 pts |
| MP Ratio | 26.72 x | 14.51 x |
y-cruncher
y-cruncher is a popular benchmarking and stress-testing application that launched in 2009. This test is multi-threaded and scalable, computing Pi and other constants up to the trillions of digits. Faster is better in this test.
The Dell Precision 5860 Tower outperforms the Dell Alienware Aurora R16 in the y-cruncher benchmark due to its superior hardware designed for professional, compute-intensive tasks. The key differences are:
- Processor Architecture: The Precision features an Intel Xeon w7-2595X, a workstation-grade CPU without P-cores and E-cores, focusing on consistent, high-performance multi-threading for computational tasks. In contrast, Alienware’s Intel i9-14900KF uses a hybrid architecture with P-cores for performance and E-cores for efficiency, which may not scale as well in highly parallel workloads like y-cruncher.
- Core Count and RAM: The Precision’s Xeon processor has more cores (26) and threads (52), making it better equipped for handling large-scale computations across multiple threads. Additionally, with its 8 DIMM slots, the Precision has 128GB of RAM, significantly more than Alienware’s 32GB, which is crucial for managing large data sets in benchmarks like y-cruncher.
Overall, the Precision’s combination of a workstation-grade CPU with more cores and higher RAM capacity enables it to handle the multi-threaded demands of y-cruncher more efficiently, leading to consistently faster performance across all tests.
| y-cruncher (0.8.5.9) (lower is better) | Dell Precision 5860 Tower (Intel Xeon w7-2595X, 128GB, NVIDIA RTX 6000 ADA) | Dell Alienware Aurora R16 (Intel i9-14900KF, 32GB, NVIDIA GeForce RTX 4090) |
|---|---|---|
| 1 Billion | 12.463 seconds | 20.470 seconds |
| 2.5 Billion | 38.014 seconds | 58.020 seconds |
| 5 Billion | 84.884 seconds | 131.515 seconds |
| 10 Billion | 189.168 seconds | N/A |
| 25 Billion | 566.895 seconds | N/A |
Blackmagic Disk Speed Test
The Blackmagic Disk Speed Test evaluates storage performance by measuring read and write speeds, offering insights into a system’s ability to handle data-intensive tasks like video editing and large file transfers.
The Dell Precision 5860 Tower, equipped with NVME PM9F1 Samsung 10, reached 4943.5 MB/s for write speeds and 4903.2 MB/s for read speeds in the Blackmagic Disk Speed Test. This indicates a well-rounded and efficient disk performance, excelling in both write-heavy and read-heavy tasks.
On the other hand, the Dell Alienware Aurora R16 with the NVMe PM9A1 Samsung SSD achieved 3812.5 MB/s for writing and 4839.8 MB/s for reading. While it lagged in write performance, it still delivered solid read speeds comparable to the Precision 5860 Tower.
Overall, the Precision 5860 Tower offers better write speeds, making it ideal for tasks that require fast data writing. The Alienware Aurora R16, though slightly weaker in write performance, still holds its ground with strong read speeds. Both systems perform well, but the Precision 5860 is more versatile for mixed workloads requiring high-speed write operations.
Blackmagic RAW Speed Test
The Blackmagic RAW Speed Test is a performance benchmarking tool designed to measure a system’s capabilities in handling video playback and editing using the Blackmagic RAW codec. It evaluates how well a system can decode and play back high-resolution video files, providing frame rates for both CPU- and GPU-based processing.
In the Blackmagic raw speed test, the Dell Precision 5860 Tower outperforms the Alienware Aurora R16 in CPU and CUDA tests. The Precision 5860 achieves 146 FPS on the 8K CPU test and 199 FPS on the 8K CUDA test, while the Alienware Aurora scores 108 FPS on the 8K CPU and 143 FPS on the 8K CUDA. The Precision 5860 Tower delivers faster raw performance, especially in GPU-accelerated tasks.
7-Zip
The 7-Zip Compression Benchmark evaluates CPU performance during compression and decompression tasks, measuring ratings in GIPS (Giga Instructions Per Second) and CPU usage. Higher GIPS and efficient CPU usage indicate superior performance.
Compression Performance
- The Dell Precision 5860 Tower achieves significantly higher performance, with a total compression rating of 195.277 GIPS, utilizing 4448% CPU and maintaining a 4.374 GIPS per usage ratio.
- The Dell Alienware Aurora R16 delivers a compression rating of 133.024 GIPS, using 1198% CPU and 11.129 GIPS per usage ratio. While its per-usage ratio is higher, its overall throughput lags behind Precision’s.
Decompression Performance
- The Dell Precision 5860 Tower excels in decompression, achieving a total rating of 234.059 GIPS with 5029% CPU usage and a 4.655 GIPS per usage ratio.
- Though strong, the Dell Alienware Aurora R16 falls short with a decompression rating of 193.905 GIPS, using 3050% CPU and a 6.359 GIPS per usage ratio.
Overall Results
- The Dell Precision 5860 Tower outshines the Alienware with a benchmark rating of 214.316 GIPS and 4739% total CPU usage, highlighting its dominance in compression and decompression tasks.
- The Dell Alienware Aurora R16 achieves a respectable total rating of 163.464 GIPS with 2124% total CPU usage, but it cannot match the Precision’s higher efficiency and throughput.
| 7-Zip Compression | Dell Precision 5860 Tower (Intel Xeon w7-2595X, 128GB, NVIDIA RTX 6000 ADA) | Dell Alienware Aurora R16 (Intel i9-14900KF, 32GB, NVIDIA GeForce RTX 4090) |
|---|---|---|
| Compressing | ||
| Current CPU Usage | 4452% | 1147% |
| Current Rating/Usage | 4.386 GIPS | 11.519 GIPS |
| Current Rating | 195.277 GIPS | 132.11 GIPS |
| Resulting CPU Usage | 4448% | 1198% |
| Resulting Rating/Usage | 4.374 GIPS | 11.129 GIPS |
| Resulting Rating | 194.573 GIPS | 133.024 GIPS |
| Decompressing | ||
| Current CPU Usage | 4946% | 3079% |
| Current Rating/Usage | 4.658 GIPS | 6.153 GIPS |
| Current Rating | 230.385 GIPS | 189.482 GIPS |
| Resulting CPU Usage | 5029% | 3050% |
| Resulting Rating/Usage | 4.655 GIPS | 6.359 GIPS |
| Resulting Rating | 234.059 GIPS | 193.905 GIPS |
| Total Rating | ||
| Total CPU Usage | 4739% | 2124% |
| Total Rating/Usage | 4.514 GIPS | 8.744 GIPS |
| Total Rating | 214.316 GIPS | 163.464 GIPS |
OctaneBench
Next, we look at OctaneBench, a benchmarking utility for OctaneRender, another 3D renderer with RTX support similar to V-Ray.
In the OctaneBench results, the Dell Alienware outperforms the Dell Precision in most tests, with higher scores across various rendering tasks. For instance, Alienware scores 172.21 in interior path tracing, while Precision scores 153.13. Alienware also leads in other categories like direct lighting and info channels, showing its stronger overall GPU performance. While Precision holds its own in some areas, such as ATV path tracing, Alienware consistently leads, making it the faster choice for rendering tasks that rely on GPU power.
| OctaneBench (Score, higher is better) | Dell Precision 5860 Tower (Intel Xeon w7-2595X, 128GB, NVIDIA RTX 6000 ADA) | Dell Alienware Aurora R16 (Intel i9-14900KF, 32GB, NVIDIA GeForce RTX 4090) |
|---|---|---|
| Interior | 44.33 | 46.55 |
| Direct lighting | 123.05 | 135.00 |
| Path tracing | 153.13 | 172.21 |
| Idea | 26.24 | 27.57 |
| Direct lighting | 97.72 | 106.92 |
| Path tracing | 118.20 | 130.70 |
| ATV | 66.03 | 70.77 |
| Direct lighting | 124.53 | 143.15 |
| Path tracing | 157.93 | 182.26 |
| Box | 36.17 | 38.29 |
| Direct lighting | 117.88 | 129.86 |
| Path tracing | 130.71 | 145.51 |
SPECviewperf 2020
Our next test is SPECviewperf 2020, the worldwide standard for measuring graphics performance of professional applications under the OpenGL and Direct X application programming interfaces. The viewsets (or benchmarks) represent graphics content and behavior from actual applications without having to install the applications themselves. The newest version of this benchmark went through significant updates late last year, including new viewsets taken from traces of the latest versions of 3ds Max, Catia, Maya, and Solidworks applications. In addition, they added support within all viewsets for both 2K and 4K resolution displays.
In the SPECviewperf2020 Viewsets benchmark, the Dell Alienware generally performs better than the Dell Precision across most test categories, indicating superior capabilities in handling complex 3D rendering tasks. For example, in Maya-06, the Alienware scores 576.9 compared to the Precision’s 486.41, showing its better performance in graphics-intensive applications. However, Precision outperforms Alienware in areas like 3dsmax-07 and Creo-03, indicating its strengths in specific 3D modeling software. The Alienware provides a more consistent performance advantage across various rendering tasks.
| SPECviewperf 2020 Viewsets (Higher is better) | Dell Precision 5860 Tower (Intel Xeon w7-2595X, 128GB, NVIDIA RTX 6000 ADA) | Dell Alienware Aurora R16 (Intel i9-14900KF, 32GB, NVIDIA GeForce RTX 4090) |
|---|---|---|
| 3dsmax-07 | 213.87 | 225.11 |
| Catia-06 | 116.78 | 94.32 |
| Creo-03 | 149.36 | 143.75 |
| Energy-03 | 83.84 | 66.18 |
| Maya-06 | 486.41 | 576.9 |
| Medical-03 | 127.86 | 37.6 |
| Snx-04 | 898.04 | 46.47 |
| Solidworks-05 | 291.59 | 263.42 |
SPECworkstation 3
SPECworkstation3 specializes in benchmarks designed to test all key aspects of workstation performance. It uses over 30 workloads to test CPU, graphics, I/O, and memory bandwidth. The workloads fall into broader categories such as Media and Entertainment, Financial Services, Product Development, Energy, Life Sciences, and General Operations. We will list each broad-category result instead of the individual workloads. The results are an average of all the individual workloads in each category.
The Dell Precision outperforms the Dell Alienware in several categories, particularly in Life Sciences, where it scores 8.38 compared to the Alienware’s 5.18. The Precision also leads in Media and Entertainment, Product Development, and Financial Services. However, the Alienware does pull ahead in GPU Compute with a score of 11.24, slightly surpassing the Precision’s 10.51. The Precision excels in more diverse workloads, while the Alienware shines in GPU-focused tasks.
| SPECworkstation 3 (Higher is better) | Dell Precision 5860 Tower (Intel Xeon w7-2595X, 128GB, NVIDIA RTX 6000 ADA) | Dell Alienware Aurora R16 (Intel i9-14900KF, 32GB, NVIDIA GeForce RTX 4090) |
|---|---|---|
| Media and Entertainment | 6.2 | 5.87 |
| Product Development | 6.18 | 5.42 |
| Life Sciences | 8.38 | 5.18 |
| Financial Services | 7.63 | 6.51 |
| Energy | N/A | 6.51 |
| General Operations | 3.01 | 3.2 |
| GPU Compute | 10.51 | 11.24 |
Luxmark
Another 3D benchmark we use is LuxMark, an OpenCL GPU benchmarking utility.
Hallbench: A test to evaluate the GPU’s ability to handle complex 3D scenes and dynamic lighting.
Food: A more complex test that handles detailed 3D objects and textures using heavy lighting and shadows.
In the LuxMark benchmark, the Dell Alienware outperforms the Dell Precision in both test categories. For Hallbench, the Alienware scores 38,998, surpassing the Precision’s 31,654. The same trend continues with the Food test, where the Alienware scores 16,825, while the Precision scores 14,487. Overall, the Alienware shows stronger GPU performance, particularly in rendering tasks.
| LuxMark (Higher is better) | Dell Precision 5860 Tower (Intel Xeon w7-2595X, 128GB, NVIDIA RTX 6000 ADA) | Dell Alienware Aurora R16 (Intel i9-14900KF, 32GB, NVIDIA GeForce RTX 4090) |
|---|---|---|
| Hallbench | 31,654 | 38,998 |
| Food | 14,487 | 16,825 |
UL Procyon AI Inference
UL Procyon AI Inference is designed to gauge a workstation’s performance in professional applications. It should be noted that this test does not take advantage of multiple CPU capabilities. Specifically, this tool benchmarks the workstation’s ability to handle AI-driven tasks and workflows, providing a detailed assessment of its efficiency and speed in processing complex AI algorithms and applications.
In the UL Procyon Average Inference Times benchmark, the Dell Alienware Aurora R16 consistently outperforms the Dell Precision 5860 Tower across various machine learning models. When using TensorRT, Alienware excels with the fastest inference times in models like MobileNet V3 (0.45ms) and ResNet 50 (1.02ms). The Precision 5860 results are slower, especially with models like Real-ESRGAN, where Alienware finishes significantly faster. Overall, Alienware offers superior performance in AI and deep learning tasks, particularly in GPU-accelerated inference.
| UL Procyon Average Inference Times (ms, lower is better) | MobileNet V3 | ResNet 50 | Inception V4 | DeepLab V3 | YOLO V3 | Real-ESRGAN | Overall Score |
|---|---|---|---|---|---|---|---|
| Dell Precision 5860 Tower (Windows ML – Intel) | 1.28 | 7.36 | 22.51 | 28.18 | 37.77 | 1,699.41 | 185 |
| Dell Precision 5860 Tower (Windows ML – Nvidia) | 0.57 | 0.96 | 2.22 | 38.08 | 7.27 | 79.07 | 915 |
| Dell Precision 5860 Tower (Tensor RT) | 0.44 | 1.06 | 3.05 | 2.52 | 2.86 | 88.59 | 1,603 |
| Dell Alienware Aurora R16 (Windows ML – Intel) | 0.98 | 7.94 | 23.20 | 26.95 | 54.68 | 2,518.94 | 168 |
| Dell Alienware Aurora R16 (Windows ML – Nvidia) | 0.43 | 0.91 | 2.19 | 31.23 | 4.34 | 56.24 | 1,155 |
| Dell Alienware Aurora R16 (Tensor RT) | 0.45 | 1.02 | 2.97 | 3.12 | 3.21 | 59.95 | 1,637 |
Topaz Video AI
A new workload we added to our testing process focuses on the performance of a platform running Topaz Video AI to enhance a scanned film. We have some previously unearthed footage of the 1947 U.S. Open. While the official historical footage is all black and white, while scanning some family films, we uncovered footage of many players practicing and shooting throughout the day, including the winning putt by Lew Worsham. The original footage is 8mm film, with an average framerate of 16FPS that is hand cranked. This footage was recorded by Kevin’s grandmother and offered a unique viewpoint of this tournament held in St. Louis.
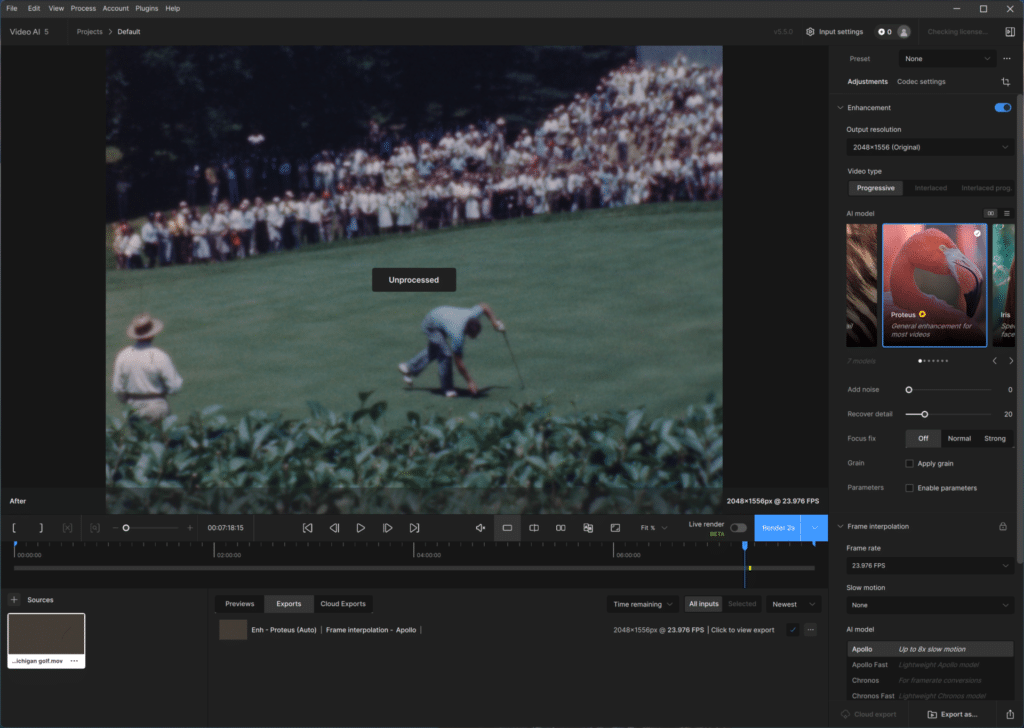
The file we chose for processing is 8 minutes long and 14.6GB in size. We imported the file into Topaz Video AI, selected Proteus, the general video enhancing algorithm, and increased the framerate to 23.97FPS. The job is then batched up, with the processing time being the final score.
The NVIDIA RTX 4090 inside the Alienware R16 processed the video at roughly a 7FPS rate, with a total processing time of 27 minutes and 58 seconds. The RTX 6000 Ada inside the Precision 5860 couldn’t keep up, with an average processing rate of around 5FPS and a total time of 41 minutes and 12 seconds.
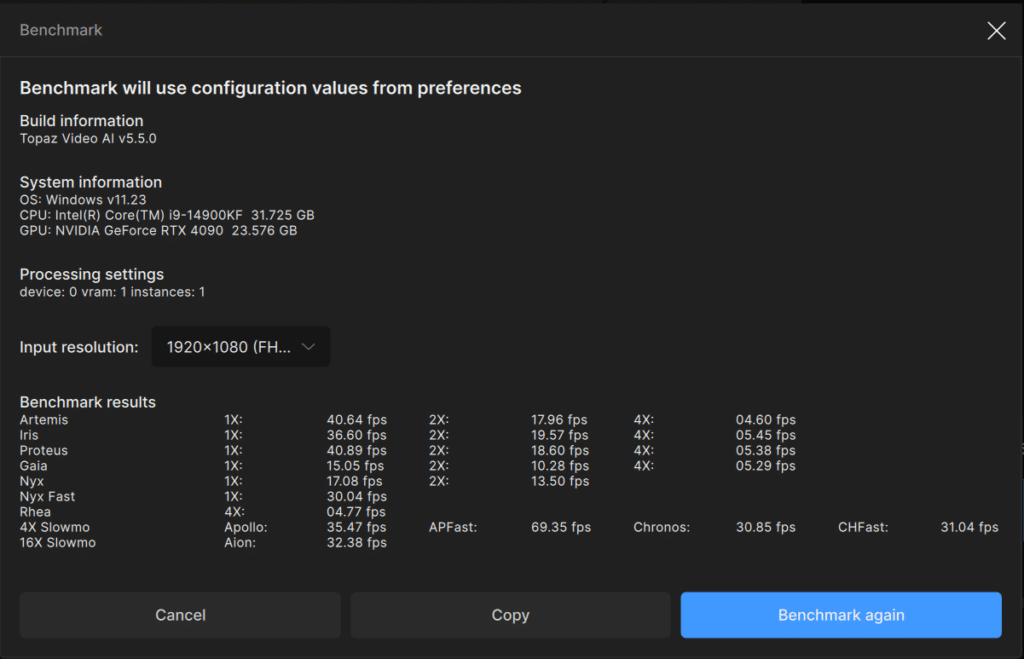
The Topaz Video AI suite also has an onboard benchmark to measure the system’s performance across different video-enhancing algorithms. We used it to compare the NVIDIA RTX 6000 Ada and RTX 4090.
Starting with the NVIDIA RTX 4090, the Proteus configuration tested as having a processing rate of 40.89FPS at 1X, 18.60FPS at 2X, and 5.38FPS at 4X with a 1080P video source.
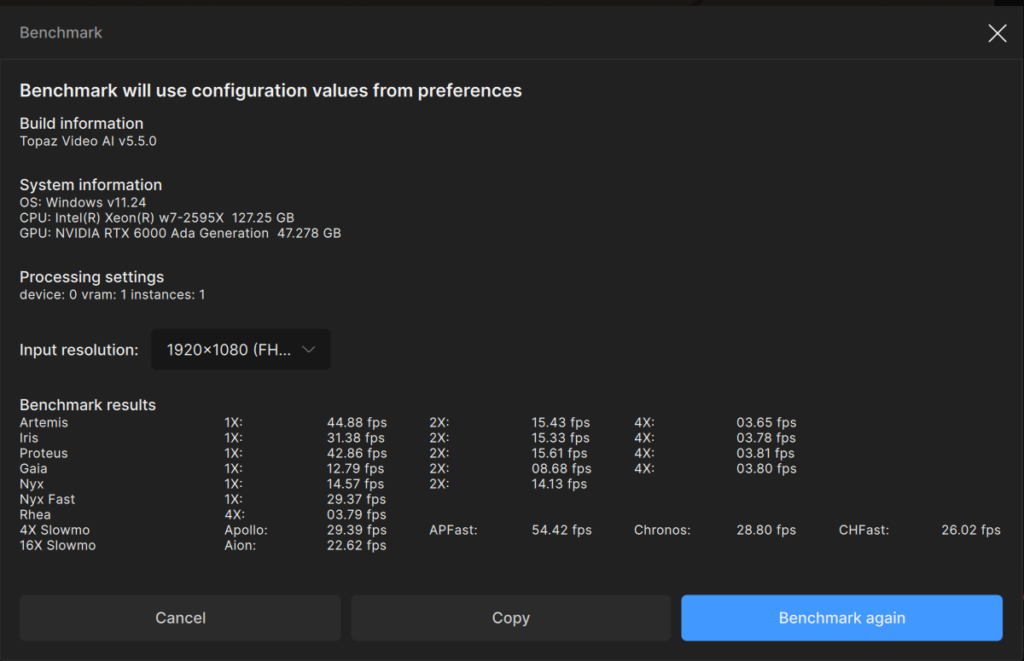
By comparison, the RTX 6000 Ada starts with a higher 42.86FPS rate at 1X but tapers down to 15.61FPS at 2X and 3.81FPS at 4X.
Picking the Right GPU for AI: NVIDIA RTX 4090 vs. RTX 6000 Ada
As we saw with many of our benchmarks, the fundamental difference between the consumer-facing NVIDIA RTX 4090 and enterprise-facing RTX 6000 Ada lies in their power budget and clock speeds. The RTX 4090 operates at higher clock speeds with a substantial 600W power budget before overclocking, making it exceptionally powerful for single-threaded workloads. This aggressive power profile allows it to process specific workloads faster than its workstation counterpart.
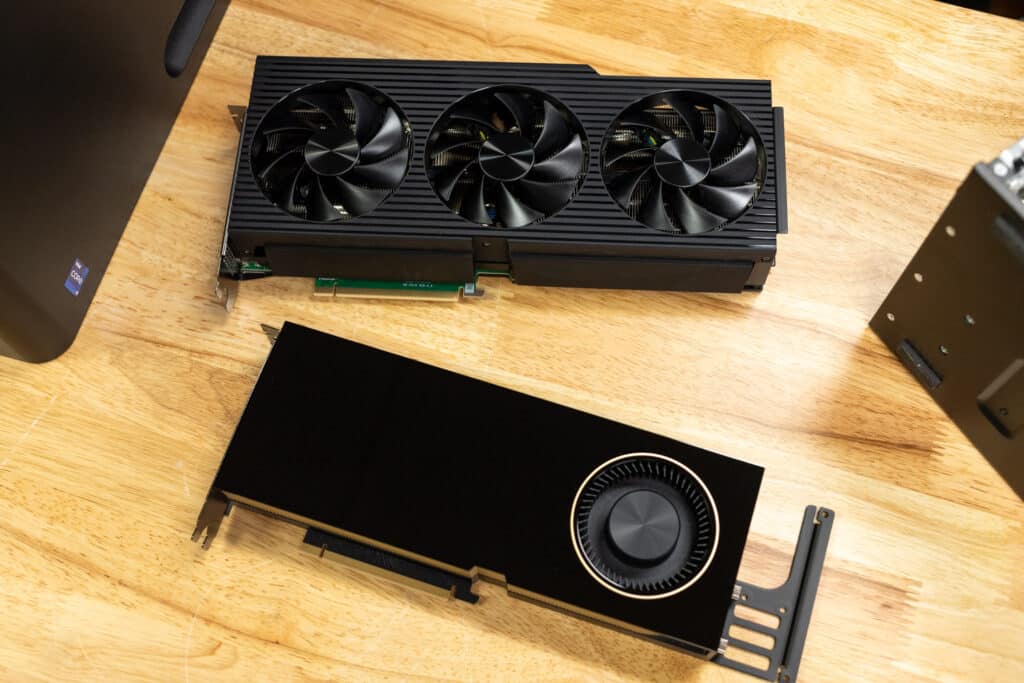
However, the RTX 6000 Ada’s 48GB VRAM (double that of the 4090) provides significant advantages for specific workflows. This larger memory capacity enables running larger AI models. Although you can load bigger models sequentially from storage, the bigger VRAM still allows for higher throughput (tok/s) and effective batching with vLLM or Nvidia’s NIM microservices.
An overlooked aspect of GPU performance is how different workloads utilize parallel processing capabilities. Video processing is an excellent example of why more VRAM doesn’t always translate to better performance. Many video processing tasks are inherently sequential, with dependencies between frames limiting parallel execution. In our Topaz testing, this limitation became evident as the RTX 4090’s higher clock speeds resulted in completing the task 10 minutes faster than the RTX 6000 Ada, despite having less VRAM.
This behavior is due to the nature of video processing pipelines. While some operations, like color grading, can be effectively parallelized, others, such as temporal noise reduction or frame interpolation, require sequential processing due to frame-to-frame dependencies. These dependencies create a bottleneck where additional VRAM can’t compensate for raw processing speed.
We can see a similar dropoff with gaming workloads. Gaming at higher resolutions will typically consume more VRAM, allowing more significant resources to be loaded. Still, most games will not consume the full 24GB VRAM on the 4090.
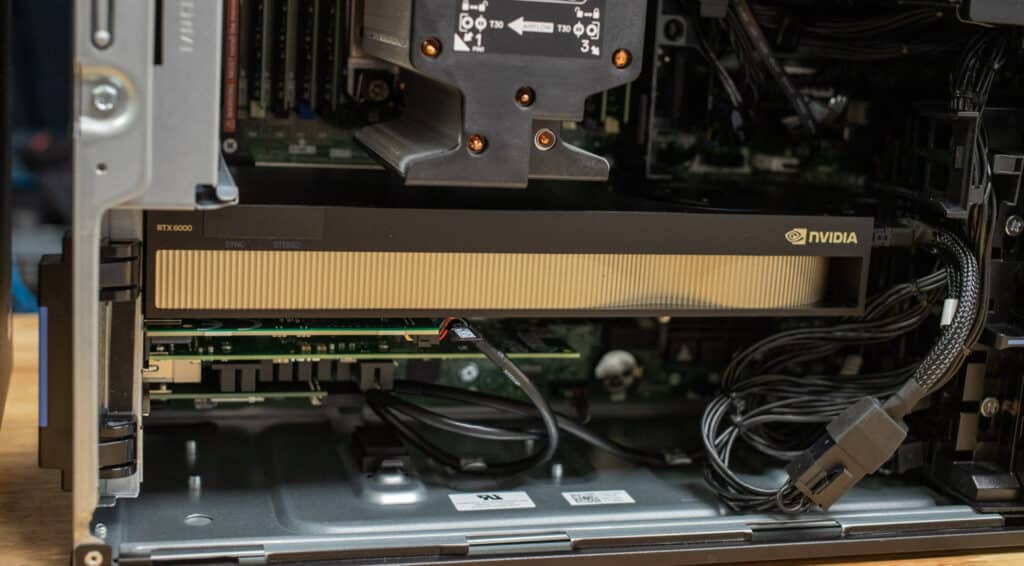
The RTX 6000 Ada distinguishes itself in enterprise environments through its vGPU capabilities. NVIDIA officially supports virtual GPU functionality on the card, allowing organizations to partition the 48GB VRAM among multiple virtual machines. This feature is particularly valuable for engineering firms and SaaS providers offering cloud-based CAD and 3D rendering services. The RTX 4090, while powerful, lacks official support for such virtualization, limiting its flexibility in enterprise deployments.
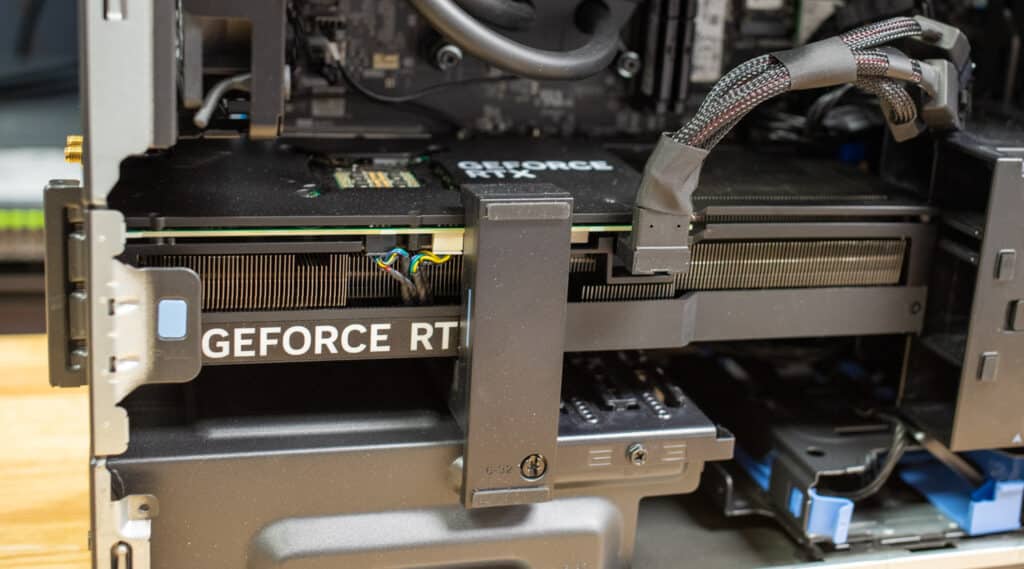
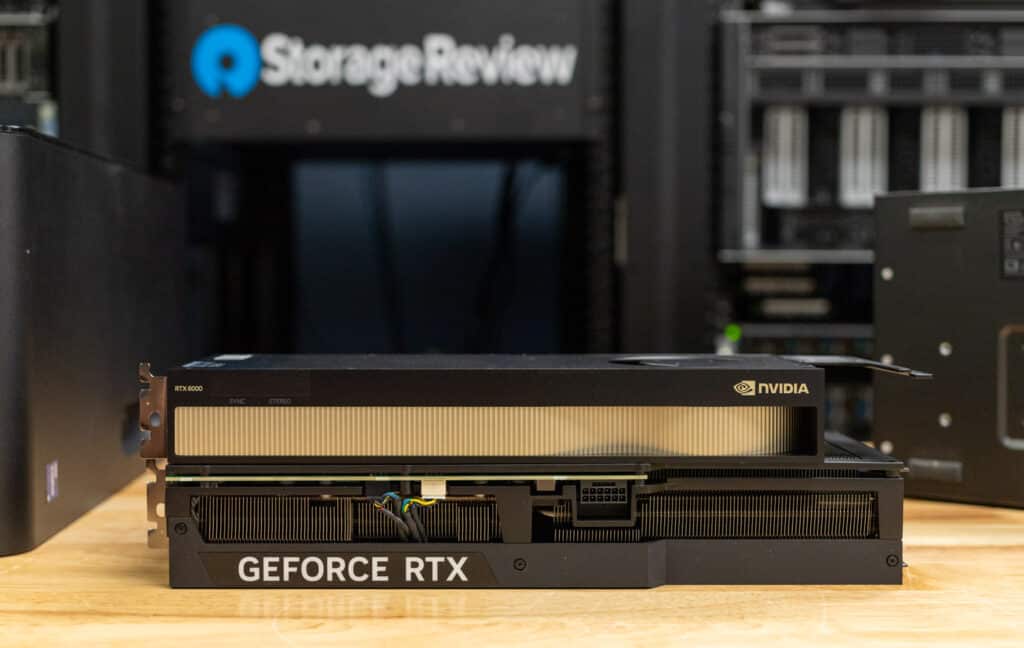
The physical implementation of these GPUs creates significant differences in their deployment options. The RTX 4090’s high power draw necessitates massive cooling solutions, typically requiring 3-3.5 slot spaces with front-facing fans. This design makes it challenging to implement in standard workstation or server configurations.
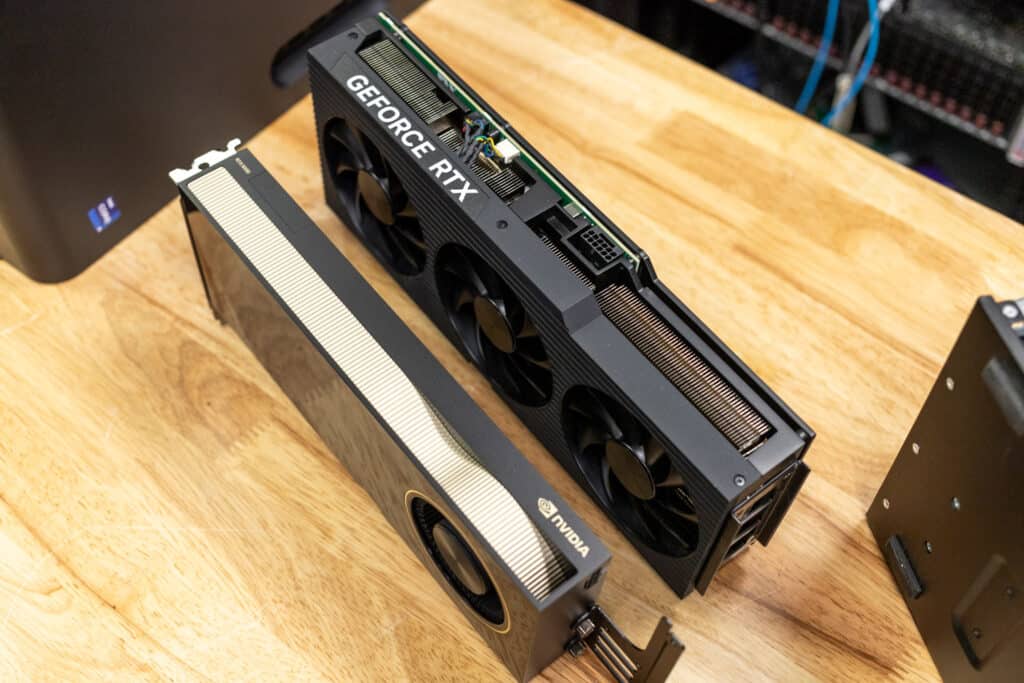
In contrast, the RTX 6000 Ada’s 300W power envelope allows for a more conventional 2-slot blower design, making it ideal for workstation or server deployments. Some vendors like HP and Peuget Systems offer officially supported 4-GPU configurations, and the cards can be easily integrated into standard 10-GPU server chassis. This standardization is crucial for enterprise environments where reliability and support are paramount.
At scale, the A6000 demonstrates clear advantages in several critical areas: power density, thermal management, reliability, and vendor support. These factors become increasingly important in data center environments where stability and predictability outweigh raw performance metrics. The official support channels and enterprise-grade features make the A6000 a more suitable choice for organizations requiring professional-grade reliability and support contracts.
The choice between these GPUs ultimately depends on specific use cases and operational requirements. While the RTX 4090 excels in raw performance for specific workloads, the A6000’s enterprise features and deployment flexibility make it the preferred choice for professional environments requiring stability, virtualization, and official support channels.
Conclusion
When comparing the Dell Alienware Aurora R16 and Precision 5860, it becomes clear that the choice between these systems hinges on your specific AI workload and budget. The Alienware Aurora R16, with its NVIDIA RTX 4090 GPU and consumer-grade components, delivers exceptional raw performance for GPU-intensive tasks. Its affordability and impressive single-threaded performance make it a viable choice for smaller-scale AI projects, video processing, and GPU-heavy applications where high clock speeds and bandwidth are critical.
However, the Dell Precision 5860 demonstrates why workstation-class systems command a higher price. With the NVIDIA RTX 6000 Ada’s 48GB of GDDR6 memory, significantly more CPU cores, and supporting up to 2TB of ECC RAM, the Precision excels in scenarios requiring large-scale parallel processing, stability, and long-term reliability. It’s particularly well-suited for enterprises running large AI models, handling massive datasets, or deploying virtual GPU workloads. For customers who want the Intel 14900K in a Precision desktop, the 3680 supports that CPU and extends the single-core performance for workloads that may benefit from it. The Dell Precision line has many benefits beyond performance, including certified drivers.
For budget-conscious enthusiasts or organizations experimenting with AI, the Alienware Aurora R16 paired with an NVIDIA RTX 4090 provides an accessible entry point without sacrificing capability. However, the Dell Precision 5860 with one or two NVIDIA RTX 6000 Ada GPUs offers the robustness, scalability, and enterprise-grade support required to efficiently handle the most demanding AI workflows for professionals or enterprises in data-intensive environments.
Ultimately, the right choice depends on your workload, tolerance for compromises, and budget. Dell has delivered compelling solutions at both ends of the spectrum, proving that whether you need consumer performance or professional-grade reliability, there’s a system tailored to your AI needs.


 Amazon