
The NVIDIA GeForce RTX 5070 Ti edition cards will launch on February 20th with an MSRP of $749.
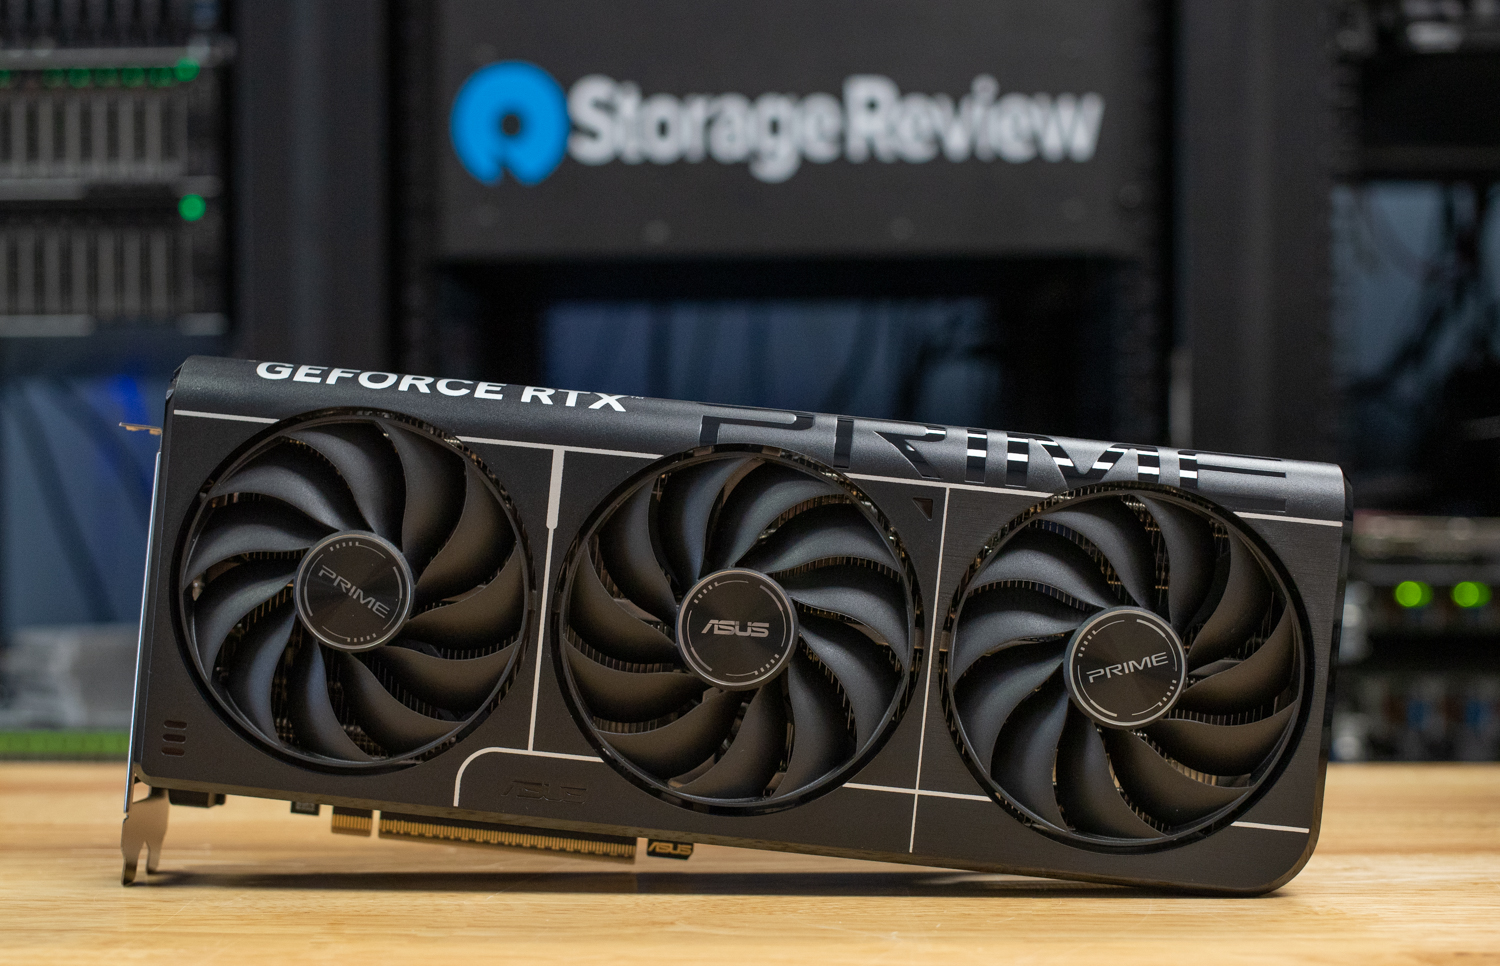
The NVIDIA GeForce RTX 5070 Ti edition cards will launch on February 20th with an MSRP of $749. Since the Ti models do not have Founders Edition versions, NVIDIA provided us with an ASUS Prime GeForce RTX 5070 Ti for testing. It is positioned just above the entry-level RTX 5070 and offers performance close to the RTX 5080. This makes it an attractive option for gamers looking to upgrade or users entering entry-level AI workloads without overspending.
Equipped with the same advanced AI features as the RTX 5090 and RTX 5080, the ASUS Prime RTX 5070 Ti brings NVIDIA’s latest innovations to gamers at an affordable price. Featuring DLSS 4 with Multi-Frame Generation and Ray Reconstruction for smooth performance and stunning visuals, it ensures game responsiveness with NVIDIA Reflex 2 and Frame Warp, offering low latency for competitive play. Full ray tracing with neural rendering delivers true-to-life graphics, providing a more immersive gaming experience.
ASUS Prime RTX 5070 Ti GPU Specifications & Comparison
The ASUS PRIME RTX 5070 Ti features 8,960 CUDA cores, offering a notable jump from the RTX 4070 Ti’s 7,680 cores while sitting below the RTX 5080’s 10,752 cores. Alongside this increase in core count, it boasts 16GB of GDDR7 memory, a much-needed improvement over the RTX 4070 Ti’s 12GB of GDDR6. The jump to 16GB of GDDR7 memory is crucial as modern games increasingly demand more VRAM for their high-resolution textures, complex geometry, and ray-traced effects.
Furthermore, the increased bandwidth is particularly beneficial for AI-enhanced gaming features like DLSS 4 and neural rendering, which require rapid access to AI models stored in VRAM. Games utilizing NVIDIA’s AI-powered NPCs also benefit from the expanded memory capacity, as these features need additional VRAM to store their neural networks. With this combination of increased processing power and faster memory, the RTX 5070 Ti delivers excellent performance for gaming and AI-accelerated applications without the power and cost demands of flagship models.
Here are the full specs of the recent cards we have reviewed.
| GPU Comparison | NVIDIA RTX 4090 | NVIDIA RTX 5070 | ASUS Prime NVIDIA RTX 5070 Ti | NVIDIA RTX 5080 | NVIDIA RTX 5090 |
| GPU Name | AD102 | GB205 | GB203 | GB203 | GB202 |
| Architecture | Ada Lovelace | Blackwell 2.0 | Blackwell 2.0 | Blackwell 2.0 | Blackwell 2.0 |
| Process Size | 5 nm | 5 nm | 5 nm | 5 nm | 5 nm |
| Transistors | 76,300 million | 31,000 million | 45,600 million | 45,600 million | 92,200 million |
| Density | 125.3M / mm² | 117.9M / mm² | 120.6M / mm² | 120.6M / mm² | 123.9M / mm² |
| Die Size | 609 mm² | 263 mm² | 378 mm² | 378 mm² | 744 mm² |
| Slot Width | Triple-slot | Dual-slot | 2.5 Slot | Dual-slot | Dual-slot |
| Dimensions | 304 mm x 137 mm x 61 mm | 242 mm x 112 mm | 304 x 126 x 50 mm | 304 mm x 137 mm x 48 mm | 304 mm x 137 mm x 48 mm |
| TDP | 450 W | 250 W | 300 W | 360 W | 575 W |
| Video Connections | 1x HDMI 2.1, 3x DisplayPort 1.4a | 1x HDMI 2.1b, 3x DisplayPort 2.1a | 1x HDMI 2.1b, 3x DisplayPort 2.1b | 1x HDMI 2.1b, 3x DisplayPort 2.1b | 1x HDMI 2.1b, 3x DisplayPort 2.1b |
| Power Connectors | 1x 16-pin | 1x 16-pin | 1x 16-pin | 1x 16-pin | 1x 16-pin |
| Bus Interface | PCIe 4.0 x16 | PCIe 5.0 x16 | PCIe 5.0 x16 | PCIe 5.0 x16 | PCIe 5.0 x16 |
| Base Clock | 2235 MHz | 2165 MHz | 2300 MHz | 2295 MHz | 2017 MHz |
| Boost Clock | 2520 MHz | 2510 MHz | OC mode: 2482MHz Default mode: 2452MHz (Boost Clock) |
2617 MHz | 2407 MHz |
| Memory Clock | 1313 MHz (21 Gbps effective) | 2209 MHz (28 Gbps effective) | 1750 MHz (28 Gbps effective) | 2366 MHz (30 Gbps effective) | 2209 MHz (28 Gbps effective) |
| Memory Size | 24 GB | 12 GB | 16 GB | 16 GB | 32 GB |
| Memory Type | GDDR6X | GDDR7 | GDDR7 | GDDR7 | GDDR7 |
| Memory Bus | 384 bit | 192 bit | 256 bit | 256 bit | 512 bit |
| Memory Bandwidth | 1.01 TB/s | 672.2 GB/s | 896.0 GB/s | 960.0 GB/s | 1.79 TB/s |
| CUDA Cores | 16,384 | 6,144 | 8960 | 10,752 | 21,760 |
| TMUs | 512 | 192 | 280 | 336 | 680 |
| ROPs | 176 | 64 | 128 | 128 | 192 |
| SM Count | 128 | 48 | 70 | 84 | 170 |
| Tensor Cores | 512 | 192 | 280 | 336 | 680 |
| RT Cores | 128 | 48 | 70 | 84 | 170 |
| L1 Cache | 128 KB (per SM) | 128 KB (per SM) | 128 KB (per SM) | 128 KB (per SM) | 128 KB (per SM) |
| L2 Cache | 72 MB | 40 MB | 64 MB | 64 MB | 88 MB |
| Pixel Rate | 443.5 GPixel/s | 160.6 GPixel/s | 313.9 GPixels/s | 335.0 GPixel/s | 462.1 GPixel/s |
| Texture Rate | 1,290 GTexel/s | 481.9 GTexel/s | 686.6 GTexel/s | 879.3 GTexel/s | 1,637 GTexel/s |
| FP16 (half) | 82.58 TFLOPS (1:1) | 30.84 TFLOPS (1:1) | 43.94 TFLOPS (1:1) | 56.28 TFLOPS (1:1) | 104.8 TFLOPS (1:1) |
| FP32 (float) | 82.58 TFLOPS | 30.84 TFLOPS | 43.94 TFLOPS | 56.28 TFLOPS | 104.8 TFLOPS |
| FP64 (double) | 1,290 GFLOPS (1:64) | 481.9 GFLOPS (1:64) | 686.6 GFLOPS (1:64) | 879.3 GFLOPS (1:64) | 1.637 TFLOPS (1:64) |
| Launch Price (USD) | $1,599 | $549 | $749 | $999 | $1,999 |
For a deeper dive into the Blackwell architecture and the innovations powering the 50-series GPUs, please look at our two previous reviews on the RTX 5080 and the RTX 5090 series cards.
Build and Design
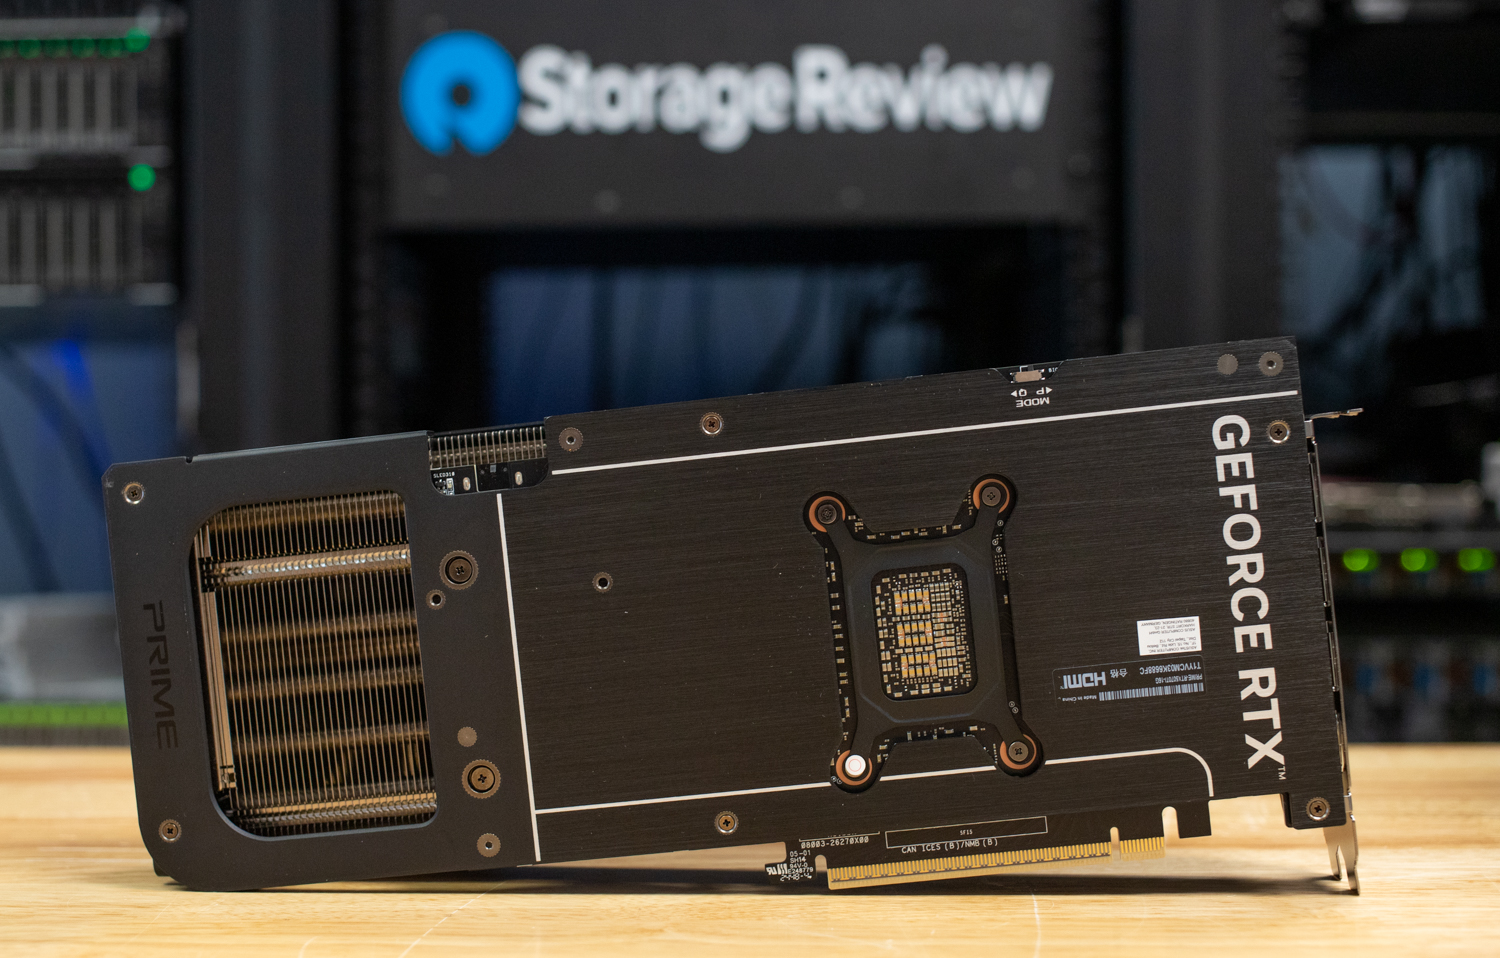
This card measures 12 x 5 x 2 inches (304 x 126 x 50 mm), making it the same length as the Founders Editions RTX 5080 and RTX 5090, but with a thicker 2.5-slot width design.
For cooling, ASUS has implemented a triple Axial-tech fan design with dual ball bearings to enhance durability and maintain consistent airflow. This setup is complemented by a large heatsink, with heat pipes spanning the entire card and a vented backplate and sides to maximize heat dissipation. Additionally, all three fans come to a standstill when GPU temperatures are below 50°C, allowing for silent operation during less demanding tasks or light gaming. The fans automatically start up again once temperatures exceed 55°C.
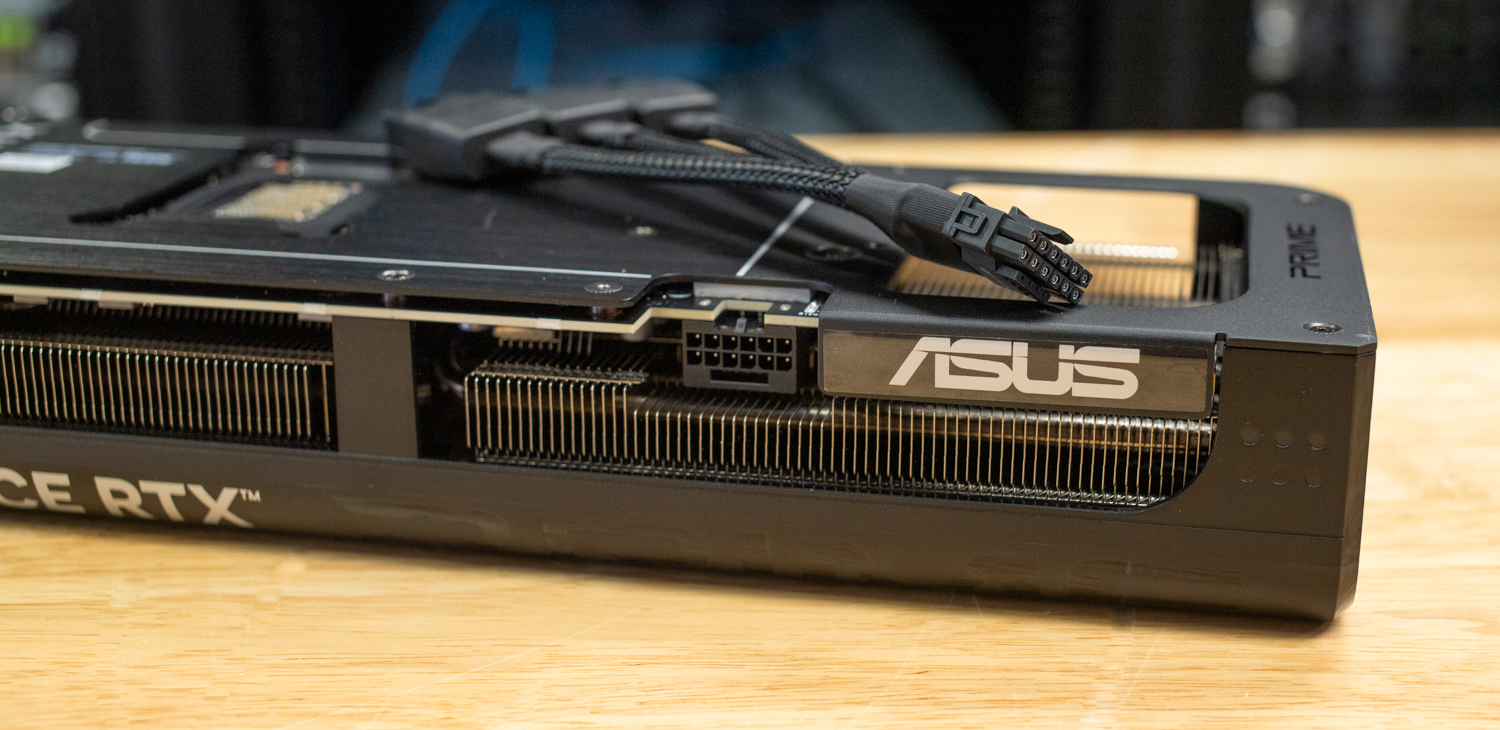 For power, the unit includes, like many of the newer cards, a 12-pin to 3x 8-pin power cable suited to the card’s 300W rated power draw. The above image shows the unit’s aluminum backplate, which protects the card and contributes to the overall cooling of the rear components. The backplate also helps improve the card’s rigidity.
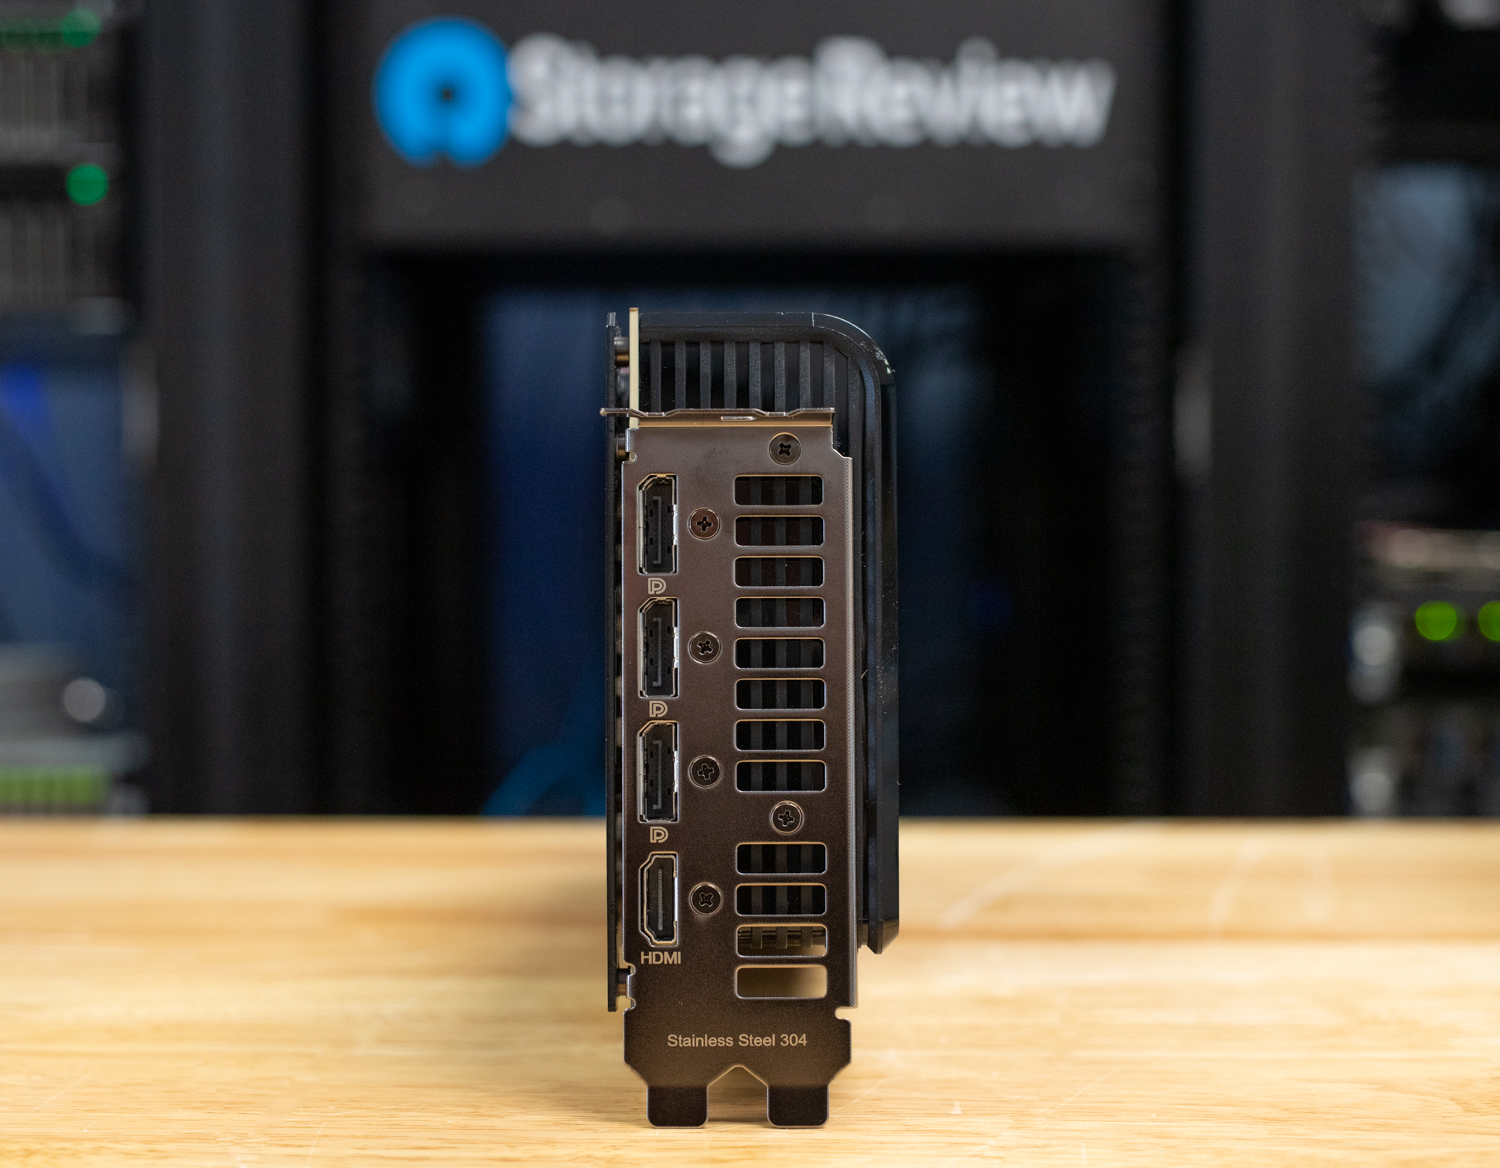
On the rear of the card, we can see the two-slot 304 stainless-steel backplate, but it’s important to note that this card takes up 2.5 slots due to the thickness of the cooler. For display connectivity, the card offers 1x HDMI 2.1b and 3x DisplayPort 2.1b, ensuring compatibility with a range of modern displays for high-resolution gaming or professional work.
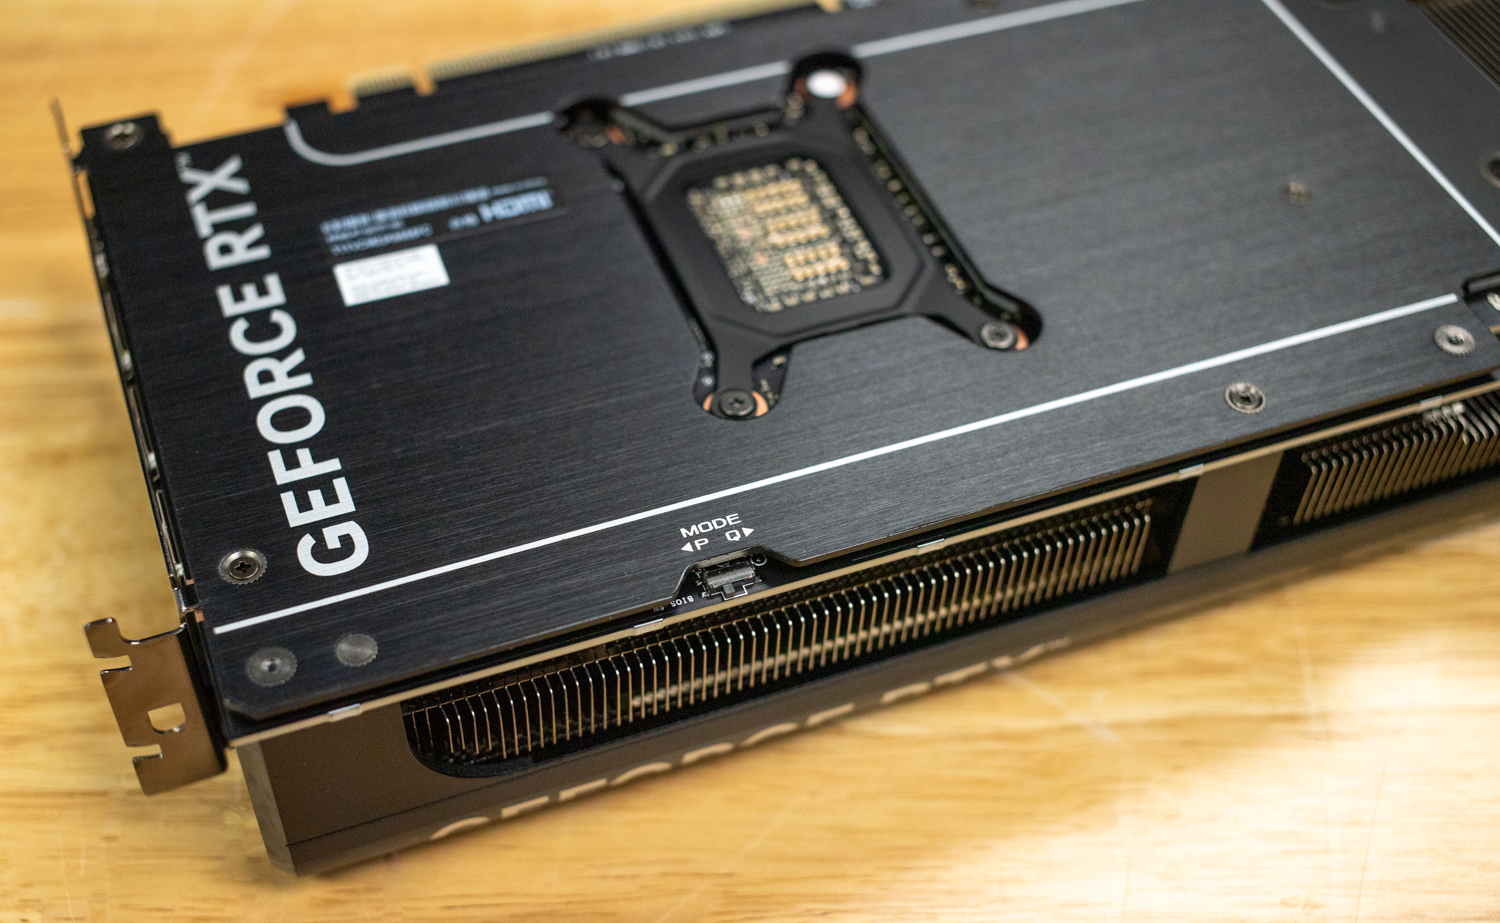
Other notable features of this card include its switchable BIOS, controlled via a switch on the card, which toggles between “P” (performance) mode and “Q” (quiet) mode. This unit also incorporates a phase-change thermal pad designed to improve cooling performance and the longevity of the thermal material in contact with the chip. Lastly, ASUS provides GPU Tweak III software for fine-tuning the card’s performance to meet specific requirements.
Benchmarking: ASUS Prime RTX 5070 Ti
To optimize the ASUS Prime GeForce RTX 5070 Ti, we used our high-performance AMD Threadripper platform. With a 64-core CPU and a custom water cooling loop, this system ensures the GPU operates at full capacity without CPU bottlenecks. The same configuration was used to test the Founders RTX 5080, RTX 5090, and RTX 4090, ensuring a fair and consistent comparison across all cards. The one subtle part to note is our tests were performed in “P” mode on this card.
Below is the complete system configuration.
StorageReview AMD Threadripper Test Platform
- Motherboard: ASUS Pro WS TRX50-SAGE WIFI
- CPU: AMD Ryzen Threadripper 7980X 64-Core
- RAM: 32GB DDR5 4800MT/s
- Storage: 2TB Samsung 980 Pro
- OS: Windows 11 Pro for Workstations
- Driver: NVIDIA 571.86 GameReady Driver
UL Procyon: AI Text Generation
The Procyon AI Text Generation Benchmark simplifies AI LLM performance testing by offering a compact and consistent evaluation method. It allows for repeated testing across multiple LLM models while minimizing the complexity of large model sizes and variable factors. Developed with AI hardware leaders, it optimizes the use of local AI accelerators for more reliable and efficient performance assessments. The results measured below were tested using TensorRT.
| UL Procyon: AI Text Generation | ASUS Prime NVIDIA RTX 5070 Ti | NVIDIA RTX 5080 | NVIDIA RTX 5090 | NVIDIA RTX 4090 |
| Phi Overall Score | 4,179 | 4,400 | 5,749 | 4,958 |
| Phi Output Time To First Token | 0.290 s | 0.277 s | 0.244 s | 0.255 s |
| Phi Output Tokens Per Second | 192.487 tokens/s | 209.459 tokens/s | 314.435 tokens/s | 244.343 tokens/s |
| Phi Overall Duration | 15.771 s | 14.908 s | 10.280 s | 12.872 s |
| Mistral Overall Score | 4,412 | 4,635 s | 6,267 | 5,094 |
| Mistral Output Time To First Token | 0.374 s | 0.347 s | 0.297 s | 0.322 s |
| Mistral Output Tokens Per Second | 160.167 tokens/s | 163.598 tokens/s | 255.945 tokens/s | 183.266 tokens/s |
| Mistral Overall Duration | 19.480 s | 18.933 s | 12.593 s | 17.010 s |
| Llama3 Overall Score | 4,187 | 4,424 | 6,104 | 4,849 |
| Llama3 Output Time To First Token | 0.306 s | 0.283 s | 0.234 s | 0.259 s |
| Llama3 Output Tokens Per Second | 131.853 tokens/s | 136.177 tokens/s | 214.285 tokens/s | 150.039 tokens/s |
| Llama3 Overall Duration | 22.786 s | 21.985 s | 14.304 s | 19.991 s |
| Llama2 Overall Score | 4,284 | 4,790 | 6,591 | 5,013 |
| Llama2 Output Time To First Token | 0.560 s | 0.493 s | 0.419 s | 0.500 s |
| Llama2 Output Tokens Per Second | 75.905 tokens/s | 83.653 tokens/s | 134.502 tokens/s | 92.853 tokens/s |
| Llama2 Overall Duration | 39.545s | 35.703s | 23.018 s | 32.448 s |
In the text generation test, the RTX 5070 Ti, the most affordable card in the lineup, delivers performance surprisingly close to the RTX 5080 in AI text generation. The Phi benchmark scored 4,179 vs. 4,400, with a slight difference in tokens per second (192.487 vs. 209.46) and overall duration (15.77s vs. 14.91s). The Mistral and Llama3 benchmarks show similar trends, with negligible differences in token throughput. Llama2 presents a more significant gap, with the 5070 Ti scoring 4,284 vs. 4,790 and processing 75.91 vs. 83.65 tokens per second. Still, across all tests, the 5070 Ti remains close to the 5080’s performance, making it an outstanding choice for those on a budget and looking to get into AI text generation workloads.
UL Procyon: AI Image Generation
The Procyon AI Image Generation Benchmark consistently and accurately measures AI inference performance across various hardware, from low-power NPUs to high-end GPUs. It includes three tests: Stable Diffusion XL (FP16) for high-end GPUs, Stable Diffusion 1.5 (FP16) for moderately powerful GPUs, and Stable Diffusion 1.5 (INT8) for low-power devices. The benchmark uses the optimal inference engine for each system, ensuring fair and comparable results.
| UL Procyon: AI Image Generation (overall score: higher is better) | ASUS Prime NVIDIA RTX 5070 Ti | NVIDIA RTX 5080 | NVIDIA RTX 5090 | NVIDIA RTX 4090 |
| Stable Diffusion 1.5 (FP16) — Overall Score | 3,755 | 4,650 | 8,193 | 5,260 |
| Stable Diffusion 1.5 (FP16) — Overall Time | 26.625 s | 21.503 s | 12.204 s | 19.011 s |
| Stable Diffusion 1.5 (FP16) — Image Generation Speed | 1.664 s/image | 1.344 s/image | 0.763 s/image | 1.188 s/image |
| Stable Diffusion 1.5 (INT8) — Overall Score | 46,744 | 55,683 | 79,272 | 62,160 |
| Stable Diffusion 1.5 (INT8) — Overall Time | 5.348 s | 4.490 s | 3.154 s | 4.022 s |
| Stable Diffusion 1.5 (INT8) — Image Generation Speed | 0.669 s/image | 0.561 s/image | 0.394 s/image | 0.503 s/image |
| Stable Diffusion XL (FP16) — Overall Score | 3,352 | 4,257 | 7,179 | 5,025 |
| Stable Diffusion XL (FP16) — Overall Time | 178.946 s | 140.928s | 83.573 s | 119.379 s |
| Stable Diffusion XL (FP16) — Image Generation Speed | 11.184 s/image | 8.808 s/image | 5.223 s/image | 7.461 s/image |
In AI image generation, the RTX 5070 Ti delivers a respectable performance but falls behind the RTX 5080, which is expected. Stable Diffusion 1.5 (FP16) completes an image in 1.664 seconds compared to the 5080’s 1.344 seconds, with an overall score of 3,755 versus 4,650. The INT8 variant narrows the gap slightly, but the 5070 Ti still trails, generating images at 0.669 seconds each against the 5080’s at 0.561 seconds. The most considerable difference appears in Stable Diffusion XL (FP16), where the 5070 Ti takes 11.184 seconds per image, while the 5080 is notably faster at 8.808 seconds. Despite its lower ranking, the 5070 Ti remains a practical choice for budget-conscious users wanting to step into AI-driven image generation.
Luxmark
Luxmark is a GPU benchmark that uses LuxRender, an open-source ray tracing renderer, to evaluate a system’s performance in handling highly detailed 3D scenes. This benchmark is pertinent for assessing the graphical rendering prowess of servers and workstations, especially for visual effects and architectural visualization applications, where accurate light simulation is critical.
| Luxmark (higher is better) | ASUS Prime NVIDIA RTX 5070 Ti | NVIDIA RTX 5080 | NVIDIA RTX 5090 | NVIDIA RTX 4090 |
| Food Score | 12,073 | 13,637 | 23,141 | 17,171 |
| Hall Score | 28,635 | 30,815 | 51,725 | 38,887 |
In LuxMark, the RTX 5070 Ti delivers solid performance with a minimal gap compared to the 5080. In the “Food” scene, it scores 12,073, just behind the 5080’s 13,637, and in the “Hall” scene, it scores 28,635 vs. 30,815. The difference is relatively small, indicating that the 5070 Ti still provides strong rendering capabilities at a more affordable price.
Geekbench 6
Geekbench 6 is a cross-platform benchmark that measures overall system performance. The Geekbench Browser allows you to compare any system to it.
| Geekbench (higher is better) | ASUS Prime NVIDIA RTX 5070 Ti | NVIDIA RTX 5080 | NVIDIA RTX 5090 | NVIDIA RTX 4090 |
| GPU OpenCL Score | 246,875 | 265,397 | 374,807 | 333,384 |
In Geekbench, the RTX 5070 Ti, with a GPU OpenCL score of 246,875, offers solid gaming, video editing, and content creation performance. It’s a strong mid-tier option that still shows potential, delivering good power without the premium price of higher-end models like the 5080 or 5090. It’s great for 1440p or 4K gaming on high settings.
V-Ray
The V-Ray Benchmark measures rendering performance for CPUs, NVIDIA GPUs, or both using advanced V-Ray 6 engines. It uses quick tests and a simple scoring system to let users evaluate and compare their systems’ rendering capabilities. It’s an essential tool for professionals seeking efficient performance insights.
| V-Ray (higher is better) | ASUS Prime NVIDIA RTX 5070 Ti | NVIDIA RTX 5080 | NVIDIA RTX 5090 | NVIDIA RTX 4090 |
| vpaths | 8,018 | 9,311 | 14,764 | 10,847 |
Lastly, in V-Ray, the RTX 5070 Ti, with a V-Ray score of 0,018 vpaths, delivers decent rendering performance, coming in slightly behind the 5080 with 9,311 vpaths, 5090 14,764 vpaths, and 4090 10,847 vpaths. While it shows potential for rendering tasks, the higher-end models offer significantly faster performance for more complex workloads.
Power Consumption Benchmarking
Power consumption is a significant component of any high or low-end computing platform. Each new generation of GPU consumes more power under load, meaning larger power supplies and ample airflow for cooling. However, there is another aspect to power regarding performance: faster GPUs might spike higher, but the duration of each workload decreases.
At CES 2025, NVIDIA highlighted the improved power efficiency of the Blackwell architecture, which we were eager to see in action during an AI-driven workload. Using the Quarch Mains Analyzer in our test lab, we measured the total system power consumption while running the Procyon AI Image Generator Stable Diffusion XL FP16 test. This workload pushed each GPU to its power limits, with clear start and stop points for each generated image. This section compares the results of the new GeForce RTX 5090 and the previous-generation GeForce RTX 4090 and RTX 6000 Ada. Here is the link for a detailed review of the GeForce RTX 5080’s results.
We tested the Asus PRIME RTX 5070 Ti, with a 300W power consumption rating, for the power test. During the Procyon AI image-generating test, the system’s power consumption increased from an idle state of 231W to 601W under load, increasing by 370W. The average, under load, dropped to about 303W, which is interesting since the card is rated for 300W power consumption.
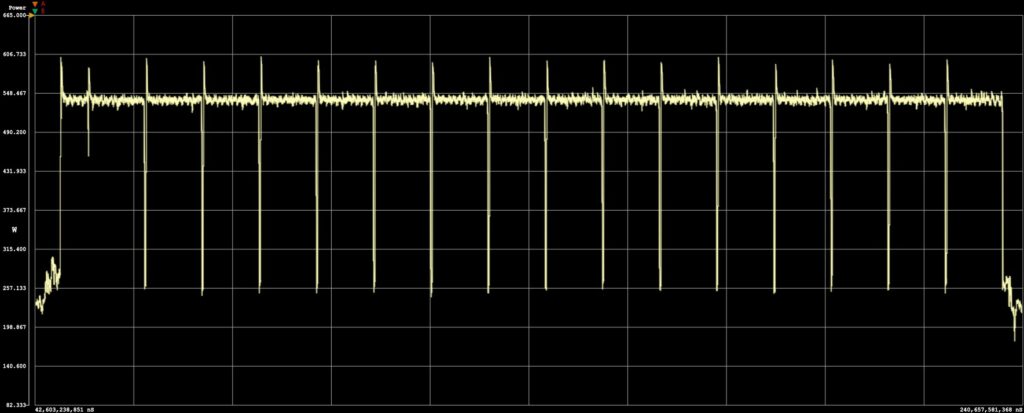
The second-to-last image was generated in just 11.1 seconds, with the system consuming 1.66Wh during that period.
Conclusion
One of the standout aspects of the GeForce RTX 5070 Ti is its performance. It delivers robust results in AI workloads, coming surprisingly close to the RTX 5080 in many benchmarks. This makes it an excellent option for those looking to get the most bang for their buck, especially as it comes equipped with 16GB of GDDR7, matching the GeForce RTX 5080.
Priced at $749, the RTX 5070 Ti offers an outstanding balance of performance and features, making it an attractive option for budget-conscious users. However, the card’s power consumption can exceed its rated 300W, so you might need a more robust power supply and cooling solution. Additionally, while it performs admirably, it does fall behind the RTX 5080 and higher models in more demanding AI and rendering tasks.
The ASUS Prime GeForce RTX 5070 Ti is highly recommended for those seeking a powerful yet affordable GPU. It’s ideal for 1440p or 4K gaming and entry-level AI workloads, offering exceptional value and 16GB of GDDR7 without the premium price tag of higher-end models.
Engage with StorageReview
Newsletter | YouTube | Podcast iTunes/Spotify | Instagram | Twitter | TikTok | RSS Feed