
At $137.99 for the 2TB model, the Crucial P310 is a budget-friendly, high-capacity option that balances affordability and performance.
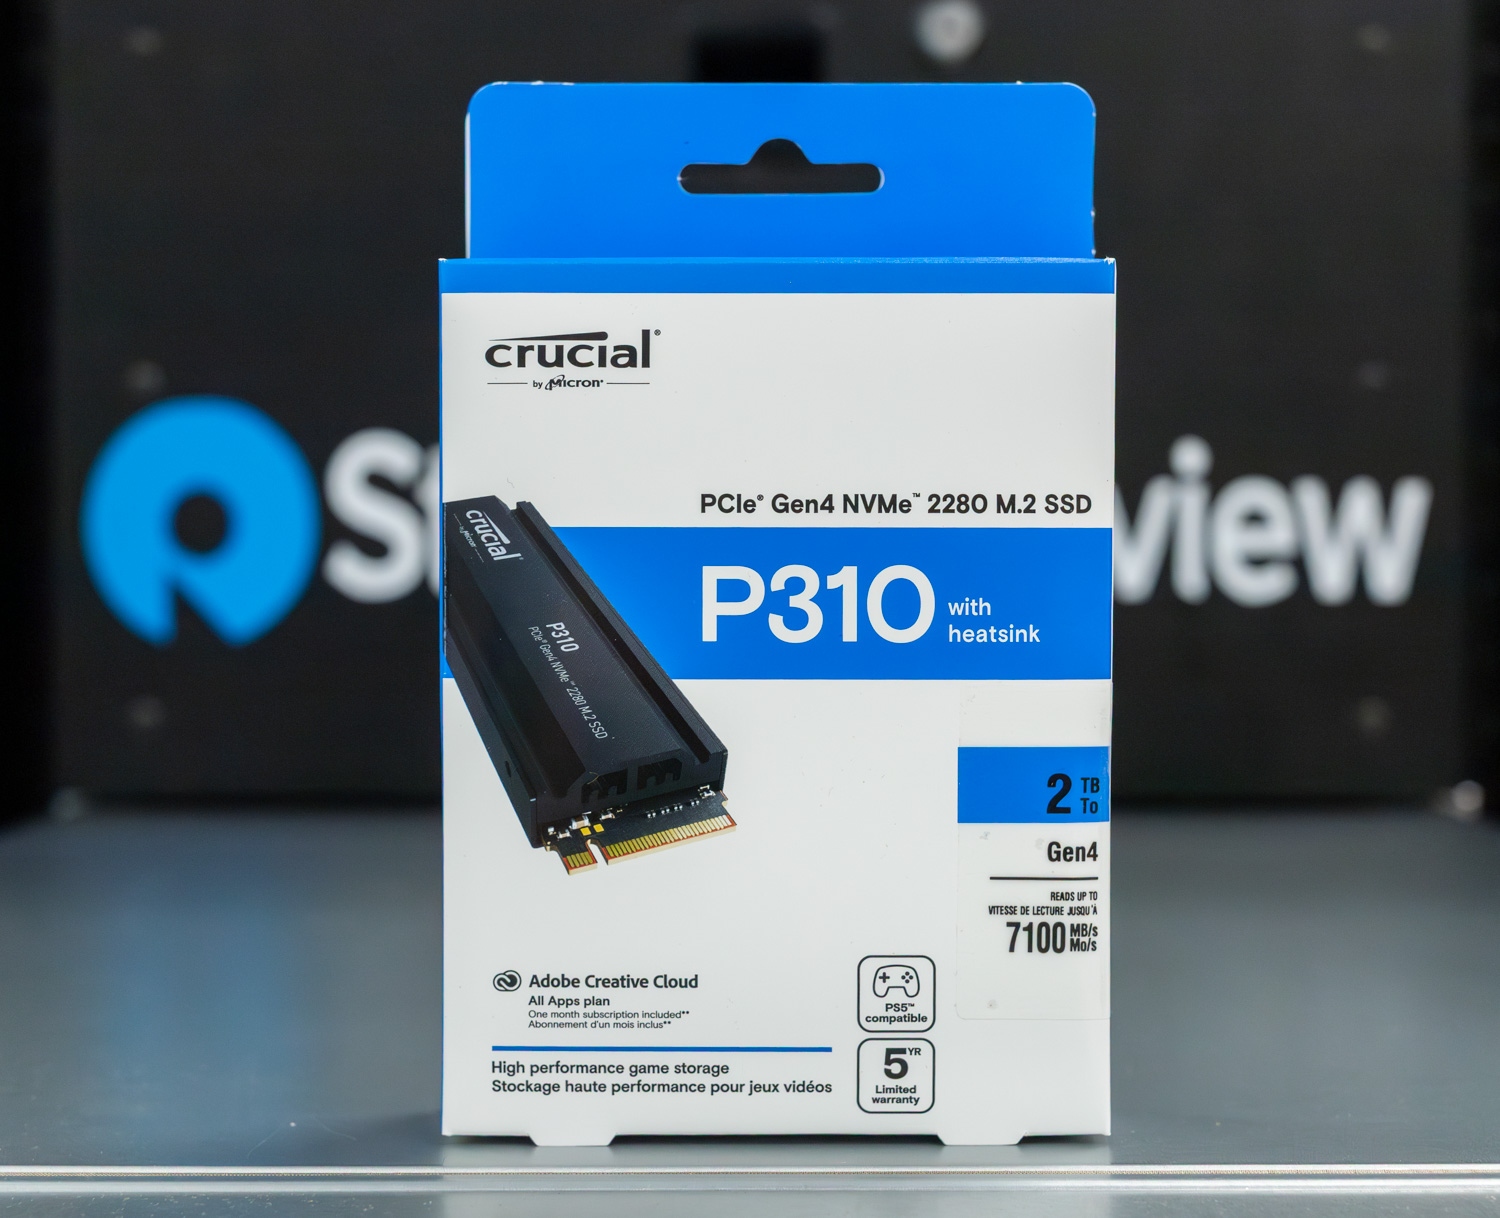
Crucial sent the new P310 2TB NVMe SSD with a heatsink for testing in the lab. It’s designed to deliver high-speed storage at an accessible price. This Gen4 drive pushes sequential read speeds up to 7,100MB/s, making it a solid upgrade over SATA SSDs.
Whether you’re looking to speed up game load times, improve boot speeds, or enhance workflow efficiency in applications like Adobe Photoshop and Microsoft Excel, the P310 is built to handle it. With compatibility across both Gen3 and Gen4 systems, it’s an easy way to extend a laptop or desktop’s lifespan without breaking the bank. At the time of this review, the Crucial P310 2TB with the heatsink is priced at $137.99, making it a compelling option for those seeking high-speed storage on a budget.
This isn’t our first look at the Crucial P310; we’ve also reviewed the 2230 form factor of this series here.
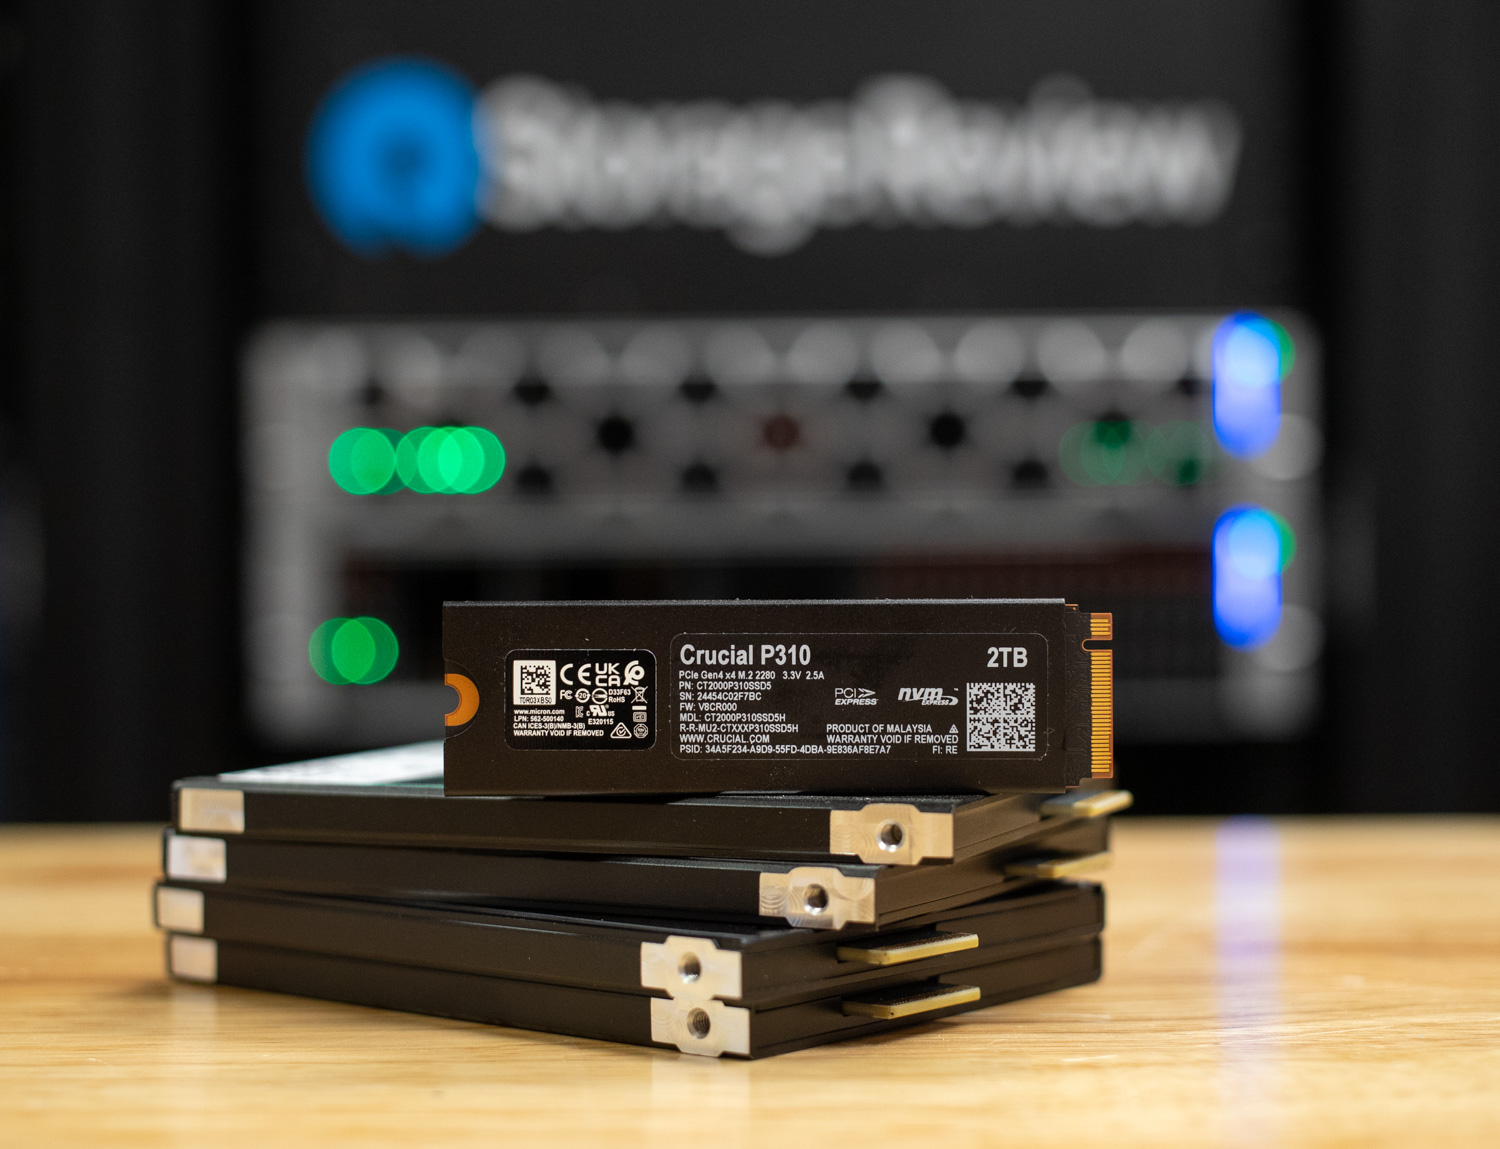
The Crucial P310 is available in three capacities in the 2280 form factor: 500GB, 1TB, and 2TB. The 1TB and 2TB models come with optional heatsinks for improved thermal performance. While a 1TB variant is also available in the compact 2230 form factor, this table focuses on the 2280 form factor models.
| Specification Crucial P310 | Crucial P310 2TB | Crucial P310 1TB | Crucial P310 500GB |
|---|---|---|---|
| Model Number | CT2000P310SSD5 | CT1000P310SSD5 | CT500P310SSD8 |
| Interface | NVMe (PCIe Gen 4 x 4) | NVMe (PCIe Gen 4 x 4) | NVMe (PCIe Gen 4 x 4) |
| Controller | Phison E27T | Phison E27T | Phison E27T |
| Flash Memory | 232-Layer Micron QLC | 232-Layer Micron QLC | 232-Layer Micron QLC |
| Form Factor | M.2 (2280) | M.2 (2280) | M.2 (2280) |
| Heatsink | Yes (optional) | Yes (optional) | No |
| Capacity | 2TB | 1TB | 500GB |
| Endurance (TBW) | 440TB | 440TB | 110TB |
| Sequential Read | 7,100 MB/s | 7,100 MB/s | 6,600 MB/s |
| Sequential Write | 6,000 MB/s | 6,000 MB/s | 3,500 MB/s |
| Warranty | 5-year limited warranty | 5-year limited warranty | 5-year limited warranty |
At its core, the P310 2280 remains single-sided, offering key advantages in thermal efficiency and power efficiency, particularly for thinner laptops and compact desktop builds. This design helps keep cooling manageable, even under sustained workloads. While the drive is in the longer 80mm footprint, its still a very compact SSD using little of the PCB.
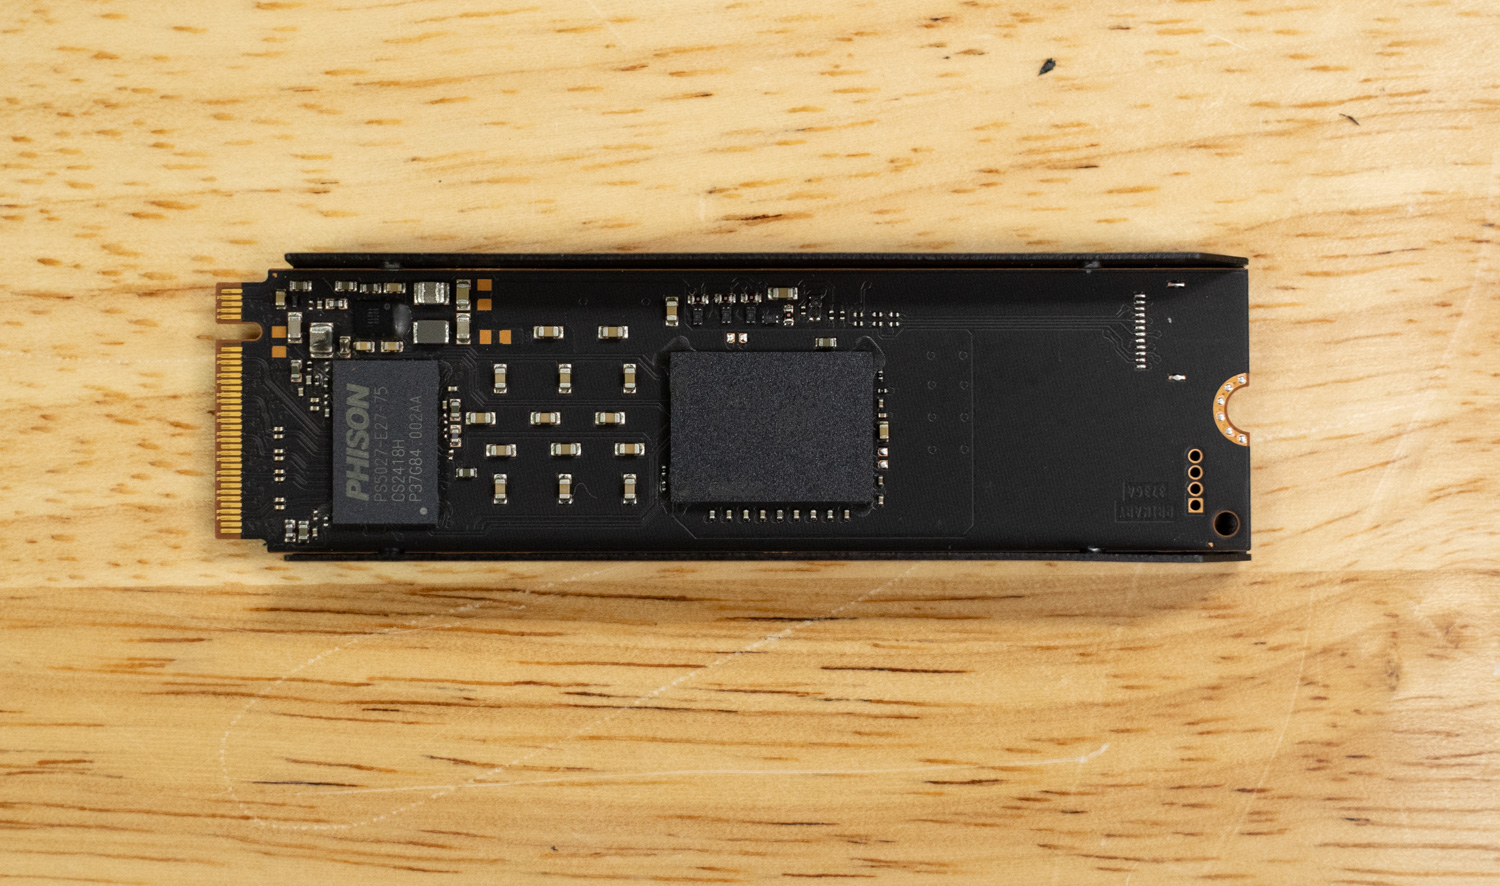
Under the hood, the P310 2280 utilizes the Phison E27T controller, a DRAM-less solution that leverages Host Memory Buffer (HMB) technology to reduce costs while maintaining respectable performance. Paired with 232-layer Micron QLC NAND, the drive aims to deliver solid sequential read and write speeds while optimizing for power efficiency, the same as we saw in our previously reviewed Crucial P310 2TB (2230).
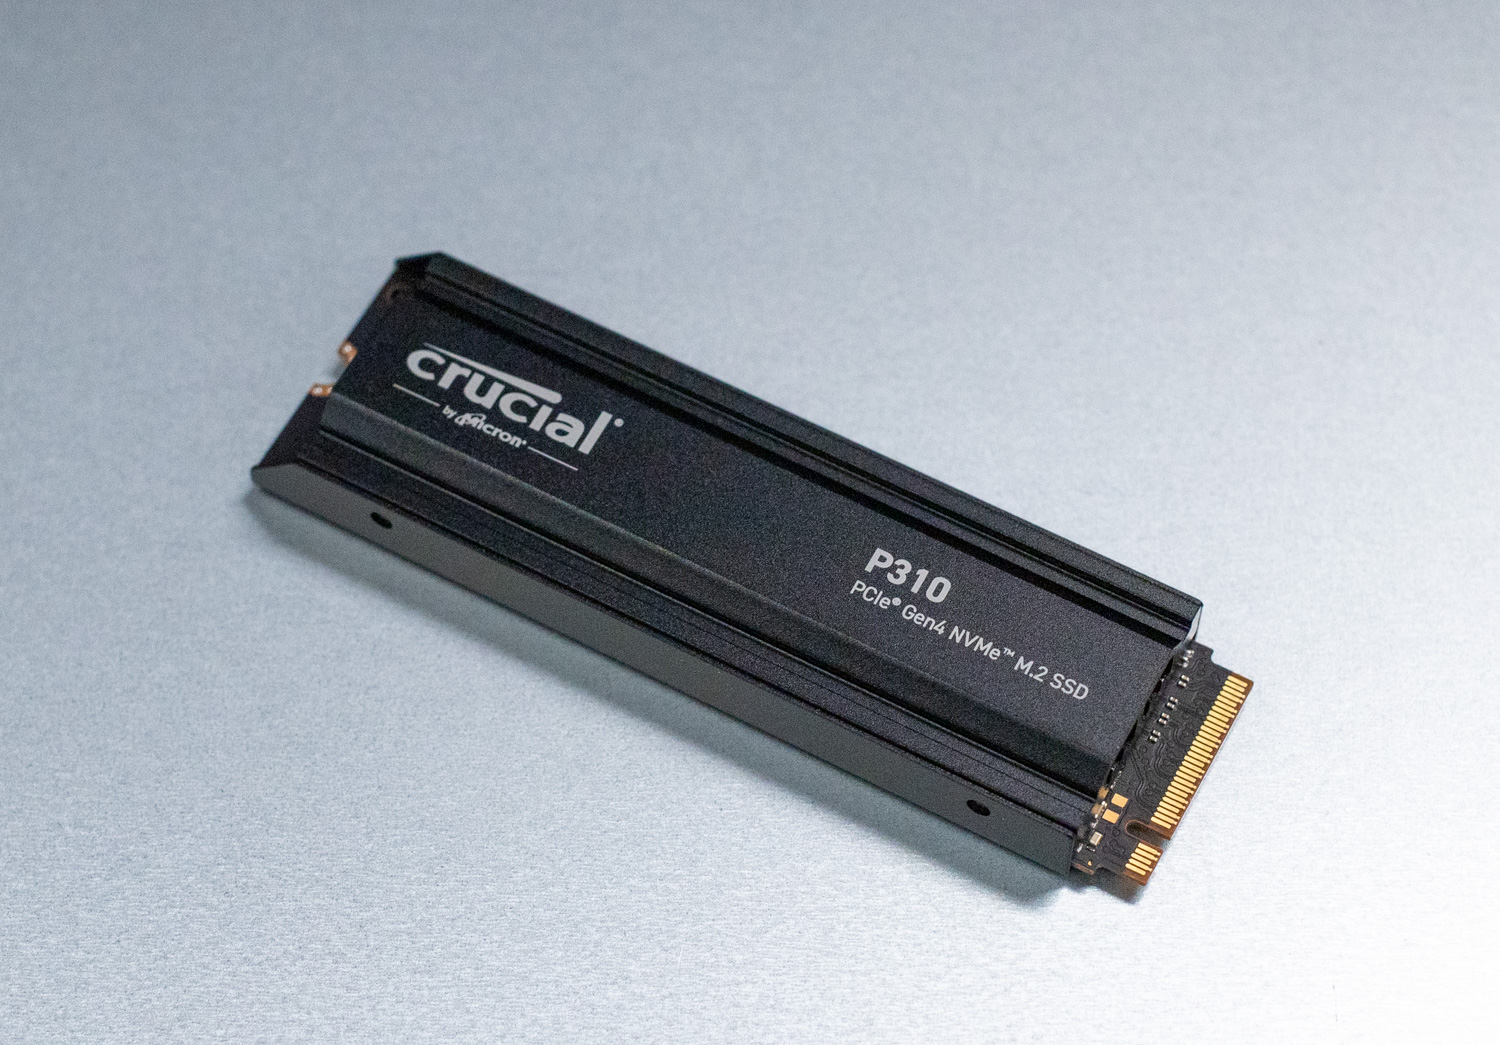
The notable change here is the introduction of an optional heatsink on the 1TB and 2TB models, providing better thermal management for users who push the drive in higher-performance workloads.
To measure the performance of the Crucial P310 SSD, we leveraged our AMD Ryzen 7 consumer test platform. This board supports multiple PCIe Gen5 SSDs, which we leveraged when testing the drive as a secondary storage device to the boot SSD. Our testing approach for this client SSD used a mixture of Windows and Linux-based applications. In this test platform, we also evaluated the Crucial T705 2TB (PCIe Gen5), Samsung 990 Pro 2TB (PCIe Gen4), and WD SN850X 2TB (PCIe Gen4) for a performance comparison.
Here’s the breakdown of the test bench configuration used for benchmarking:
- CPU: AMD Ryzen 7 9800X3D
- Motherboard: Asus ROG Crosshair X870E Hero
- RAM: G.SKILL Trident Z5 Royal Series DDR5-6000 (2x16GB)
- GPU: NVIDIA GeForce RTX 4090
- OS: Windows 11 Pro, Ubuntu 24.10 Desktop
Comparison SSDs
Peak Synthetic Performance
The FIO test is a flexible and powerful benchmarking tool used to measure the performance of storage devices, including SSDs and HDDs. It evaluates metrics such as bandwidth, IOPS (Input/Output Operations Per Second), and latency under different workloads, like sequential and random read/write operations. This test helps to assess the peak performance of storage systems, making it useful for comparing different devices or configurations. We measured the peak burst performance for this test, limiting the workload to a 10GB footprint on all tested SSDs.
The Crucial P310 2TB delivers solid performance, but in the FIO benchmark, it ranks behind higher-end models. It reaches 7,197 MB/s in sequential reads (1.16ms latency) and 6,376 MB/s in sequential writes (1.31ms latency). In random 4K workloads, it achieves 1.163M IOPS in reads (0.44ms latency) and 1.196M IOPS in writes (0.43ms latency).
The Crucial T705 2TB a Gen5 drive leads the pack with nearly double the sequential speeds and significantly higher random write performance at 2.703M IOPS. The Samsung 990 Pro 2TB follows closely, offering strong read and write speeds, while the WD SN850X 2TB lags behind in read performance and random write workloads. While the P310 offers respectable speeds, it trails the top contenders, especially in demanding scenarios.
| FIO Test (higher MB/s/IOPS Is better) | Crucial P310 2TB | Crucial T705 2TB | Samsung 990 Pro 2TB | WD SN850X 2TB |
|---|---|---|---|---|
| Sequential 128K Read (2T/64Q) | 7,197 MB/s (1.16ms avg latency) | 14,400 MB/s (0.58ms avg latency) | 7,483 MB/s (1.12ms avg latency) | 6,632 MB/s (0.76ms avg latency) |
| Sequential 128K Write (2T/64Q) | 6,376 MB/s (1.31ms avg latency) | 12,300 MB/s (0.68ms avg latency) | 7,197 MB/s (1.16ms avg latency) | 7,235 MB/s (0.92ms avg latency) |
| Random 4K Read (16T/32Q) | 1.163M IOPS (0.44ms avg latency) | 1.585M IOPS (0.32ms avg latency) | 1.400M IOPS (0.36ms avg latency) | 1.2M IOPS (0.43ms avg latency) |
| Random 4K Write (16T/32Q) | 1.196M IOPS (0.43ms avg latency) | 2.703M IOPS (0.19ms avg latency) | 1.403M IOPS (0.36ms avg latency) | 825K IOPS (0.62ms avg latency) |
Average LLM Load Time
The Average LLM Load Time test evaluated the load times of three different LLMs: DeepSeek R1 7B, Meta Llama 3.2 11B, and DeepSeek R1 32B. Each model was tested 10 times, and the average load time was then calculated.
The Crucial T705 2TB consistently led the pack, achieving the fastest average load times across all tested models. It completed DeepSeek R1 7B in 2.7884 seconds, Meta Llama 3.2 11B Vision in 4.3654 seconds, and DeepSeek R1 32B in 4.4755 seconds.
The Samsung 990 Pro 2TB followed behind, performing well but showing slightly higher load times. The WD SN850X 2TB lagged in all tests, taking 3.5196 seconds for DeepSeek R1 7B and 5.5226 seconds for DeepSeek R1 32B. The Crucial P310 2TB, while delivering stable results, was the slowest of the group, with DeepSeek R1 7B loading in 3.7451 seconds and DeepSeek R1 32B in 5.8027 seconds. These results indicate that while the P310 can handle LLM workloads, higher-end models provide significantly faster performance.
| Average LLM Load Time (lower is better) | Crucial P310 2TB | Crucial T705 2TB | Samsung 990 Pro 2TB | WD SN850X 2TB |
| DeepSeek R1 7B (average time) | 3.7451s | 2.7884s | 3.2962s | 3.5196s |
| Meta Llama 3.2 11B Vision (average time) | 5.5611s | 4.3654s | 4.9916s | 5.2433s |
| DeepSeek R1 32B (average time) | 5.8027s | 4.4755s | 5.3801s | 5.5226s |
3DMark Direct Storage
The 3DMark DirectStorage Feature Test evaluates how Microsoft’s DirectStorage optimizes game asset loading on PCIe SSDs. By reducing CPU overhead and improving data transfer speeds, DirectStorage enhances loading times, especially when paired with GDeflate compression and Windows 11’s BypassIO. This test isolates storage performance to highlight the potential bandwidth improvements when DirectStorage is enabled.
In the 3DMark DirectStorage Feature Test, the Crucial T705 2TB performed the best in most areas, consistently leading the pack. For Storage to VRAM with GDeflate compression, it reached 25.75 GB/s, setting the bar, while the Crucial P310 2TB came in at only 57.5% of that, at 14.81 GB/s. The Samsung 990 Pro 2TB followed with 14.18 GB/s (55% of the T705), and the WD SN850X 2TB performed slightly better at 15.28 GB/s (59.3%).
When it came to Storage to VRAM with DirectStorage on (uncompressed), the Samsung 990 Pro 2TB edged out the T705, reaching 11.28 GB/s (105.3% of T705), while the Crucial P310 2TB was slightly better than the T705 with 10.75 GB/s (100.4%). The WD SN850X 2TB was close behind at 11.11 GB/s (103.7%).
The Crucial T705 2TB also led in Storage to RAM tests, especially with DirectStorage enabled, at 12.03 GB/s, while the Crucial P310 2TB lagged behind, at 53.7%. In GDeflate decompression bandwidth, the P310 was around 98.6% of the T705’s performance, falling short in overall bandwidth.
Overall, the Crucial T705 2TB outperformed the competition, with the Samsung 990 Pro and WD SN850X providing strong competition and the Crucial P310 2TB trailing in most categories.
| 3DMark Direct Storage (higher is better) | Crucial P310 2TB | Crucial T705 2TB | Samsung 990 Pro 2TB | WD SN850X 2TB |
| Storage to VRAM (GDeflate Compression) | 14.81 GB/s | 25.75 GB/s | 14.18 GB/s | 15.28 GB/s |
| Storage to VRAM (DirectStorage on, Uncompressed) | 10.75 GB/s | 10.71 GB/s | 11.28 GB/s | 11.11 GB/s |
| Storage to VRAM (DirectStorage off, Uncompressed) | 8.56 GB/s | 8.79 GB/s | 8.84 GB/s | 8.93 GB/s |
| Storage to RAM (DirectStorage on, Uncompressed) | 6.46 GB/s | 12.03 GB/s | 6.57 GB/s | 6.78 GB/s |
| Storage to RAM (DirectStorage off, Uncompressed) | 5.87 GB/s | 8.83 GB/s | 6.20 GB/s | 6.27 GB/s |
| GDeflate Decompression Bandwidth | 65.43 GB/s | 66.36 GB/s | 65.71 GB/s | 64.96 GB/s |
Blackmagic Disk Speed Test
The Blackmagic Disk Speed Test benchmarks a drive’s read and write speeds, estimating its performance, especially for video editing tasks. It helps users ensure their storage is fast enough for high-resolution content, like 4K or 8K video.
In Blackmagic Disk Speed test the Crucial T705 2TB led the way. For read speeds, it reached 8,464.2 MB/s, significantly outperforming the Crucial P310 2TB, which achieved 5,282.4 MB/s. The Samsung 990 Pro 2TB came in at 5,769.5 MB/s, slightly ahead of the P310, while the WD SN850X 2TB performed slightly better at 5,862.6 MB/s.
When it came to write speeds, the Crucial T705 2TB again topped the chart with 10,256.4 MB/s, followed by the WD SN850X 2TB at 5,894.8 MB/s. The Samsung 990 Pro 2TB recorded 5,842.9 MB/s, and the Crucial P310 2TB achieved 5,458.9 MB/s.
Overall, the Crucial T705 2TB demonstrated the best performance in both read and write speeds, making it the most suitable choice for high-resolution video editing tasks, while the Crucial P310 2TB lagged behind in both categories.
| Blackmagic Disk Speed (higher is better) | Crucial P310 2TB | Crucial T705 2TB | Samsung 990 Pro 2TB | WD SN850X 2TB |
| Read MB/s | 5,282.4 MB/s | 8,464.2 MB/s | 5,769.5 MB/s | 5,862.6 MB/s |
| Write MB/s | 5,458.9 MB/s | 10,256.4 MB/s | 5,842.9 MB/s | 5,894.8 MB/s |
PCMark10 Storage
PCMark 10 Storage Benchmarks evaluate real-world storage performance using application-based traces. They test system and data drives, measuring bandwidth, access times, and consistency under load. These benchmarks provide practical insights beyond synthetic tests, helping users compare modern storage solutions effectively.
In the PCMark 10 Storage Benchmarks, the Crucial T705 2TB led with an overall score of 8,783. The Crucial P310 2TB scored 6,436, which is 26.7% behind the T705. The Samsung 990 Pro 2TB followed with 7,173, falling 18.3% behind the T705, while the WD SN850X 2TB trailed with 4,988, 43.9% behind the T705’s performance.
The Crucial T705 2TB performed the best, with the Crucial P310 2TB delivering a solid real-world performance but trailing significantly, and the Samsung 990 Pro 2TB being a strong competitor, though still behind the T705. The WD SN850X 2TB finished further behind in this test.
| PCMark 10 Data Drive (higher is better) | Crucial P310 2TB | Crucial T705 2TB | Samsung 990 Pro 2TB | WD SN850X 2TB |
| Overall Score | 6,436 | 8,783 | 7,173 | 4,988 |
3DMark Storage
The 3DMark Storage Benchmark tests your SSD’s gaming performance by measuring tasks like loading games, saving progress, installing game files, and recording gameplay. It evaluates how well your storage handles real-world gaming activities, supporting the latest storage technologies for accurate performance insights.
In the 3DMark Storage Benchmark, the Crucial T705 2TB took the lead with an overall score of 5,100. The Crucial P310 2TB scored 3,848, which is 24.5% behind the T705. The Samsung 990 Pro 2TB followed with 4,128, 19.0% behind the T705, while the WD SN850X 2TB scored 3,962, 22.3% behind the T705.
The Crucial T705 2TB delivered the highest overall score, while the Crucial P310 2TB, Samsung 990 Pro 2TB, and WD SN850X 2TB all trailed behind, with the P310 falling the furthest.
| 3DMark Storage Benchmark (higher is better) | Crucial P310 2TB | Crucial T705 2TB | Samsung 990 Pro 2TB | WD SN850X 2TB |
| Overall Score | 3,848 | 5,100 | 4,128 | 3,962 |
GPU Direct Storage
One of the tests we conducted on this testbench was the Magnum IO GPU Direct Storage (GDS) test. GDS is a feature developed by NVIDIA that allows GPUs to bypass the CPU when accessing data stored on NVMe drives or other high-speed storage devices. Instead of routing data through the CPU and system memory, GDS enables direct communication between the GPU and the storage device, significantly reducing latency and improving data throughput.
How GPU Direct Storage Works
Traditionally, when a GPU processes data stored on an NVMe drive, the data must first travel through the CPU and system memory before reaching the GPU. This process introduces bottlenecks, as the CPU becomes a middleman, adding latency and consuming valuable system resources. GPU Direct Storage eliminates this inefficiency by enabling the GPU to access data directly from the storage device via the PCIe bus. This direct path reduces the overhead associated with data movement, allowing faster and more efficient data transfers.
AI workloads, especially those involving deep learning, are highly data-intensive. Training large neural networks typically requires processing terabytes of data, and any delay in data transfer can lead to underutilized GPUs and longer training times. GPU Direct Storage addresses this challenge by ensuring that data is delivered to the GPU as quickly as possible, minimizing idle time and maximizing computational efficiency.
In addition, GDS is particularly beneficial for workloads that involve streaming large datasets, such as video processing, natural language processing, or real-time inference. By reducing the reliance on the CPU, GDS accelerates data movement and frees up CPU resources for other tasks, further enhancing overall system performance.
Testing Configuration Matrix
We systematically tested every combination of the following parameters:
- Block Sizes: 1M, 128K, 16K
- IODepth: 128, 64, 32, 16, 8, 4, 1
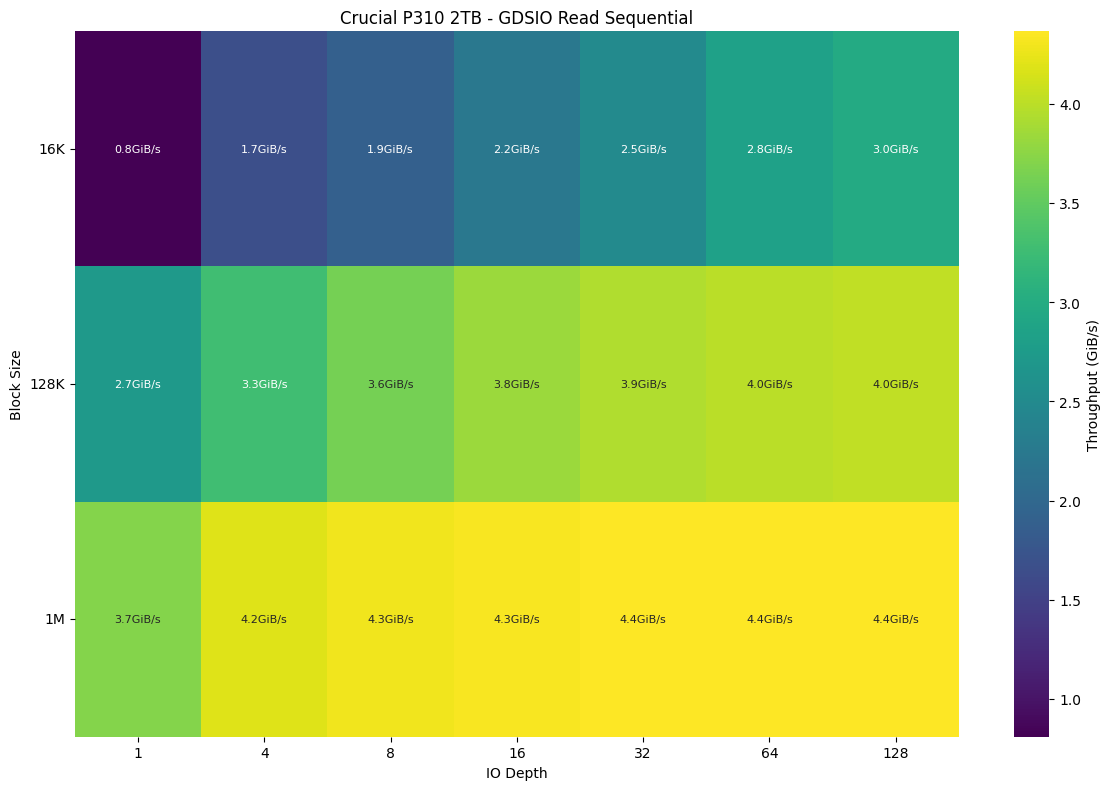
This first heatmap represents the sequential read performance of the Crucial P310 2TB SSD using GDSIO benchmarking. The x-axis shows the I/O depth (queue depth), while the y-axis represents different block sizes (16K, 128K, and 1M). The color gradient and embedded values indicate throughput in GiB/s. The results show that as block size increases, throughput improves significantly. With smaller blocks (16K), the SSD struggles to exceed 3 GiB/s, whereas at 1M, performance reaches 4.4 GiB/s at higher queue depths. This suggests the drive is optimized for large-block sequential reads, benefiting high-throughput workloads like media streaming or backups.
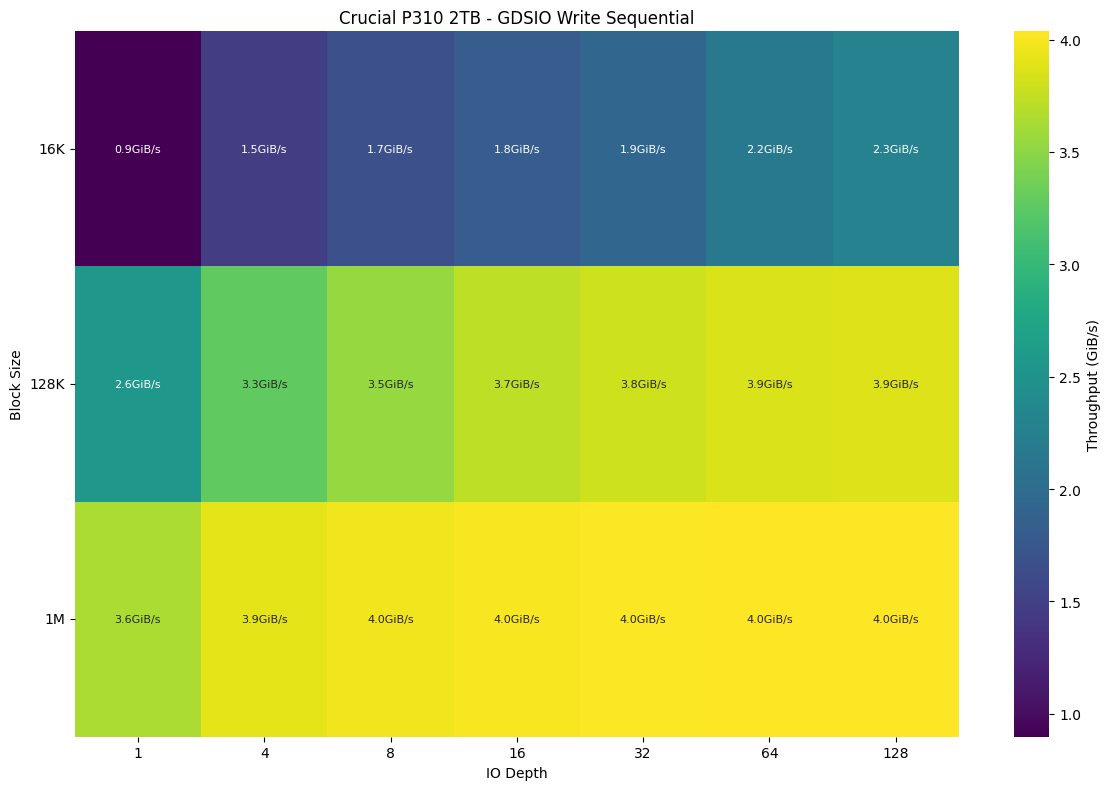
 The next chart illustrates the sequential write performance of the Crucial P310 2TB SSD under varying I/O depths and block sizes. Similar to the read test, performance scales with block size. At 16K, throughput starts at 0.9 GiB/s and improves to 2.3 GiB/s, while at 1M, it reaches a stable 4.0 GiB/s beyond a queue depth of 8. The results indicate that while write speeds are slightly lower than read speeds, the drive performs efficiently with larger sequential writes, making it suitable for write-heavy tasks like video recording or database logging.
 GDSIO Table Breakdown
In 16K reads, the Crucial P310 leads at 3.0 GiB/s, just 3.3% ahead of the T705. The WD SN850X trails by 23.3%, while the Samsung 990 Pro follows at 33.3% behind. For 16K writes, the T705 comes out on top at 2.4 GiB/s, with the P310 close behind at 4.2% slower. The 990 Pro lags 29.1%, and the SN850X is 58.3% slower than the leader.
In 128K reads, the T705 dominates at 5.2 GiB/s, 29% ahead of the P310. The SN850X remains competitive at 21.1% behind, while the 990 Pro is 28.8% slower than the leader. 128K writes favor the P310 and SN850X (3.9 GiB/s), outperforming the T705 (2.9 GiB/s, 25.6% behind). The 990 Pro places last, 59% behind the top performer.
For 1M reads/writes, the T705 leads (6.0 GiB/s read, 5.9 GiB/s write), 36.3% and 47.5% faster than the P310, respectively. The SN850X and Samsung 990 Pro hold close to each other, staying within 8% of each other in both read and write speeds. While the T705 sets the performance bar, the SN850X and 990 Pro remain solid contenders, maintaining strong consistency across large block sizes.
| GDSIO Chart (16K,128K,1M Block Size Averages) | Crucial P310 2TB | Crucial T705 2TB | Samsung 990 Pro 2TB | WD SN850X 2TB |
|---|---|---|---|---|
| (16K Block Size 128 IO Depth) Average Read | 3.0 GiB/s (0.653ms) IOPS: 194.9K | 2.9 GiB/s (0.659ms) IOPS: 193.1K | 2.0 GiB/s (0.974ms) IOPS: 130.9K | 2.3 GiB/s (0.857ms) IOPS: 148.7K |
| (16K Block Size 128 IO Depth) Average Write | 2.3 GiB/s (0.854ms) IOPS: 149.3K | 2.4 GiB/s (0.826ms) IOPS: 154.4K | 1.7 GiB/s (1.165ms) IOPS: 109.5K | 1.0 GiB/s (1.940ms) IOPS: 65.9K |
| (128K Block Size 128 IO Depth) Average Read | 4.0 GiB/s (3.884ms) IOPS: 32.9K | 5.2 GiB/s (3.020ms) IOPS: 42.3K | 3.7 GiB/s (4.186ms) IOPS: 30.6K | 4.1 GiB/s (3.836ms) IOPS: 33.3K |
| (128K Block Size 128 IO Depth) Average Write | 3.9 GiB/s (4.038ms) IOPS: 31.7K | 2.9 GiB/s (5.410ms) IOPS: 23.6K | 1.6 GiB/s (9.879ms) IOPS: 13.0K | 3.9 GiB/s (3.958ms) IOPS: 32.3K |
| (1M Block Size 128 IO Depth) Average Read | 4.4 GiB/s (28.634ms) IOPS: 4.5K | 6.0 GiB/s (20.699ms) IOPS: 6.2K | 4.0 GiB/s (30.960ms) IOPS: 4.1K | 4.3 GiB/s (28.775ms) IOPS: 4.4K |
| (1M Block Size 128 IO Depth) Average Write | 4.0 GiB/s (30.964ms) IOPS: 4.1K | 5.9 GiB/s (21.335ms) IOPS: 6.0K | 4.2 GiB/s (29.564ms) IOPS: 4.3K | 4.1 GiB/s (30.782ms) IOPS: 4.2K |
Conclusion
In conclusion, the Crucial P310 2TB NVMe SSD with heatsink delivers solid performance at its price, making it a compelling choice for users upgrading from SATA SSDs or older Gen3 NVMe drives. While it doesn’t compete with flagship models like the Crucial T705 or Samsung 990 Pro, it offers reliable performance for general workloads, gaming, and content creation at an affordable cost.

The P310’s optional heatsink is a welcome addition, improving thermal efficiency under load. Its single-sided design also ensures compatibility with a wide range of devices, including thinner laptops and compact desktops. However, its reliance on QLC NAND and a DRAM-less controller means that performance may degrade under sustained heavy workloads compared to TLC-based competitors.
At $137.99 for the 2TB model, the Crucial P310 is a budget-friendly, high-capacity option that balances affordability and performance. While power users and professionals working with high-intensity applications might prefer faster alternatives, casual users and those looking for a cost-effective upgrade will find the P310 to be a worthwhile investment.
Engage with StorageReview
Newsletter | YouTube | Podcast iTunes/Spotify | Instagram | Twitter | TikTok | RSS Feed