
Affordable Blackwell power: We review the PNY GeForce RTX 5060 Ti, which offers DLSS 4, GDDR7, and AI gains for gaming and creative tasks.
In the lab, we’ve had the opportunity to thoroughly review almost the entire lineup of NVIDIA’s new Blackwell 50-Series cards, ranging from the flagship GeForce RTX 5090 to the RTX 5070. Now, NVIDIA has introduced this series’s latest and more affordable members: the GeForce RTX 5060 and GeForce RTX 5060 Ti.
We received the GeForce RTX 5060 Ti for review, specifically a PNY card variant. This model features 16GB of next-gen GDDR7 video memory. An 8GB version of the RTX 5060 Ti will also be available at launch for budget-conscious gamers. These graphics cards target gamers using older generation GPUs, particularly those upgrading from a GeForce RTX 3060 or lower, and aim almost to double the frame rates for 1440p gaming.
NVIDIA GeForce RTX 5060 Ti Architecture
Leveraging the newest PCIe standard Gen5 x16 interface, the PNY GeForce RTX 5060 Ti features 4,608 CUDA cores, with a base clock of 2.41 GHz and a boost clock up to 2.57 GHz. This results in 29.15 TFLOPS of FP32 compute performance—nearly double the 16.2 TFLOPS of the GeForce RTX 3060. The 4th-gen ray tracing cores deliver up to 72 TFLOPS of RT performance, enhancing real-time reflections, global illumination, and path tracing support. Meanwhile, the 5th-gen Tensor cores provide 759 AI TOPS, significantly improving AI-powered upscaling, frame generation, and complex computational workloads.
Compared to the GeForce RTX 4060 Ti, NVIDIA claims the PNY RTX 5060 Ti offers up to a 2.1× improvement in 3D rendering with DLSS 4 and Multi Frame Generation, along with a 20% boost in traditional rasterization performance. The leap is even more dramatic for those upgrading from the RTX 3060 Ti, with performance gains of over 5× when using DLSS 4.
One of the most notable hardware upgrades is the move to GDDR7 memory. While the PNY GeForce RTX 5060 Ti retains 16GB of VRAM, it transitions from GDDR6X to next-gen GDDR7 on a 128-bit bus, delivering a memory bandwidth of 448 GB/s. This translates to faster texture streaming, smoother 4K gameplay, and improved handling of large datasets in creative workloads.
DLSS 4 and AI-Powered Features
DLSS 4 support has been one of the biggest draws of the RTX 50 series. It introduces Multi Frame Generation, a new AI-powered technique that creates multiple frames per rendered frame, significantly boosting FPS in supported games. DLSS 4 enhances Ray Reconstruction and Super Resolution, improving image clarity and stability, especially during fast motion or high-action sequences.
One of the most exciting developments is the integration of DLSS 4 with Reflex+, NVIDIA’s latency reduction technology. When paired together, DLSS 4 increases frame rates and lowers system latency, making gameplay feel more responsive—a key advantage for competitive players. Additionally, the 5th-gen Tensor cores supercharge AI processing, efficiently handling complex denoising tasks and inference workloads.
Since launch, DLSS 4 has been in over 100+ games and titles, including newer games like Avowed and Kingdom Come Deliverance II, and older releases like the massively popular Red Dead Redemption II and Microsoft Flight Simulator. Thanks to the new RT cores and AI-assisted denoising techniques, games that leverage ray tracing and path tracing will likely see a noticeable boost in visual fidelity without compromising performance.
Beyond gaming, these AI advancements also spill into creative and productivity workloads. Apps like Topaz Video AI, DaVinci Resolve, and Adobe Premiere Pro now tap into DLSS-related tech for smoother Timeline scrubbing, faster video upscaling, and real-time effects rendering. With 759 AI TOPS at its disposal, the PNY RTX GeForce 5060 Ti brings a level of acceleration to mainstream users that was once reserved for high-end GPUs.
NVIDIA GeForce RTX 5060 Ti Specifications & Comparison
Below is a specification comparison of the NVIDIA GeForce RTX 5060 Ti against its predecessors: the GeForce RTX 4060 Ti, GeForce RTX 3060 Ti, and GeForce RTX 2060. This comparison highlights how the GeForce RTX 5060 Ti stacks up against previous-generation cards that many users may own.
| GPU Comparison | NVIDIA GeForce RTX 5060 Ti | NVIDIA GeForce RTX 4060 Ti | NVIDIA GeForce RTX 3060 Ti | NVIDIA GeForce RTX 2060 |
| GPU Name | GB206 | AD106-350-A1 | GA104 | TU106 |
| Architecture | Blackwell 2.0 | Ada lovelace | Ampere | Turing |
| Process Size | 5 nm | 5 nm | 8 nm | 12 nm |
| Transistors | 21,900 million | 22,900 million | 17,400 million | 10,800 million |
| Density | 121.0M / mm² | 121.8M / mm² | 44.4M / mm² | 24.3M / mm² |
| Die Size | 181 mm² | 188 mm² | 392 mm² | 445 mm² |
| Slot Width | Dual-slot | Dual-slot | Dual-slot | Dual-slot |
| Dimensions | 245 mm × 120 mm × 40 mm | 240 mm x 111 mm x 40 mm | 242 x 112 | 229 mm x 113 mm x 35 mm |
| TDP | 180 W | 160 W | 200 W | 184 W |
| Video Connections | 1x HDMI 2.1b 3x DisplayPort 2.1b |
1x HDMI 2.1 3x DisplayPort 1.4a |
1x HDMI 2.1 3x DisplayPort 1.4a |
1x HDMI 2.1b, 3x DisplayPort 2.1b |
| Power Connectors | 1x 16-pin | 1x 16-pin | 1x 12-pin | 1x 16-pin |
| Bus Interface | PCIe 5.0 x16 | PCIe 4.0 x16 | PCIe 4.0 x16 | PCIe 5.0 x16 |
| Base Clock | 2407 MHz | 2310 MHz | 1410 MHz | 1470 MHz |
| Boost Clock | 2572 MHz | 2535 MHz | 1665 MHz | 1650 MHz |
| Memory Clock | 1750 MHz 28 Gbps effective |
2250 MHz 18 Gbps effective |
1750 MHz 14 Gbps effective |
1750 MHz 14 Gbps effective |
| Memory Size | 8 or 16 GB | 16 or 8 GB | 8 GB | 12 GB |
| Memory Type | GDDR7 | GDDR6 | GDDR6 | GDDR6 |
| Memory Bus | 128 bit | 128 bit | 256 bit | 192 bit |
| Memory Bandwidth | 448.0 GB/s | 288.0 GB/s | 448.0 GB/s | 336.0 GB/s |
| CUDA Cores | 4608 | 4352 | 4864 | 2176 |
| TMUs | 144 | 136 | 152 | 136 |
| ROPs | 48 | 48 | 80 | 48 |
| SM Count | 36 | 34 | 38 | 34 |
| Tensor Cores | 144 | 136 | 152 | 272 |
| RT Cores | 36 | 34 | 38 | 34 |
| L1 Cache | 128 KB (per SM) | 128 KB (per SM) | 128 KB (per SM) | 128 KB (per SM) |
| L2 Cache | 36 MB | 32 MB | 4 MB | 64 MB |
| Pixel Rate | 158.4 GPixel/s | 121.7 GPixel/s | 133.2 GPixel/s | 79.20 GPixel/s |
| Texture Rate | 455.4 GTexel/s | 344.8 GTexel/s | 253.1 GTexel/s | 224.4 GTexel/s |
| FP16 (half) | 29.15 TFLOPS (1:1) | 22.06 TFLOPS (1:1) | 16.20 TFLOPS (1:1) | 14.36 TFLOPS (2:1) |
| FP32 (float) | 29.15 TFLOPS | 22.06 TFLOPS | 16.20 TFLOPS | 7.181 TFLOPS |
| FP64 (double) | 455.4 GFLOPS (1:64) | 344.8 GFLOPS (1:64) | 253.1 GFLOPS (1:64) | 224.4 GFLOPS (1:32) |
| Launch Price (USD) | $379/$429 | $499/$399 | $399 | N/A |
Build & Design – PNY GeForce NVIDIA RTX 5060 Ti
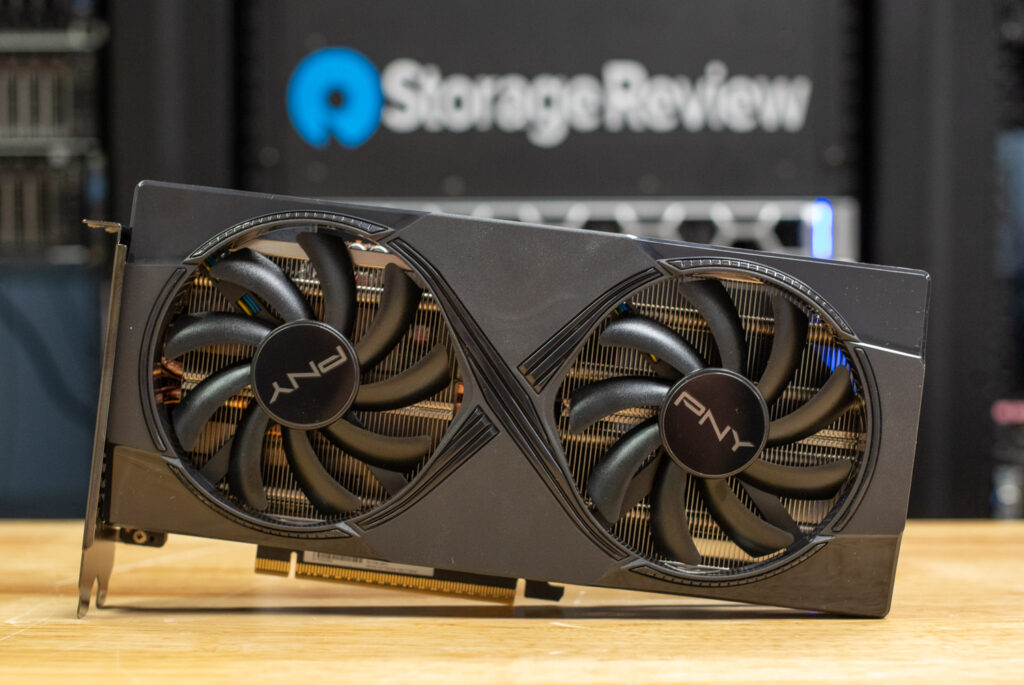
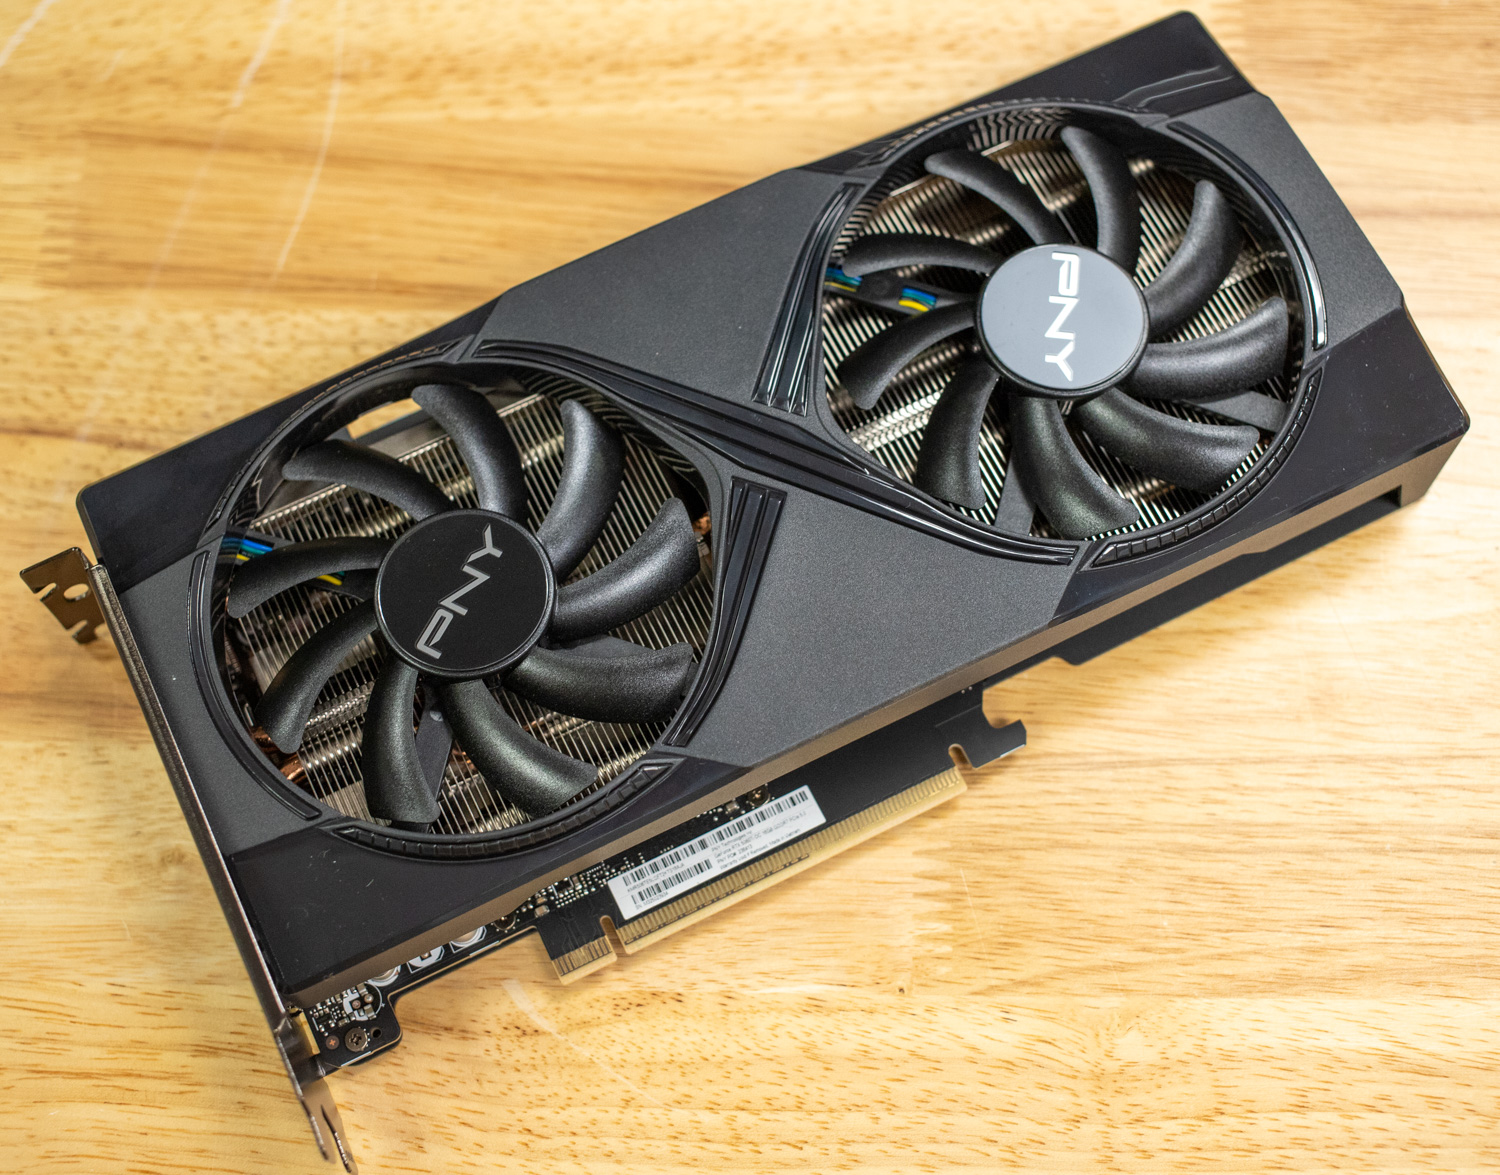
The PNY GeForce RTX 5060 Ti features a dual-slot design, with physical dimensions roughly matching those of the GeForce RTX 5070 Founders Edition. While the cooler spans the full length of the card, the actual PCB takes up only half of that space, leaving the rest dedicated to a sizable heatsink and dual-fan cooling system to manage the 180W TDP.
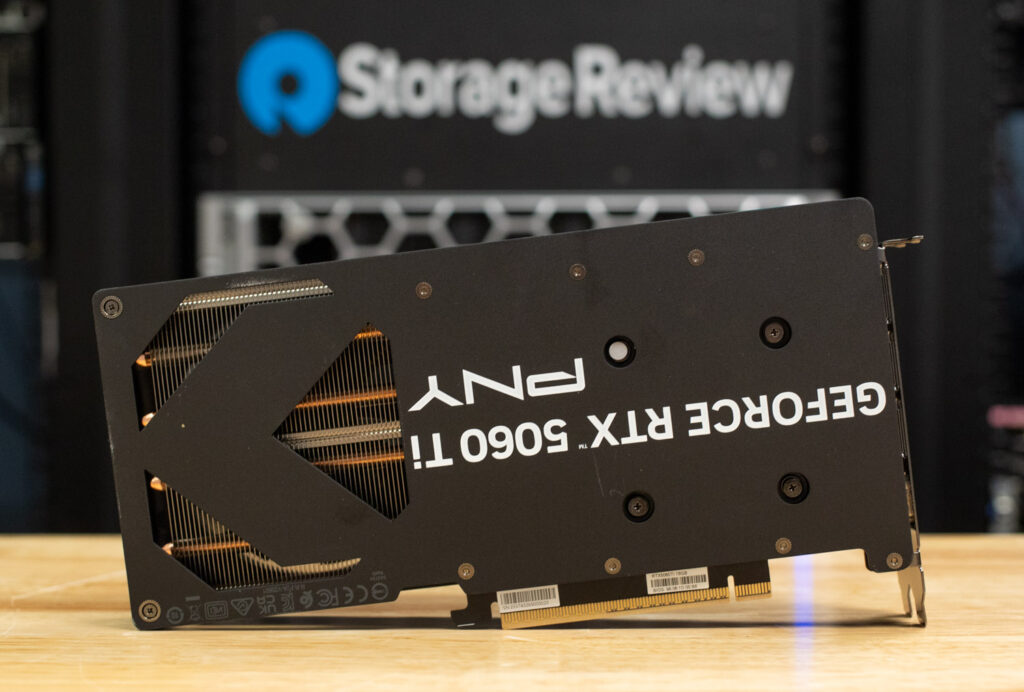
This shorter PCB makes it especially appealing for compact water-cooling builds, giving modders more room for front-mounted radiators, reservoir placement, or custom loop tubing. Even in standard air-cooled setups, the design offers flexibility for tighter mid-tower cases. PNY’s cooler runs quietly under load and includes a full-length metal backplate with added venting that adds rigidity without adding unnecessary bulk. While it may not be a flashy design, it does the job efficiently.
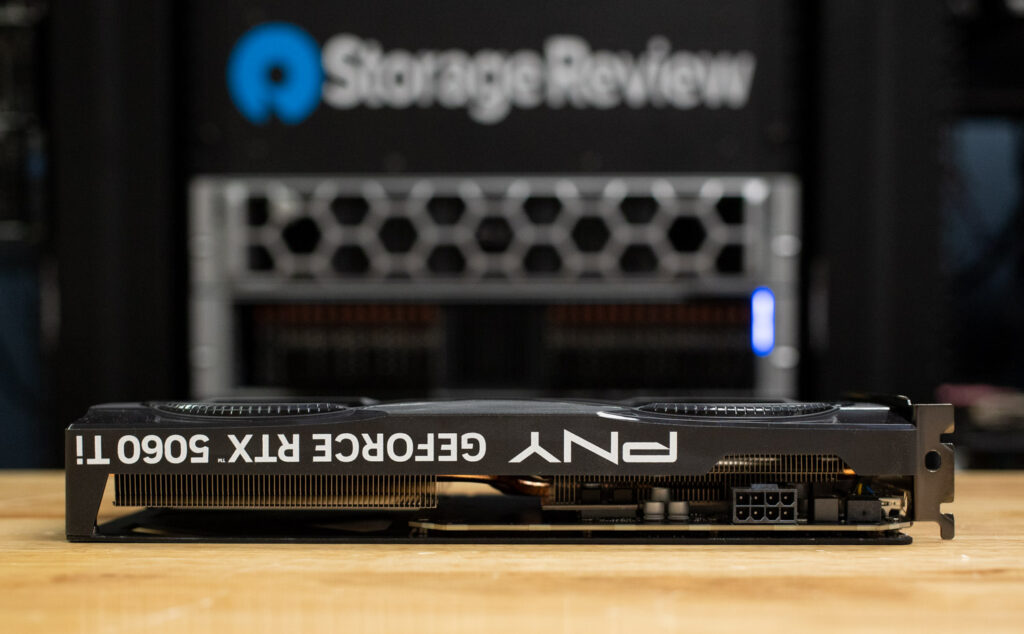
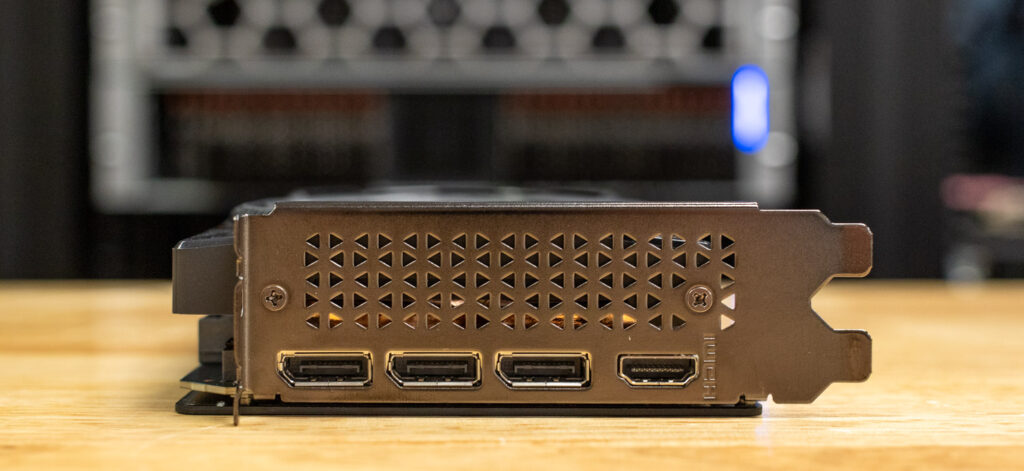
The card draws power through a single 8-pin PCIe connector, which helps keep things simple for upgraders. This standard connector choice reflects the card’s efficient power design and makes it especially appealing for users with older or lower-wattage PSUs. It’s a stress-free upgrade for those coming from midrange cards, where replacing the power supply might otherwise be a limiting factor, particularly in compact or prebuilt systems. The card includes a metal dual-slot PCIe backplate for durability with 1x HDMI 2.1b and 3x DisplayPort 2.1b outputs, supporting a wide array of modern monitors.
StorageReview AMD Threadripper Test Platform
The test platform we used for our RTX 5060 Ti testing included:
-
- Motherboard: ASUS Pro WS TRX50-SAGE WIFI
- CPU: AMD Ryzen Threadripper 7980X 64-Core
- RAM: 64GB DDR5 4800MT/s
- Storage: 2TB Samsung 980 Pro
- OS: Windows 11 Pro for Workstations
- Driver: NVIDIA 571.86 GameReady Driver
The AMD Ryzen Threadripper 7980X sits at the core of our test system, with 64 cores and extensive multi-threading capabilities. This ensures CPU limitations don’t interfere with GPU-focused benchmarks, especially in AI processing, ray tracing, and high-resolution rendering, where workloads are heavily offloaded to the GPU.
We paired the 7980X with the ASUS Pro WS TRX50-SAGE WIFI motherboard to deliver ample PCIe bandwidth, ensuring the GPU can achieve its full potential without bottlenecks. Our system also includes 128GB of DDR5 memory at 4800MT/s, providing enough headroom for smooth operation when handling large datasets. Although the Samsung 980 Pro is a slightly older Gen4 SSD, it still delivers fast read/write speeds, keeping load times minimal and preventing data-heavy tasks like AI model inference or texture streaming from being hindered by storage performance.
In our previous benchmarking, we haven’t focused on many of NVIDIA’s lower-end xx60-series cards, but with the arrival of the PNY GeForce RTX 5060 Ti, that’s changing. To get a clear picture of where this new GPU stands, we compare it against a selection of higher-tier cards we’ve already tested, including the GeForce RTX 5070 and GeForce RTX 4070. This gives us a solid performance and efficiency context across the last generation and a tier above.
- NVIDIA RTX 5070 (12GB GDDR7)
- NVIDIA RTX 4070 (12GB GDDR6X)
Benchmarking Tests
First up in our gauntlet of tests is the Procyon AI Text Generation Benchmark. This benchmark simplifies AI LLM performance testing by offering a compact and consistent evaluation method. It allows for repeated testing across multiple LLM models while minimizing the complexity of large model sizes and variable factors. Developed with AI hardware leaders, this benchmark optimizes the use of local AI accelerators for more reliable and efficient performance assessments. The results measured below were tested using TensorRT.
In the Procyon AI Text Generation test, the PNY GeForce RTX 5060 Ti holds its own despite being the most modestly spec’ed card in the group, with 4,608 CUDA cores and a 128-bit memory bus—compared to the RTX 5070’s 6,144 cores and 192-bit bus, and the RTX 4070’s 5,888 cores on the same 192-bit width. The 5060 Ti posted Phi and Mistral scores of 2,870 and 2,807, with output token rates of 120.7 tokens/s and 91.0 tokens/s, respectively—noticeably behind the 5070’s 150.4 tokens/s and 120.5 tokens/s, and the 4070’s 141.6 tokens/s and 99.6 tokens/s. This trend continues in Llama3 and Llama2, where the 5060 Ti trails in throughput and duration: 74.7 tokens/s and 39.4s overall in Llama3, and 41.3 tokens/s and 71.3s in Llama2. While the gap widens under heavier models, the 5060 Ti holds up well for its class. It offers compelling value for users seeking basic local AI acceleration without entering higher-tier pricing.
| UL Procyon: AI Text Generation | PNY Nvidia GeForce RTX 5060 Ti | NVIDIA GeForce RTX 5070 | NVIDIA GeForce RTX 4070 |
| Phi Overall Score | 2,870 | 3,453 | 3,191 |
| Phi Output Time To First Token | 0.375 s | 0.323 s | 0.356 s |
| Phi Output Tokens Per Second | 120.733 tokens/s | 150.435 tokens/s | 141.575 tokens/s |
| Phi Overall Duration | 25.216 s | 20.302 s | 21.743 s |
| Mistral Overall Score | 2,807 | 3,562 | 2,987 |
| Mistral Output Time To First Token | 0.526 s | 0.433 s | 0.508 s |
| Mistral Output Tokens Per Second | 91.057 tokens/s | 120.507 tokens/s | 99.590 tokens/s |
| Mistral Overall Duration | 33.377 s | 25.496 s | 30.651 s |
| Llama3 Overall Score | 2,599 | 3,125 | 2,810 |
| Llama3 Output Time To First Token | 0.449 s | 0.379 s | 0.423 s |
| Llama3 Output Tokens Per Second | 74.709 tokens/s | 100.388 tokens/s | 82.130 tokens/s |
| Llama3 Overall Duration | 39.489 s | 29.720 s | 36.147 s |
| Llama2 Overall Score | 2,576 | 3,125 | 2,658 |
| Llama2 Output Time To First Token | 0.844 s | 0.785 s | 0.947 s |
| Llama2 Output Tokens Per Second | 41.386 tokens/s | 56.647 tokens/s | 49.487 tokens/s |
| Llama2 Overall Duration | 71.302 s | 53.234 s | 61.300 s |
UL Procyon: AI Image Generation
The Procyon AI Image Generation Benchmark consistently and accurately measures AI inference performance across various hardware, from low-power NPUs to high-end GPUs. It includes three tests: Stable Diffusion XL (FP16) for high-end GPUs, Stable Diffusion 1.5 (FP16) for moderately powerful GPUs, and Stable Diffusion 1.5 (INT8) for low-power devices. The benchmark uses the optimal inference engine for each system, ensuring fair and comparable results.
In the Procyon AI Image Generation benchmark, the PNY GeForce RTX 5060 Ti again shows respectable results for its class. The Stable Diffusion 1.5 FP16 test scored 2,110, noticeably behind the GeForce RTX 5070’s 2,937 and the 4070’s 2,400. Its average image generation time of 2.97 seconds lands it behind the 5070 at 2.13 seconds and the 4070 at 2.60 seconds. The INT8 variant of the same model also follows suit, scoring 27,705 compared to 36,320 (5070) and 31,048 (4070). It clocked 1.13 seconds per image in this lower-precision test, again slower than its peers. In Stable Diffusion XL (FP16), the gap widens a bit more—1,837 for the 5060 Ti vs. 2,473 and 1,940 for the 5070 and 4070, respectively, with an image generation speed of 20.4 seconds per image.
| UL Procyon: AI Image Generation (overall score: higher is better) | PNY NVIDIA GeForce RTX 5060 Ti | NVIDIA GeForce RTX 5070 | NVIDIA GeForce RTX 4070 |
| Stable Diffusion 1.5 (FP16) — Overall Score | 2,110 | 2,937 | 2,400 |
| Stable Diffusion 1.5 (FP16) — Overall Time | 47.590 s | 34.038 s | 41.661 s |
| Stable Diffusion 1.5 (FP16) — Image Generation Speed | 2.974 s/image | 2.127 s/image | 2.604 s/image |
| Stable Diffusion 1.5 (INT8) — Overall Score | 27,705 | 36,320 | 31,048 |
| Stable Diffusion 1.5 (INT8) — Overall Time | 9.024 s | 6.883 s | 8.052 s |
| Stable Diffusion 1.5 (INT8) — Image Generation Speed | 1.128 s/image | 0.860 s/image | 1.006 s/image |
| Stable Diffusion XL (FP16) — Overall Score | 1,837 | 2,473 | 1,940 |
| Stable Diffusion XL (FP16) — Overall Time | 326.550 s | 242.606s | 309.269s |
| Stable Diffusion XL (FP16) — Image Generation Speed | 20.409 s/image | 15.163 s/image | 19.329 s/image |
Luxmark
Luxmark is a GPU benchmark that uses LuxRender, an open-source ray tracing renderer, to evaluate a system’s performance in handling highly detailed 3D scenes. This benchmark is pertinent for assessing the graphical rendering prowess of servers and workstations, especially for visual effects and architectural visualization applications, where accurate light simulation is critical.
In the LuxMark benchmark, the PNY GeForce RTX 5060 Ti turned in respectable scores given its more modest specs, landing at 6,590 in the “Food” scene and 15,348 in the more demanding “Hall” test. It trails behind the GeForce RTX 5070 and 4070, which benefit from higher core counts and larger memory buses.
| Luxmark (higher is better) | PNY NVIDIA GeForce RTX 5060 Ti | NVIDIA GeForce RTX 5070 | NVIDIA GeForce RTX 4070 |
| Food Score | 6,590 | 9,061 | 7,535 |
| Hall Score | 15,348 | 22,062 | 20,003 |
Geekbench 6
Geekbench 6 is a cross-platform benchmark that measures overall system performance. The Geekbench Browser allows you to compare any system to it.
In Geekbench 6’s GPU OpenCL test, the PNY GeForce RTX 5060 Ti scored 150,743, placing it behind the RTX 5070 and 4070, which came in at 188,892 and 174,725, respectively. While it doesn’t lead the pack, the 5060 Ti still holds its own, offering solid compute performance for everyday GPU-accelerated tasks across various applications.
| Geekbench (higher is better) | PNY NVIDIA GeForce RTX 5060 Ti | NVIDIA GeForce RTX 5070 | NVIDIA GeForce RTX 4070 |
| GPU OpenCL Score | 150,743 | 188,892 | 174,725 |
V-Ray
The V-Ray Benchmark measures rendering performance for CPUs, NVIDIA GPUs, or both using advanced V-Ray 6 engines. It uses quick tests and a simple scoring system to let users evaluate and compare their systems’ rendering capabilities. It’s an essential tool for professionals seeking efficient performance insights.
In the V-Ray Benchmark, which evaluates GPU rendering performance using the V-Ray 6 engine, the RTX 5060 Ti delivered a score of 4,457 — shy of the 4070’s 4,469 and notably behind the 5070’s 6,553. Despite its lower-tier positioning, the 5060 Ti still keeps pace with the 4070 in this workload, offering decent rendering capabilities for creative professionals on a Tighter budget.
| V-Ray (higher is better) | PNY NVIDIA GeForce RTX 5060 Ti | NVIDIA GeForce RTX 5070 | NVIDIA GeForce RTX 4070 |
| vpaths | 4,457 | 6,553 | 4,469 |
3D Mark
3DMark Port Royal, Speedway, and Steel Nomad are GPU benchmarks that test performance in different scenarios. Port Royal focuses on ray tracing, Speed Way evaluates performance in racing simulations, and Steel Nomad challenges GPUs with high-intensity, realistic graphics. They assess GPU capabilities in rendering, lighting, and dynamic scenes.
In the 3DMark benchmarks, the PNY GeForce RTX 5060 Ti showed competitive performance across all tests. In Port Royal, it scored 10,432, trailing the 5070 (14,026) and ahead of the 4070 (11,074). In the Speed Way test, the 5060 Ti achieved 4,184, the 5070 led with 5,869, and the 4070 scored 4,477. For Steel Nomad, the 5060 Ti recorded 3,611, again outpaced by the 5070 (5,019) but slightly ahead of the 4070 (3,748). The 5060 Ti holds its ground in these high-intensity GPU tests, making it a solid choice for gamers and creators who do not need the absolute top-tier performance but still want great value.
| 3DMark Test (higher is better) | PNY NVIDIA GeForce RTX 5060 Ti | NVIDIA GeForce RTX 5070 | NVIDIA GeForce RTX 4070 |
| Port Royal | 10,432 | 14,026 | 11,074 |
| Speed Way | 4,184 | 5,869 | 4,477 |
| Steel Nomad | 3,611 | 5,019 | 3,748 |
NVIDIA GeForce RTX 5070 Founders Power Efficiency Results
We’ve been using the Procyon AI Image test as a benchmark to measure the power consumption. We leverage our Quarch Mains Analyzer in our test bench to measure power drawn from the NVIDIA GPUs. Running the Stable Diffusion XL FP16 test, we look at the interval of the 2nd-to-last image being generated. We measure the time from the start to finish of that interval, peak power consumed, average high draw, and idle power after the test completes.
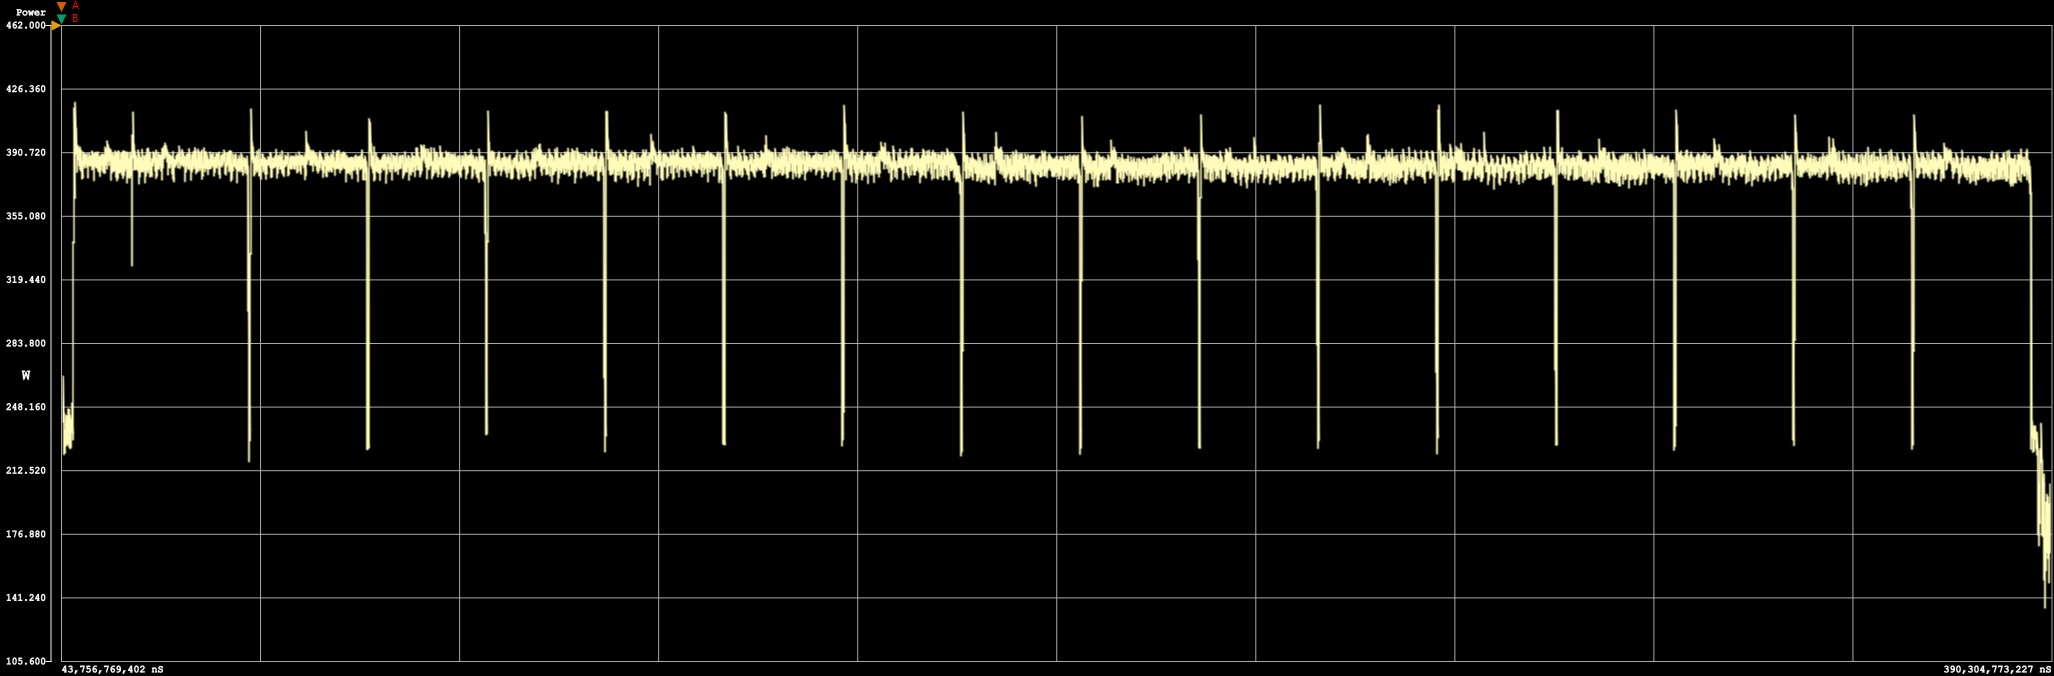
Our testing showed an average consumption of 385W under sustained workloads, with peaks hitting 419W and idle draw at 151W. The PNY NVIDIA GeForce RTX 5060 Ti has a listed power rating of 180W. The card completed our 20.2-second test cycle with 2.13 Wh of total energy used during the duration of this test.
| Stable Diffusion XL FP16 Image Power Used (lower is better) | PNY NVIDIA GeForce RTX 5060 Ti | NVIDIA GeForce RTX 5070 | ASUS Prime NVIDIA GeForce RTX 5070 Ti | NVIDIA GeForce RTX 5080 | NVIDIA GeForce RTX 5090 |
| Power Consumed | 2.13 Wh | 2.46Wh | 1.66Wh | 1.39Wh | 1.16Wh |
| Test DuraTion | 20.2 s | 19.2 s | 11.1 s | 8.7 s | 5.1 s |
Conclusion
The GeForce RTX 5060 Ti series enters the market at an affordable $379- 429, offering users a gateway into NVIDIA’s Blackwell 2.0 architecture without the next-gen price tag of flagship models. For users seeking more memory, options like the PNY RTX 5060 Ti with 16GB of GDDR7 address a key limitation seen in prior midrange GPUs, unlocking more headroom for multitasking, AI-enhanced tools, and heavier game assets. While not an AI workhorse like the previously reviewed GeForce RTX 5090 or GeForce RTX 5080, it still supports next-gen features like DLSS 4 and improved ray tracing, bringing premium-level capabilities to a more mainstream audience.
Regarding gaming performance, the GeForce RTX 5060 Ti delivers impressive gains, offering up to a 5x boost over the GeForce RTX 3060 Ti in supported workloads. It’s a strong performer for 1440p gaming, capable of handling modern Titles with high settings and smooth frame rates. This makes it an ideal upgrade for users coming from older cards like the GeForce RTX 3060 Ti or GeForce RTX 2060 Super, especially for those who want to take advantage of the latest Blackwell features without overhauling their entire system.
With its compact dual-slot design, efficient power draw, and accessible pricing, the GeForce RTX 5060 Ti series stands out as a practical and forward-looking upgrade. It brings next-gen NVIDIA Blackwell features to a broader audience without the premium typically attached to high-end cards.
RTX 5060 Ti at Amazon (affiliate link)
Engage with StorageReview
Newsletter | YouTube | Podcast iTunes/Spotify | Instagram | Twitter | TikTok | RSS Feed