 After going through standard retail channels, we’ve managed to get our hands on two brand new 60GB OCZ Vertex 2’s. The first is a latest-generation 60GB 25nm NAND model, the second an older stock 34nm NAND version. Buyers can’t tell the difference thanks to OCZ’s dubious marketing, but we can, and in this mini-review we’ll dive deeper into the available capacity differences of the two SSDs as well as the performance differences. Anyone buying OCZ’s current line of SSDs needs to be aware of what they’re buying – and what they’re buying today is most certainly different than what has earned the Vertex 2 top marks in the past.
Update 2/24/11 – OCZ Vertex 3 Review
After going through standard retail channels, we’ve managed to get our hands on two brand new 60GB OCZ Vertex 2’s. The first is a latest-generation 60GB 25nm NAND model, the second an older stock 32nm NAND version. Buyers can’t tell the difference thanks to OCZ’s dubious marketing, but we can, and in this mini-review we’ll dive deeper into the available capacity differences of the two SSDs as well as the performance differences. Anyone buying OCZ’s current line of SSDs needs to be aware of what they’re buying – and what they’re buying today is most certainly different than what has earned the Vertex 2 top marks in the past.
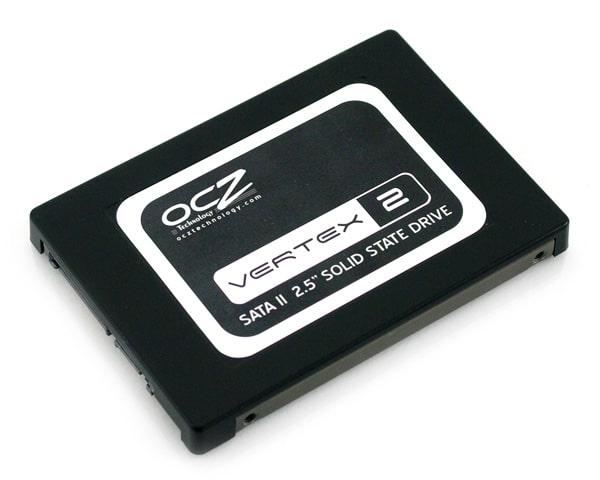
Advertised OCZ Vertex 2 Specifications:
- Available in 50GB to 480GB capacities
- Capacity Reviewed: 60GB
- Capacity Formatted: 55.9GB 32nm, 51.2GB 25nm
- Max Read: up to 285MB/s
- Max Write: up to 275MB/s
- Sustained Write: up to 250MB/s
- Random Write 4KB (Aligned): 50,000 IOPS
- Native TRIM support
- Seek Time: .1ms
- 2.5″ Design (comes with 3.5″ mounting bracket)
- Lightweight: 77g
- Operating Temp: 0°C ~ 70°C
- Storage Temp: -45°C ~ +85°C
- Power Consumption: 2W in operation,0.5W in standby
- Shock Resistant up to 1500G
- RAID Support
- MTBF: 2 million hours
- 3-Year Warranty
Aesthetics
While our past OCZ Vertex 2 experience has been with the larger 120GB model, we did notice some changes in the design and build of the new 60GB drive. The new design makes use of a plastic cover and metal plate, where the older model had a metal body with a flat metal plate that screwed into place. Both designs look very attractive, but personally I think the latest design looks nice.
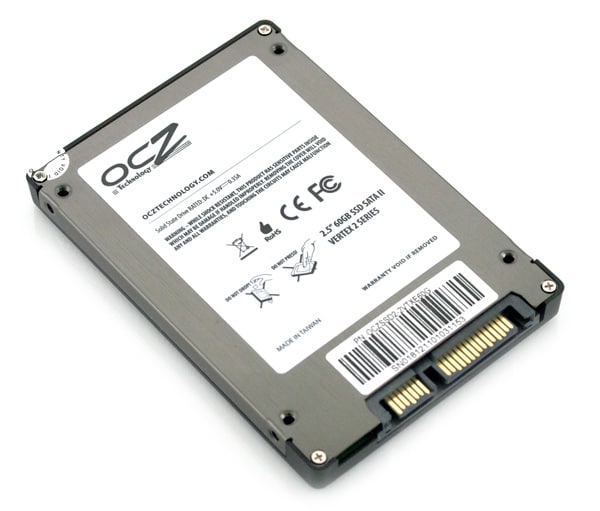
Besides the case itself changing, nothing else seems to indicate these drives are any different than the past models. The stickers and branding are identical, as well as the information stickers on the back.
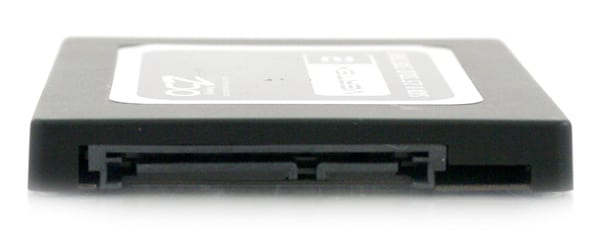
The front of the drive features a standard SATA power and data connection, with no debug pins next to the connector.
Disassembly
As a warning for those thinking about tearing into their new OCZ Vertex 2, know that you void your warranty in the process. Besides trying to get a physical confirmation on what the internals are, there really is no reason to open one of these up during normal usage.
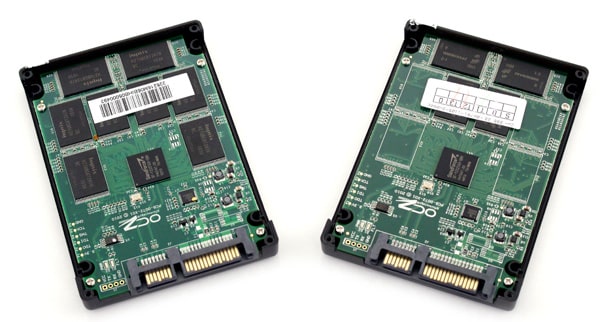
Old drive is to the left, the new 25nm to the right
The OCZ Vertex 2 is very easy to take apart with a Phillips-head screwdriver. After removing four screws around the perimeter and breaking through the warranty sticker, the top cover comes loose exposing the PCB inside. The circuit board is help in place with four additional screws, although the primary guts of the drive are on top.
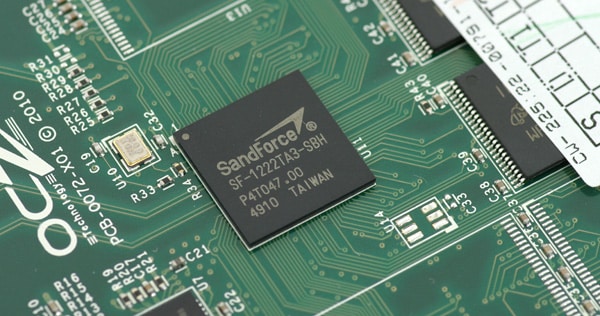
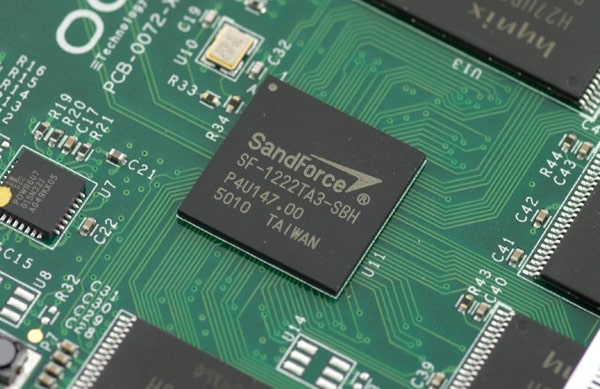
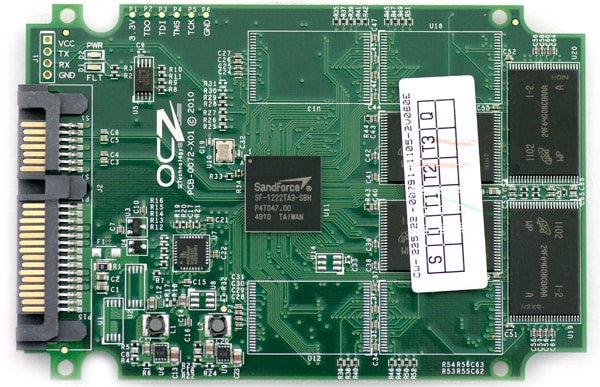
At the heart of the OCZ Vertex 2 SSD is a SandForce SF-1222TA3-SBH controller. SandForce SSDs interact directly with the flash modules, without a buffer, meaning no space taken up by RAM. Both models have identical circuit board revisions, with the only apparent difference outside of the visual change in NAND flash is the revision or software code on the SandForce controller. The 32nm Vertex 2 lists PU147.00 while the newer 25nm version has P4T047.00.
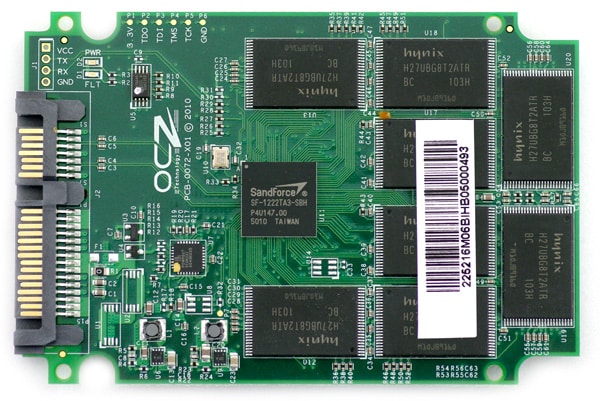
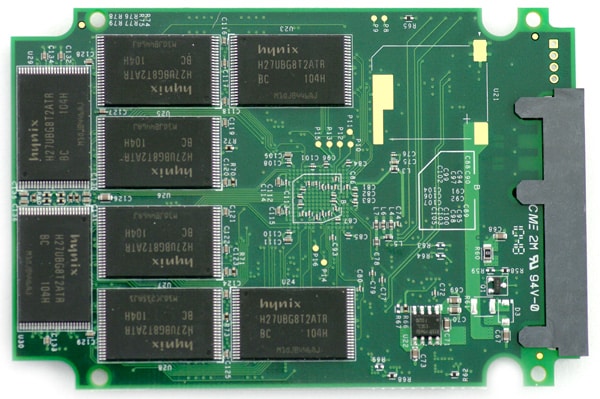
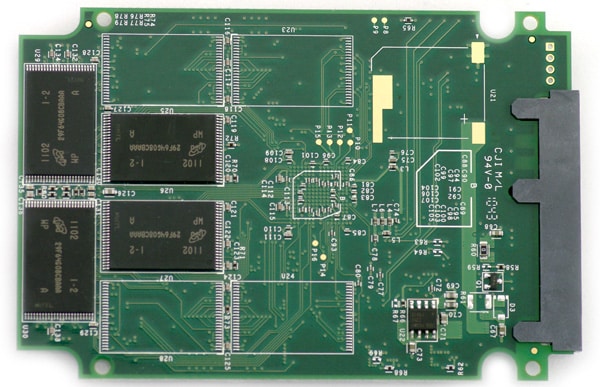
The older 32nm 60GB OCZ Vertex 2 uses sixteen 4GB Hynix H27UBG8T2ATR MLC NAND modules. As you can see below, it fills all the empty mounting points on the board and maintains all available channels into the SandForce controller.
The newer 25nm 60GB OCZ Vertex 2 only includes eight 8GB Micron 29F64G08CBAAA MLC NAND modules. Unlike the older model, this drive now only makes use of half the available openings on the circuit board.
Which Version Did I Get?
As stocks of older models dwindle, this question will become easier to answer, but for now there is some information out there that shows if you have a 25nm or 32nm model. In an OCZ press release offering a “trade-up” program where unlucky individuals can pay more to get the originally advertised Vertex 2, they provide a table listing what models numbers are associated with each product revision:
As indicated in the table, models with the “E” in the last half of the model number are those with 25nm flash… although that isn’t what we found. After purchasing two models from different online retailers, we got two drives with matching model numbers (OCZSSD2-2VTXE60G). As you can see below, nothing about these drives is the same.
The model on the right is the newer 25nm Micron flash version, while the one on the left is the previous generation model with 32nm Hynix NAND. So knowing this, it is hard to tell which model you end up with until you plug it into your computer or void the warranty and open it up.
Synthetic Benchmarks
When it comes to advertising claims, almost every SSD is sold on two things. Sequential read and write speed and random 4K write performance. Currently almost every SandForce model on the market lists a maximum read/write speed of 285/275MB/s, which for the most part has held up in tests. Most manufacturers will even list a sustained write speed of roughly 250MB/s, which has also held true in reviews. What consumers don’t know is with the latest shift in NAND flash from 32nm to 25nm, those claims no longer hold true, at least in configurations sold today. To show our readers and prospective buyers how these new drives perform, we obtained one old stock and one new stock 60GB OCZ Vertex 2. For those interested, as of late last week Amazon was still selling the 32nm model.
To cut right to the chase, we removed all other distractions and put new versus old against each other in this mini-review. We used IOMeter to show how each drive performs in the most optimal of conditions. Each drive was tested identically, down to the same number of tests performed to keep results as accurate as possible. The older 32nm 60GB Vertex 2 managed an impressive 248MB/s read and 246MB/s write, which is what we have come to expect from current-generation SandForce models. This is right at the point where drives start to saturate the SATA 3.0Gbps bus. The newest 25nm model on the other hand didn’t hold a candle to those speeds. We recorded a read speed of 182MB/s and a write speed of 215MB/s. For those with calculators handy, that works out to the 25nm model having 36% slower in read speeds and 14% slower write speeds. With 4K-alignment the gaps in speed narrowed, but still showed a very large gap between each model.
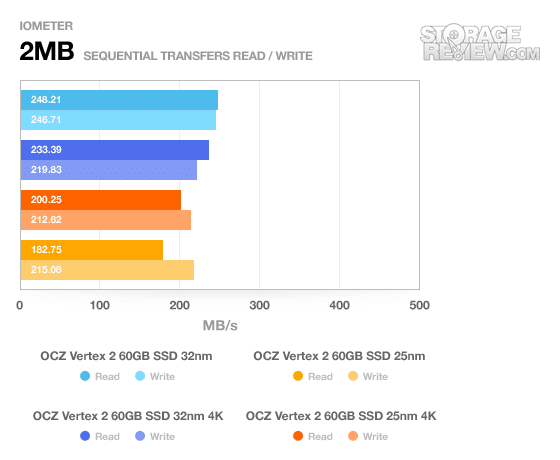
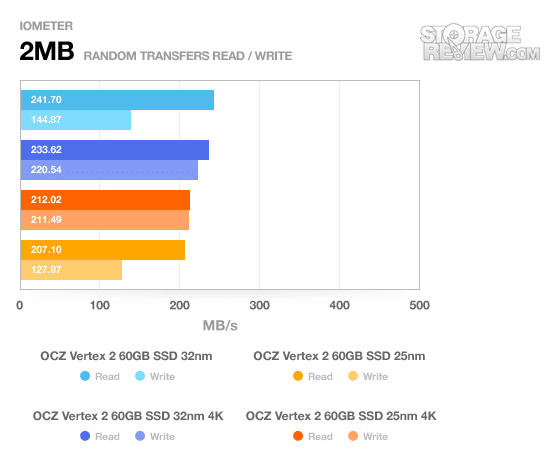
Switching to random 2MB transfer in IOMeter the 32nm model has a strong lead, topping out at 241 and 233MB/s read speed, while the 25nm model only offers 207 and 212MB/s. Write speeds also take a hit with the 25nm model coming up 9 to 17MB/s slower compared to the previous generation Vertex 2.
Random 4K performance was one area the new 25nm model was able to lead in some categories, although the 32nm model lead when it came to write performance when 4K-aligned.
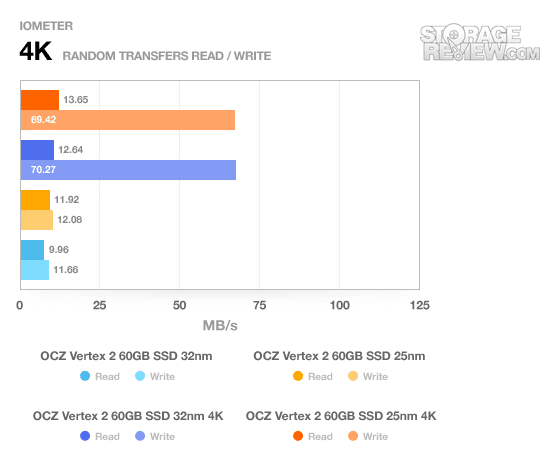
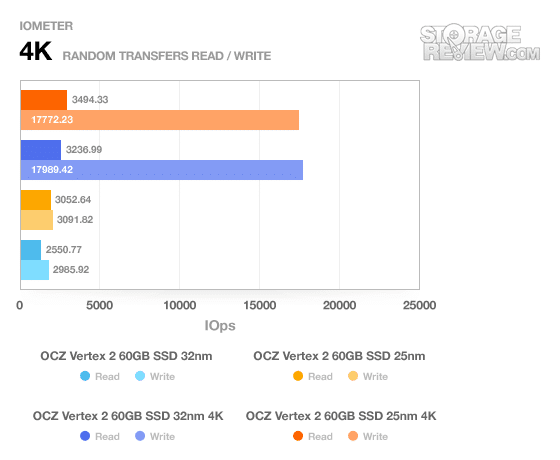
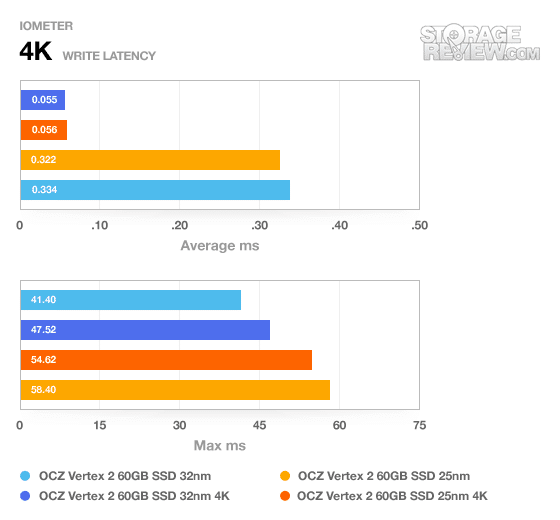
With its slightly faster 4K-aligned 4K random write performance the 32nm 60GB Vertex 2 topped the write latency charts. In both 512-byte alignment and 4K-alignment tests the 32nm model also offered lower maximum latency times.
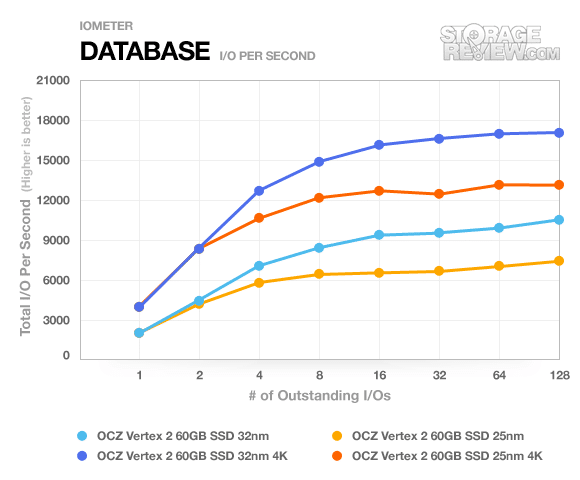
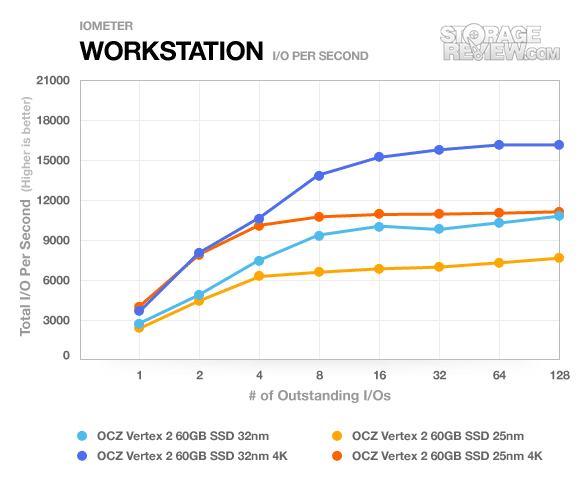
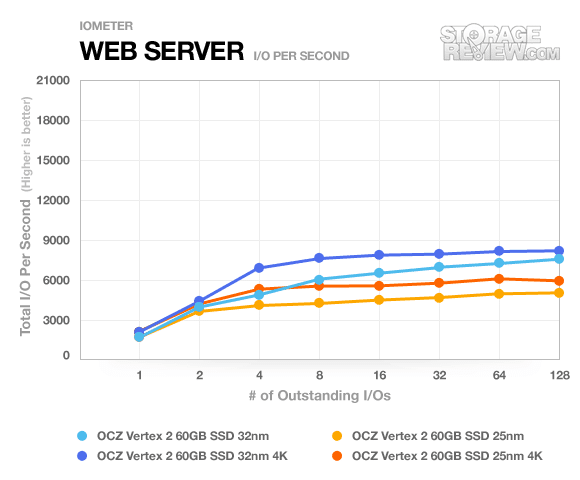
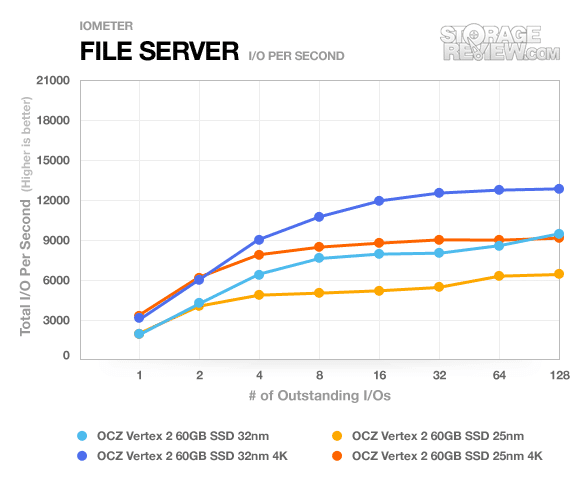
Looking at our synthetic IOMeter server profile tests, the biggest difference between these drives are noticed. Without the same number of internal I/O channels as the 32nm drive, the 25nm Vertex 2 can’t keep up under higher multi-tasking loads. In nearly all tests the 32nm model was close to 25% faster across the board, with differences growing as the queue depth increased. It was almost as if we were comparing models in different classes, not a newer to older generation drive sold under the same model name.
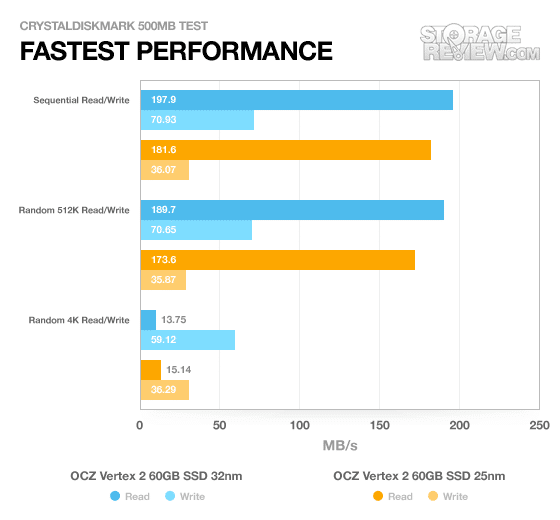
With CrystalDiskMark set to send random data to each drive, the difference in write speed between these two models is night and day. The speed difference is so large it almost looks like we put an Intel X25-V head to head with the faster Intel X25-M.
Real-World Benchmarks
Our custom StorageMark 2010 traces break down drive performance by scenario, which aim to mimic common everyday situations.
The first real-life test is our HTPC scenario. In this test we include: playing one 720P HD movie in Media Player Classic, one 480P SD movie playing in VLC, three movies downloading simultaneously through iTunes, and one 1080i HDTV stream being recorded through Windows Media Center over a 15 minute period. Higher IOps and MB/s rates with lower latency times are preferred. In this trace we recorded 2,986MB being written to the drive and 1,924MB being read.
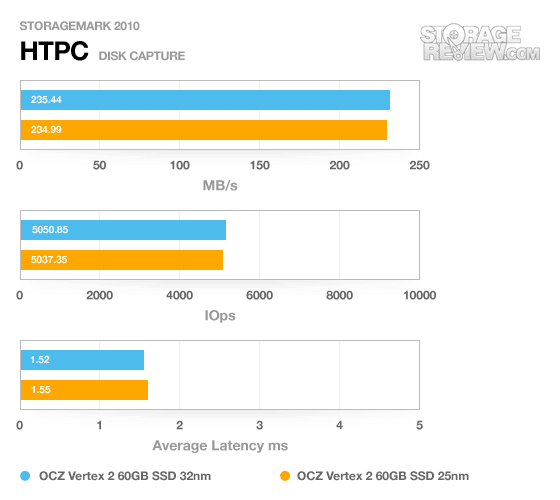
With all the doom and gloom from our synthetic tests, we actually didn’t see a huge performance difference in our real-world traces. The HTPC trace saw the smallest difference in speed, with both drives being roughly on par with each other.
Our second real-life test covers disk activity in a productivity scenario. For all intents and purposes this test shows drive performance under normal daily activity for most users. This test includes: a three hour period operating in an office productivity environment with 32-bit Vista running Outlook 2007 connected to an Exchange server, web browsing using Chrome and IE8, editing files within Office 2007, viewing PDFs in Adobe Reader, and an hour of local music playback with two hours of additional online music via Pandora. In this trace we recorded 4,830MB being written to the drive and 2,758MB being read.
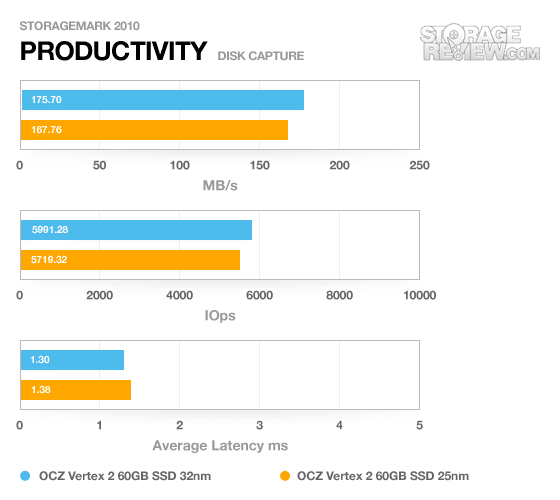
Our productivity trace, which tends to be the most stressful in the way that it compares SSDs and HDDs alike, saw the biggest difference, with the 32nm model measuring roughly 5% faster. While you might make the argument that it almost comes into the range of play for error, these scores were averages of three trace runs, not one-off scores.
Our third real-life test covers disk activity in a gaming environment. Unlike the HTPC or Productivity trace, this one relies heavily on the read performance of a drive. To give a simple breakdown of read/write percentages, the HTPC test is 64% write, 36% read, the Productivity test is 59% write and 41% read, while the gaming trace is 6% write and 94% read. The test consists of a Windows 7 Ultimate 64-bit system pre-configured with Steam, with Grand Theft Auto 4, Left 4 Dead 2, and Mass Effect 2 already downloaded and installed. The trace captures the heavy read activity of each game loading from the start, as well as textures as the game progresses. In this trace we recorded 426MB being written to the drive and 7,235MB being read.
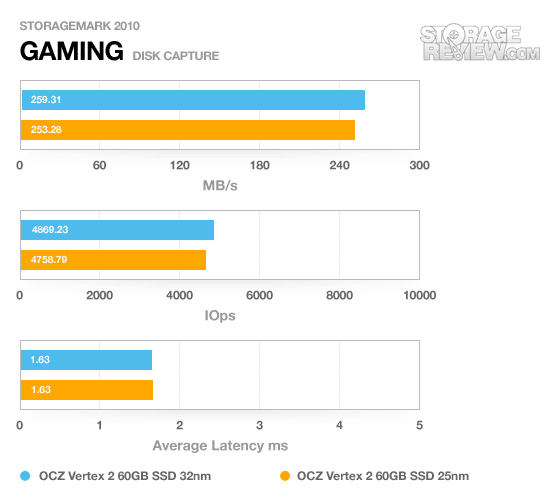
With the clear advantage in read-speed of the 32nm OCZ Vertex 2, it wasn’t a surprise to also see it leading in the Gaming trace. While the synthetic benchmarks showed a massive difference in read speed between each model, our read-heavy trace only saw a 2.3% difference between them both.
Power Consumption
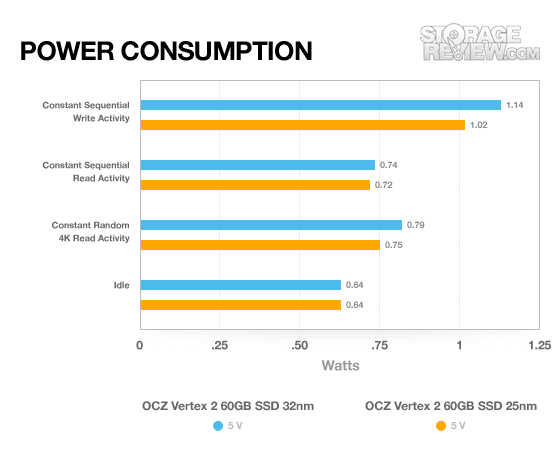
Even with the drastic change in internal hardware, we didn’t find a big change in power consumption on the newer 25nm SSD. Across the board values either dropped or were on par with the previous generation 60GB model. While OCZ rates these draws as using 2W of power while active we found those measurements to be closer to 0.75W to 1W depending on the scenario…which is a very good thing. Comparing new to old, power usage has dropped a bit over 10% at its peak rate while under constant write activity.
Conclusion
With the wide selection of SSDs on the market today, there is no question that some drives will be slower than others. Reviewers like ourselves and buyers alike understand that some models will score differently, and we can choose with our wallets. The problem we have with this particular situation is that any choice to make an informed buying decision was taken away when OCZ sold and advertised these models as identical through online retailers. Both list the same 285MB/s read and 275MB/s write speeds, the same three year warranties, and the same retail price. What the average buyer doesn’t know is that depending on which model they get, one is up to 49% slower than the other and has only 66% of the rated write-cycles. There are other complaints as well, such as having a 5GB smaller capacity. Considering both models are sold as being 60GB; one being formatted with 55.8GB of space with the other having only 51.2GB is a huge difference. All that said, at least the 25nm version held up well in our real world benchmarks.
Overall there is no question that OCZ messed up with the way they handled the introduction of 25nm flash with their consumer SSD line. Listing these drives as different models, changing the rated speeds, mentioning the lower expected life-span, and even changing the pricing would have let buyers know what they were getting in to. Instead they took the approach that no one would notice… well we did and plenty of their own buyers did too.
Pros
- Handles real-world performance test well
- Fast and priced competitively against 40GB boot drives
- Up to 10% less power used compared to 32nm Vertex 2
Cons
- Marketing practices could burn bridges with customers
- Up to 49% slower in certain synthetic benchmarks
- No sure-fire way to tell which model you have until you plug it in
Bottom Line
If it weren’t for their shady marketing practices, OCZ could have come to market with a pretty decent 25nm SSD, at least based on our real world benchmarks. As it is though, the “new and not so improved” Vertex 2 is branded and marketed the same way as the “old and faster” Vertex 2. Buyers are better off finding an old Vertex 2 if they can, but that’s nearly impossible since the two products even share the same model number. At this point it is buyer beware until OCZ steps up and reveals some degree of transparency.
Update
OCZ is now offering free replacements for affected 25nm SSDs. We will update this review when we have a revised 25nm Vertex 2 in hand.
Update 2/24/11 – OCZ Vertex 3 Review
