The Mangstor MX6300 is a Full Height, Half Length SSD that uses NVMe interface. The MX6300 comes in three capacities: 2.0TB, 2.7TB, and 5.4TB. The drive leverages enterprise MLC NAND and can be placed in x86 server PCIe slots. Using NVMe and MLC NAND gives the MX6300 tremendous performance benefits. Mangstor claims the drive can hit 900K IOPS on random read performance and 3.7GB/s sequential read and with seven complete drive writes per day endurance. The Mangstor MX6300 leverages Toshiba NAND and a software-defined flash controller developed by Mangstor using Altera FPGAs.
The MX6300’s performance and low latency makes it ideal to me used in real-time analytics, online transaction processing (OLTP) and server virtualization. The MX6300 accelerates applications by locating hot data right up close to the host CPU. In this way the MX6300 acts as a storage tier that has high-capacity, low latency, and high performance for mission critical data. With NVMe, the MX6300 is able to utilize the full potential of the benefits of flash over SATA or SAS interface.
One big benefit that separates the MX6300 from its competitors is its configurability. The drive’s controller can be software configured, both on the front end and back end, to optimize its usage of NAND and lowering system power. Not only does the Mangstor software allow users to configure its controller, they can also do in-system field updates without unnecessary downtime. This also allows for memory to be extended from DRAM to the MX6300 for data persistence.
The Mangstor MX6300 comes with a 5-year warranty and a street price around $15,000. For our review we will be looking at the 2.7TB model.
Mangstor MX6300 NVMe SSD specifications:
- Form factor: FHHL
- Capacity: 2.7TB
- NAND: eMLC
- Interface: NVMe PCIe Gen3 x8 (8GT/s)
- Performance:
- Sequential Read Performance (Up to): 3,700MB/s
- Sequential Write Performance (Up to): 2,400MB/s
- Random 4KB Read (Up to): 900,000 IOPS
- Random 4KB Write (Up to): 600,000 IOPS
- Sustained 4KB Write (Up to): 300,000 IOPS
- Random 70/30 Read/Write (Up to): 700,000 IOPs
- Latency Read/Write (QD 1): 90/15ms
- Endurance:
- DWPD: 7
- Data retention: 90 days retention at 40° C at EOL
- MTBF: 1.8 M hours
- Environment:
- Power Consumption 70/30 Read/Write: 45W
- Operating Temperature: 0 to 55 °C ambient temperature with suggested airflow
- Non Operating Temperature: -40° to 70° C
- Air Flow (Min): 300 LFM
- Operating systems:
- Windows Server 2012 R2 (Inbox)
- Windows Server 2008 R2 SP1 (OFA NVME)
- Linux kernel 3.3 or later
- RHEL 6
- 5-year warranty
Design and build
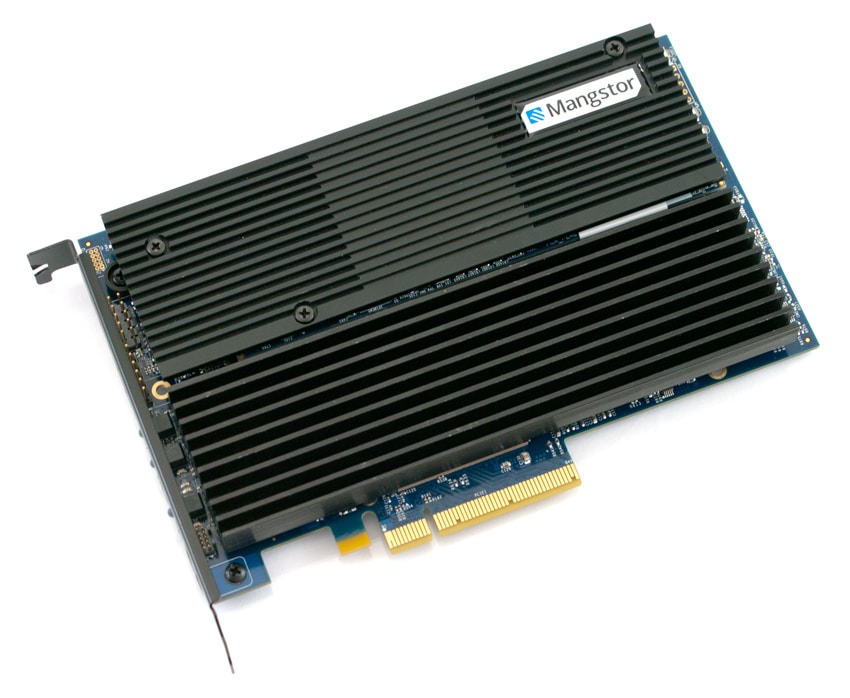
The Mangstor MX6300 is a Full-Height, Half-Length card. The taller height offers more room for NAND and controllers but does limit the slots, and therefore the servers, the card fits in. The top of the card has heat sinks that run the length of the card. On the upper right hand corner is Mangstor branding.
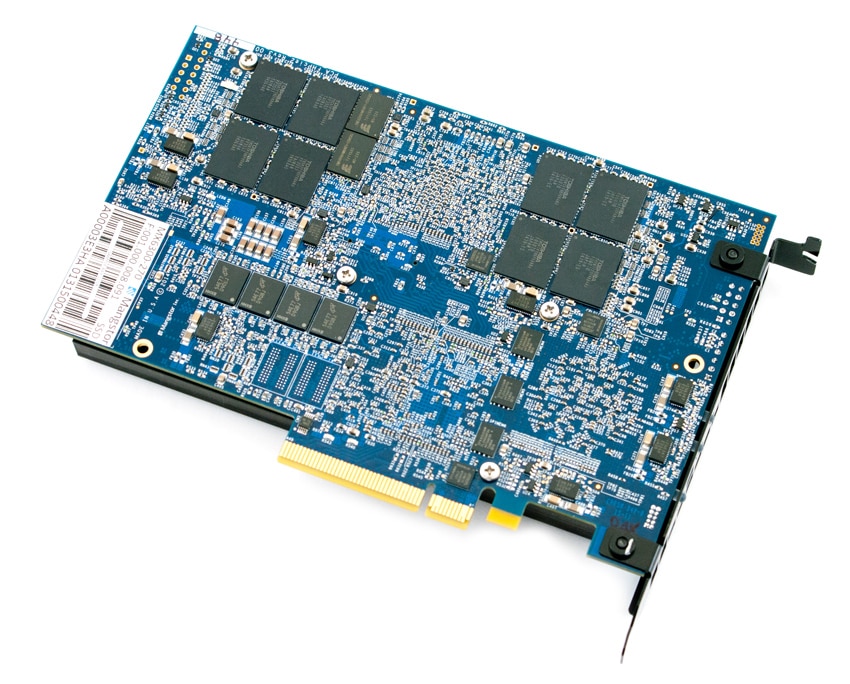
Flipping the card over we see an exposed board with more additional NAND. Along the bottom of the card is the x8 PCIe 3.0 interface.
Testing Background and Comparables
The Mangstor MX6300 has a Coherent Logix HyperX processor, a software-defined flash controller developed by Mangstor using Altera FPGAs, and Toshiba eMLC NAND.
- Fusion-io PX600 (2.6TB, 1x FPGA controller, MLC NAND, PCIe 2.0 x8)
- Fusion-io SX300 (3.2TB, 1x FPGA controller, MLC NAND, PCIe 2.0 x8)
- Fusion-io ioDrive2 (1.2TB, 1x FPGA controller, MLC NAND, PCIe 2.0 x4)
- Micron P420m (1.6TB, 1x IDT controller, MLC NAND, PCIe 2.0 x8)
- Huawei Tecal ES3000 (2.4TB, 3x FPGA controllers, MLC NAND, PCIe 2.0 x8)
- Virident FlashMAX II (2.2TB, 2x FPGA controllers, MLC NAND, PCIe 2.0 x8)
All PCIe Application Accelerators are benchmarked on our second-generation enterprise testing platform based on a Lenovo ThinkServer RD630. For synthetic benchmarks, we utilize FIO version 2.0.10 for Linux and version 2.0.12.2 for Windows. We tested synthetic performance of the Mangstor MX6300 using CentOS 7.0. Sysbench currently uses a CentOS 6.6 environment, while our Windows SQL Server tests use Server 2012 R2. Native NVMe drivers were used throughout.
Application Performance Analysis
In order to understand the performance characteristics of enterprise storage devices, it is essential to model the infrastructure and the application workloads found in live production environments. Our first two benchmarks of the Mangstor MX6300 are therefore the MySQL OLTP performance via SysBench and Microsoft SQL Server OLTP performance with a simulated TCP-C workload.
Our Percona MySQL database test via SysBench measures the performance of OLTP activity. This test measures average TPS (Transactions Per Second), average latency, as well as average 99th percentile latency over a range of 2 to 32 threads. Percona and MariaDB can make use of Fusion-io flash-aware application acceleration APIs in recent releases of their databases, although for the purposes of comparison we test each device in a "legacy" block-storage mode.
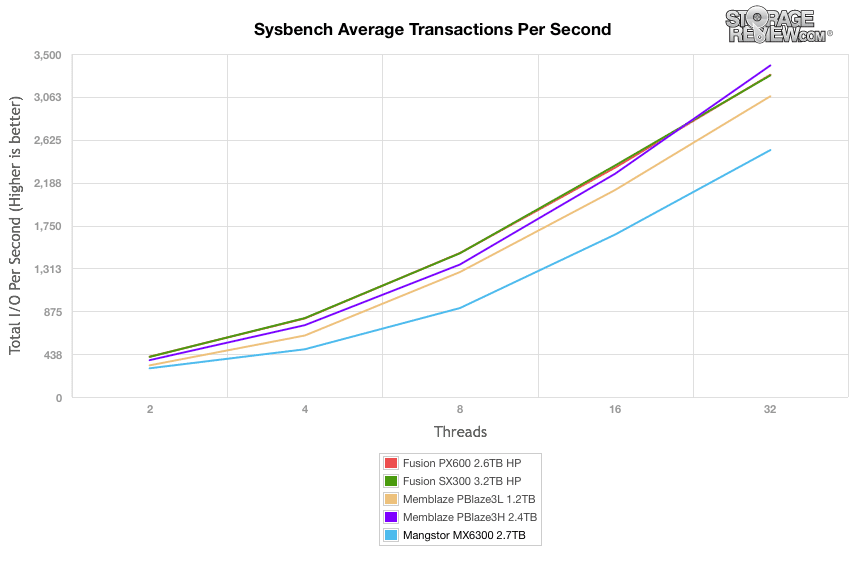
In our SysBench test the MX6300 in CentOS 6.6 started off lower than the others in this group and maintained slower performance as the load increased. The MX6300 peaked at 2520 TPS. Mangstor has told us that NVMe drivers in CentOS 6.6 could be to blame, with CentOS 7+ offering better performance and stability.
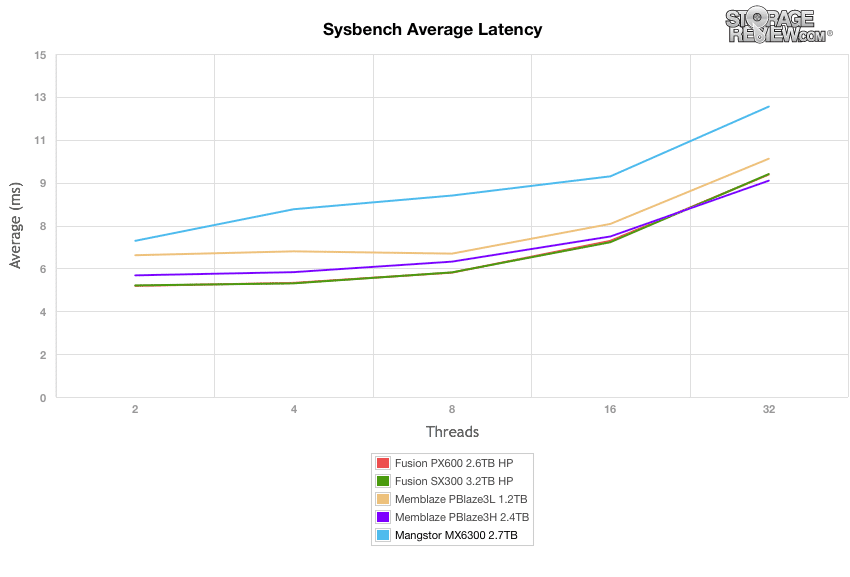
SysBench average latency shows more of the same with the MX6300 having consistently higher latency than the over drives throughout starting at 6.83ms and peaking at 12.7ms.
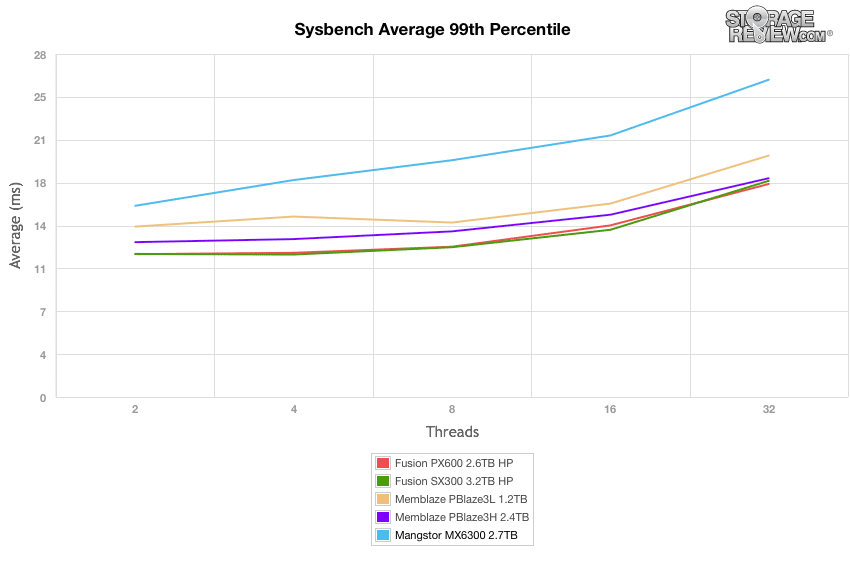
When comparing the 99th percentile latency in our SysBench test, The MX6300 once again performed at the back of the pack throughout, this time by a slightly larger margin, peaking at 25.9ms while the next closest peaked at 19.71ms.
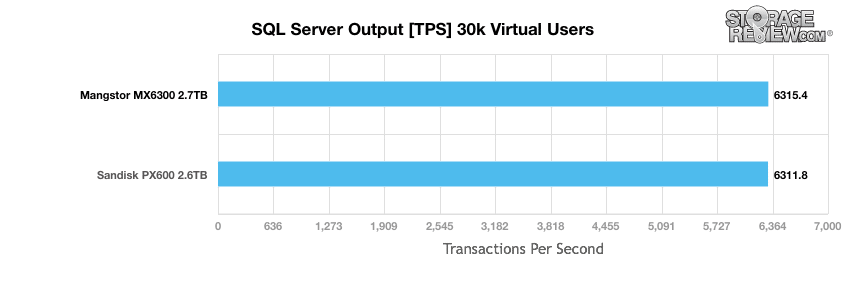
StorageReview’s Microsoft SQL Server OLTP testing protocol employs the current draft of the Transaction Processing Performance Council’s Benchmark C (TPC-C), an online transaction processing benchmark that simulates the activities found in complex application environments. The TPC-C benchmark comes closer than synthetic performance benchmarks to gauging the performance strengths and bottlenecks of storage infrastructure in database environments. Our SQL Server protocol uses a 685GB (3,000 scale) SQL Server database and measures the transactional performance and latency under a load of 30,000 virtual users.
Comparing the MX6300 to the PX600 we see it pull ahead by just a bit at 6315.4 TPS compared to the PX600's 6311.8 TPS.
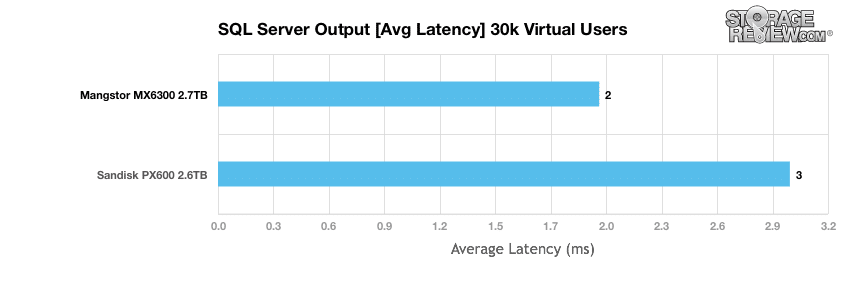
We see the same thing is present in average latency with the MX6300 being a ms faster than the PX600, with 2ms to 3ms.
Enterprise Synthetic Workload Analysis
Flash performance varies throughout the preconditioning phase of each storage device. Our synthetic enterprise storage benchmark process begins with an analysis of the way the drive performs during a thorough preconditioning phase. Each of the comparable drives are secure erased using the vendor's tools, preconditioned into steady-state with the same workload the device will be tested with under a heavy load of 16 threads with an outstanding queue of 16 per thread, and then tested in set intervals in multiple thread/queue depth profiles to show performance under light and heavy usage.
- Preconditioning and Primary Steady-State Tests:
- Throughput (Read+Write IOPS Aggregate)
- Average Latency (Read+Write Latency Averaged Together)
- Max Latency (Peak Read or Write Latency)
- Latency Standard Deviation (Read+Write Standard Deviation Averaged Together)
Our Enterprise Synthetic Workload Analysis includes two profiles based on real-world tasks. These profiles have been developed to make it easier to compare to our past benchmarks as well as widely-published values such as max 4k read and write speed and 8k 70/30, which is commonly used for enterprise hardware.
- 4k
- 100% Read or 100% Write
- 100% 4k
- 8k 70/30
- 70% Read, 30% Write
- 100% 8k
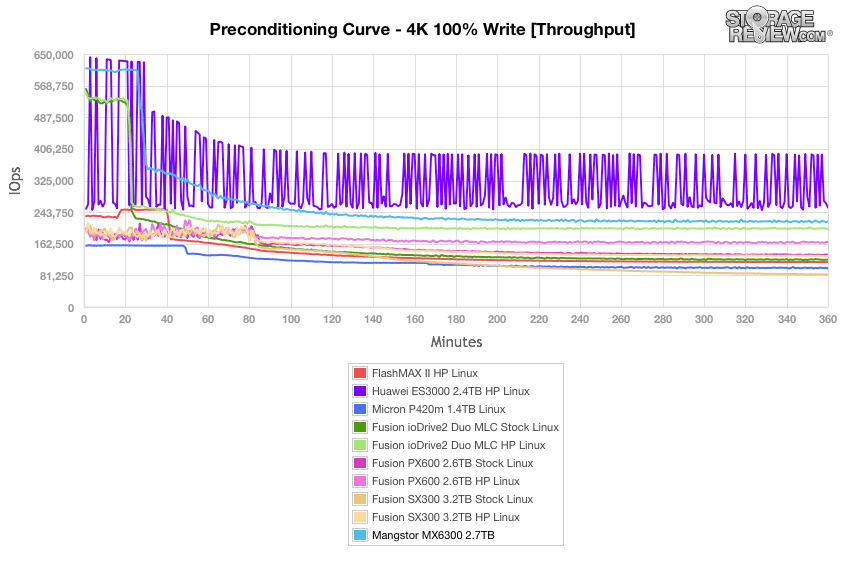
Our first test measures 100% 4k random write performance with a load of 16T/16Q. In this scenario, The MX6300 started off the strongest performer before dropping to second in a steady state, hovering around the 225K IOPS mark.
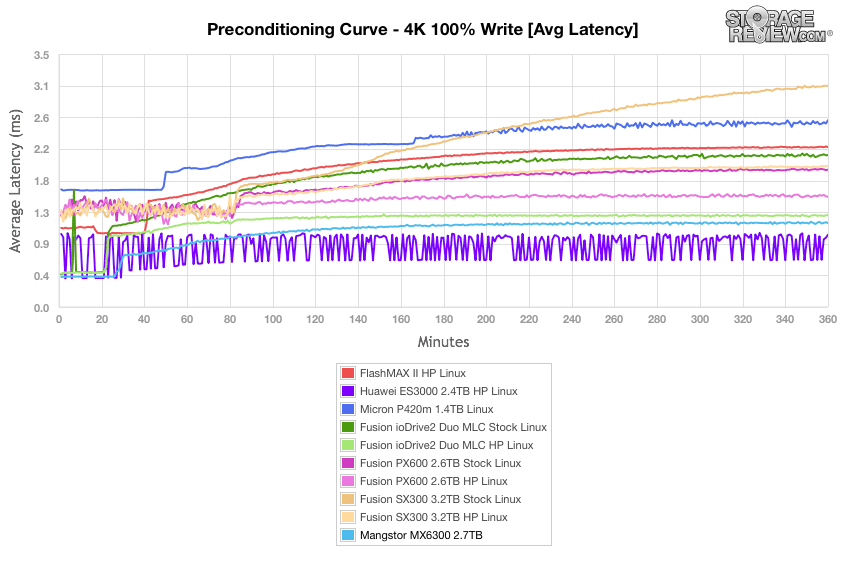
Looking at average latency paints a similar picture, the MX6300 started off strong and finished in a steady state between 1ms and 1.2ms placing it near the top of the pack.
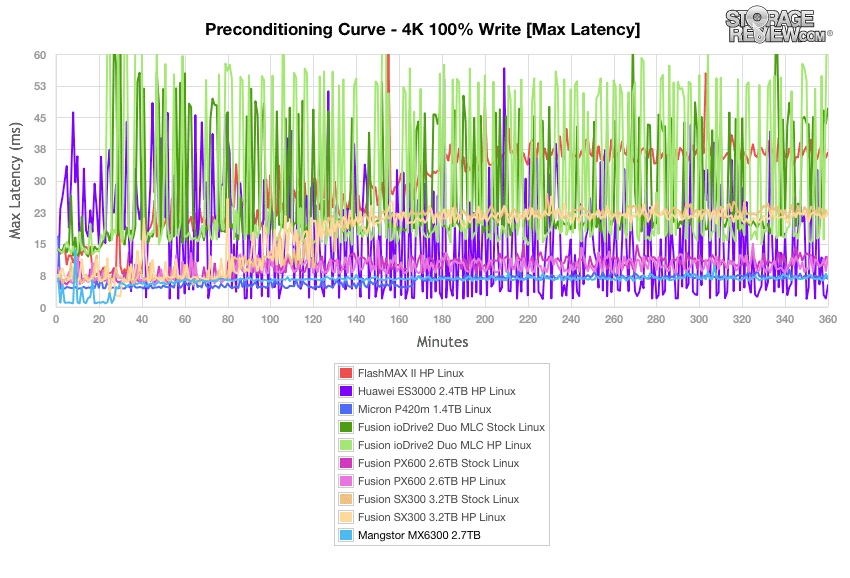
With max latency, the MX6300 started off strong again and came in second overall slowly rising from about 6ms to just under 8ms in a steady state. It did have a few spikes, one as high as 13.54ms early on and another larger one near the end, 9.92ms.
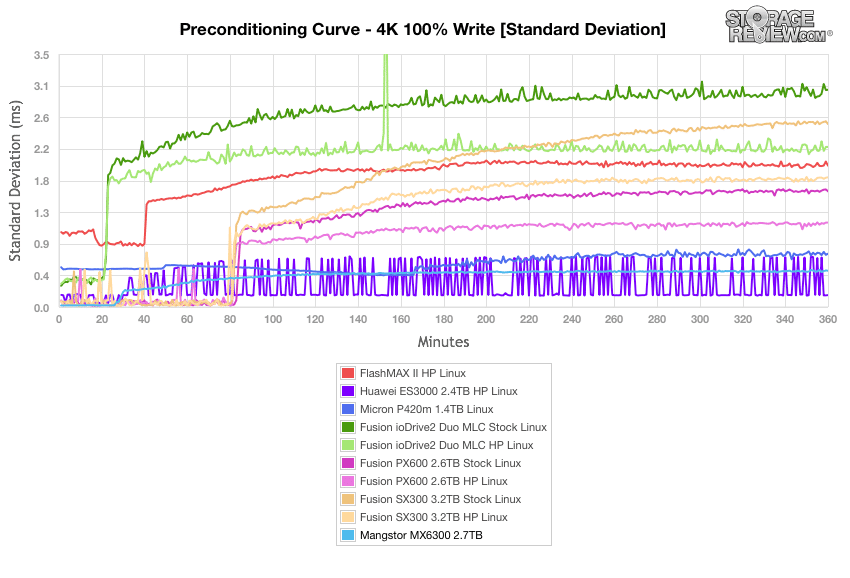
Plotting standard deviation calculations provides a clearer way to compare the amount of variation between individual latency data points collected during a benchmark. With our standard deviation test, the MX6300 started and stayed strong throughout, running right at .5ms for a majority of the test. While the Huawei had lower latencies it was less consistent than the MX6300.
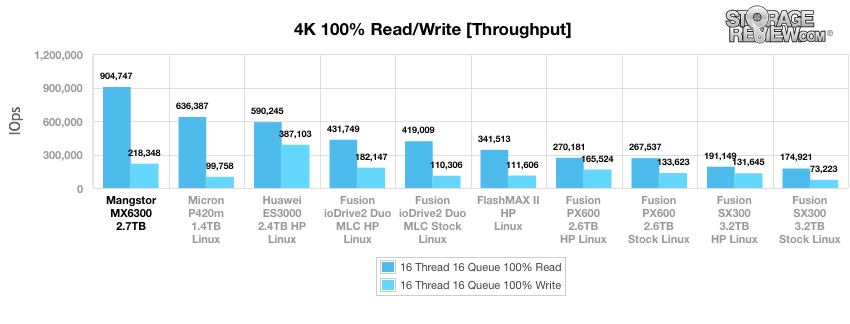
After the drives have finished preconditioning we take a look at primary synthetic benchmarks. In 4K throughput we saw the MX6300 take the top read spot with no problem. The MX6300 gave up 904,747 IOPS read, 150K IOPS over its next closest competitor. While it didn’t take the top spot in write performance it did land in second with 218,348 IOPS.
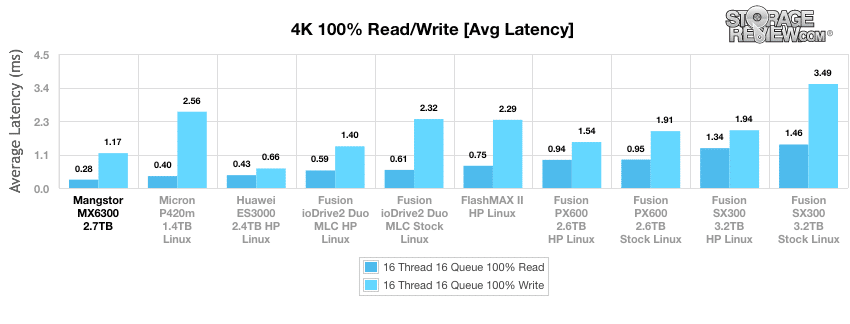
We see the same placement with average latency. The MX6300 was the top performer in read with 0.28ms and second on write with 1.17ms.
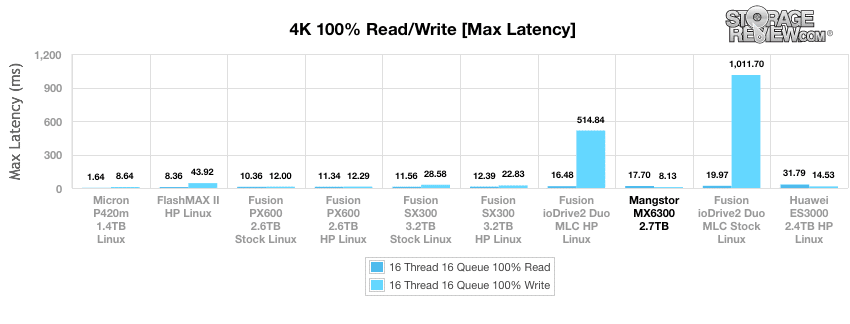
Turning to max latency the MX6300 doesn’t place quite as strongly. In read latency it fell to the bottom third of the pack with results of 17.7ms and with write latency it came in third with 8.13ms.
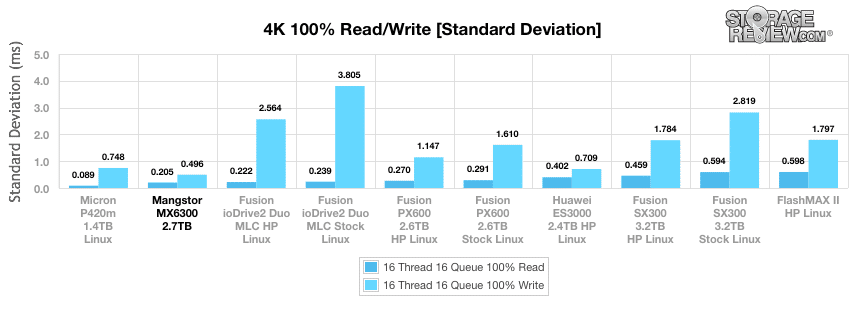
With standard deviation, the MX6300 once again comes out as the top performer, in write latency second in read, with a read latency of 0.205ms and a write latency of 0.496ms.
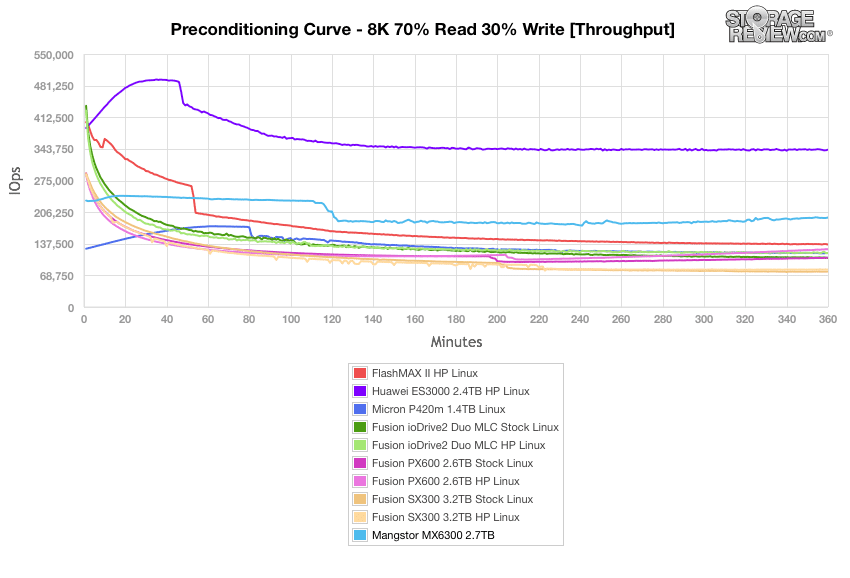
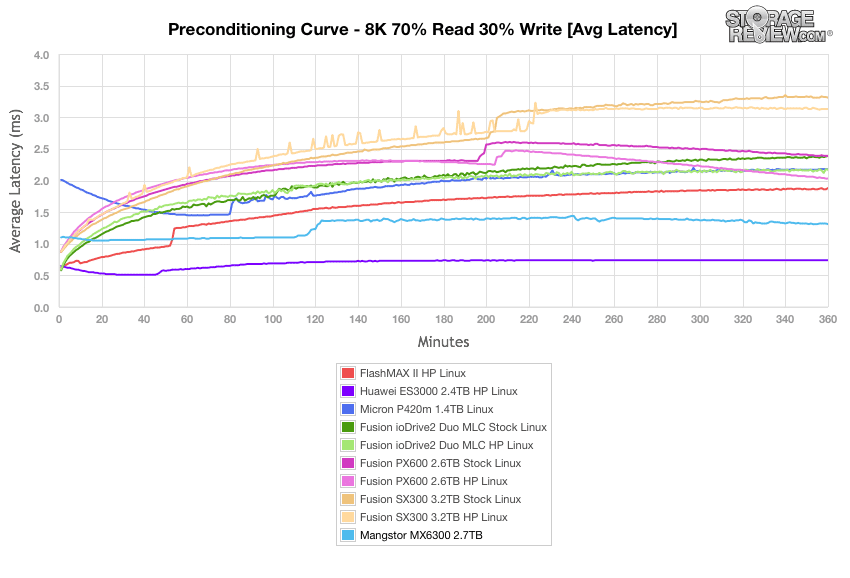
Our next workload uses 8k transfers with a ratio of 70% read operations and 30% write operations. The MX6300 gave another strong performance. Though it started off on the lower end it did reach a steady state around 18,000 IOPS putting in second.
With average latency the MX6300 started off just over 1ms and stayed under 1.5ms throughout.
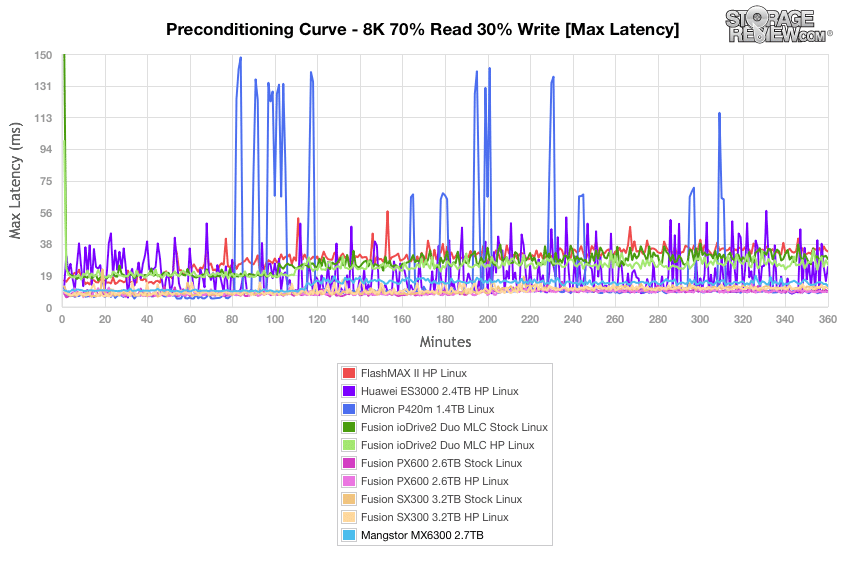
In the max latency benchmark, the MX6300 was about to stay under 20ms throughout, again giving a fairly consistent performance compared to some of the other drives.
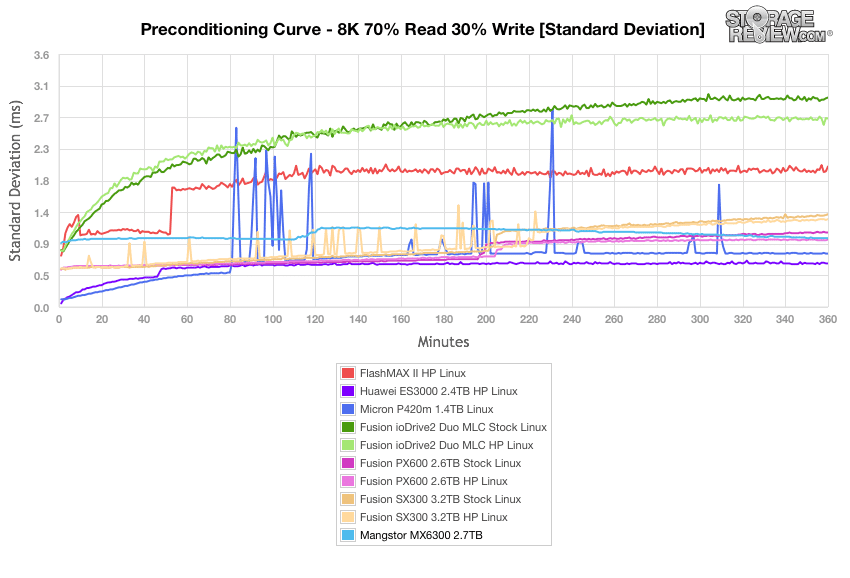
Standard deviation calculations for the 8k 70/30 preconditioning place that maximum latency anomaly in the context of an otherwise consistent and unremarkable latency profile during the approach to steady state. The MX6300 hovered around 1ms throughout, starting and finishing a little under.
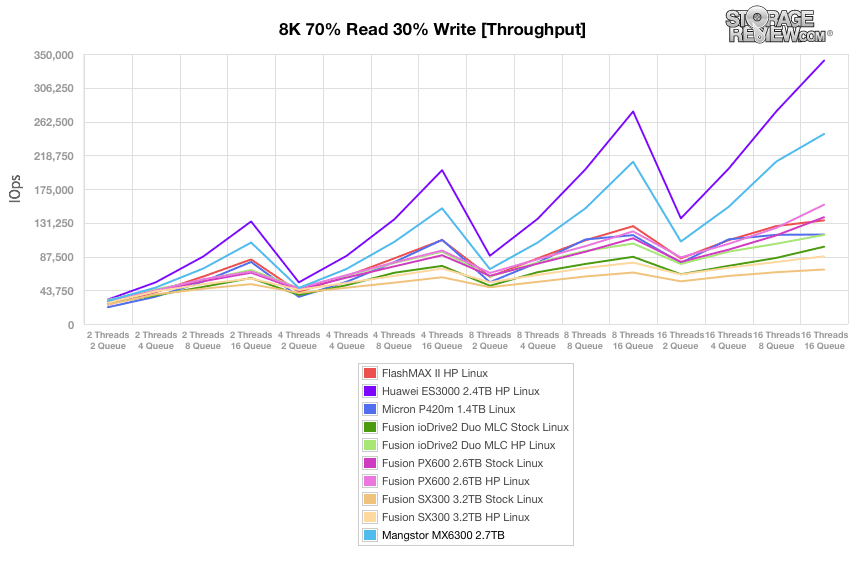
Once the drives are preconditioned, the 8k 70/30 throughput benchmark varies workload intensity from 2 threads and 2 queue up to 16 threads and queue of 16. The MX6300 came in second place with a peak IOPS of 246,371.
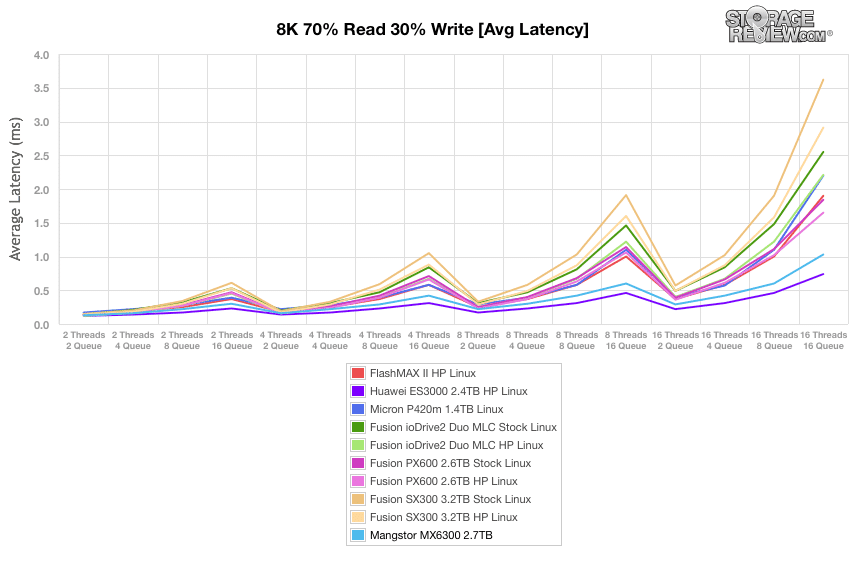
Average latency gives us similar placement with the MX6300 not having a latency higher than 1.03ms.
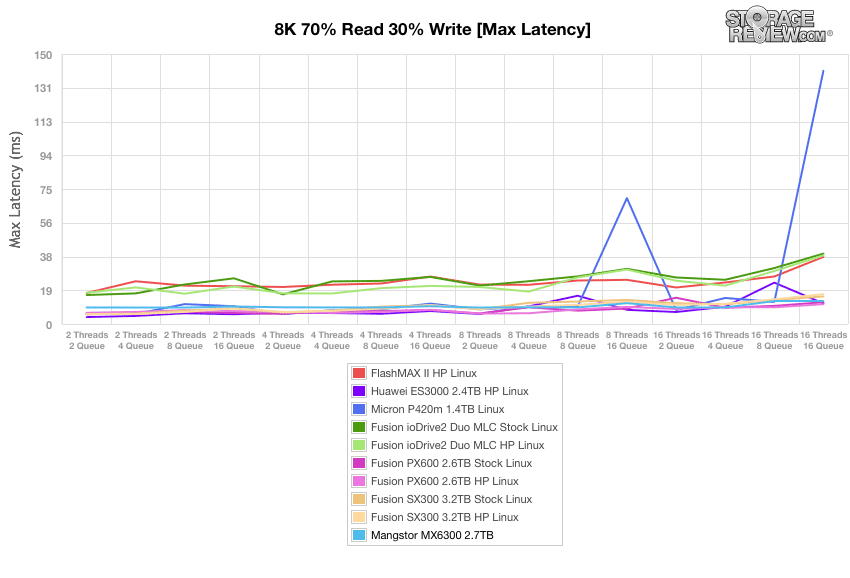
The MX6300 performed a bit better in the max latency benchmark keeping a consistently low latency throughout.
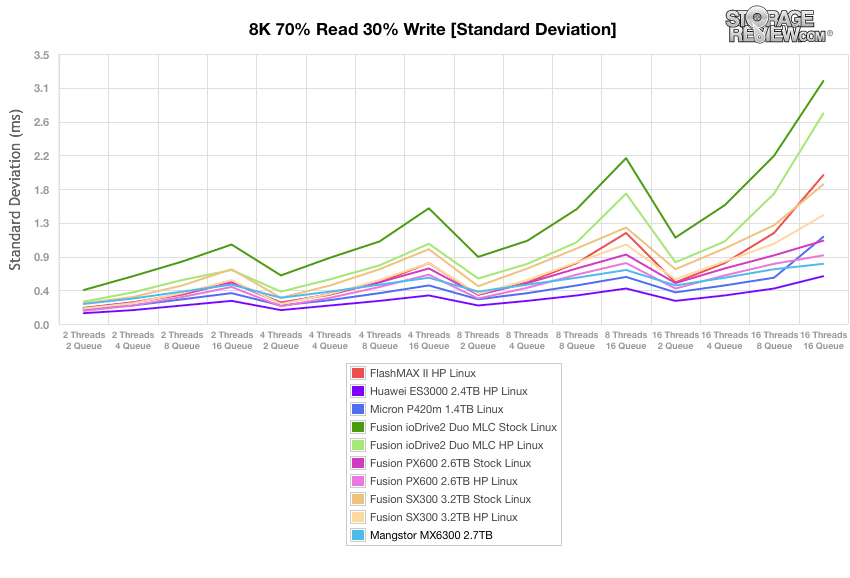
Measured in terms of standard deviation, the MX6300 placed in the top third.
Conclusion
The Mangstor MX6300 is a Full Height, Half Length NVMe SSD. The MX6300 comes in three capacities, with 5.4TB being the highest. The MX6300 leverages an on-board processor, a software configurable controller, and Toshiba eMLC NAND to give it a big performance boost. The MX6300 is ideal for real-time analytics, OLTP, and server virtualization. The drive claims high performance and low latency along with 7 DWPD endurance and comes with a 5-year warranty.
Looking at performance, the MX6300 performed at the top of the pack in our SQL Server and FIO synthetic 4K read tests. In our SQL Server TPC-C test the MX6300 offered an impressive 2ms latency in our 3,000 scale workload with 30,000 virtual users. In our synthetic benchmarks the MX6300 did much better coming out on top in several tests. In both sets of or preconditioning tests the MX6300 gave strong, steady performance coming out in the top three in most tests. On our primary 4K test the MX6300 had a throughput of 904,747 IOPS read, higher than its claimed performance. We saw an average 4K read latency of 0.28ms. In our 8K 70/30 tests the MX6300 gave us a throughput of 246,371 IOPS. In our 8K 70/30 latency tests the MX6300 placed strongly in all three tests. Overall the only weak area to note was in our Sysbench workload, where the MX6300 came in towards the bottom of the pack, although some of that could be related to weaker NVMe driver support in CentOS 6.6, versus CentOS 7.0 where we measured FIO results and Server 2012 R2 where we deployed it with SQL.
Pros
- Software Configurable Controller
- 5.4TB maximum capacity
- Over 900K IOPS in 4K read performance
- Fantastic SQL Server performance
Cons
- Lower SysBench performance in CentOS 6.6
The Bottom Line
The Mangstor MX6300 is a FHHL NVMe SSD offering an incredible 900k+ IOP 4K read performance, designed to accelerate applications and gives administrators the ability to extend their DRAM by offloading the workload into flash.


 Amazon