The Kingston DC1000B is a read-focused M.2 NVMe SSD aimed at the market of on-board server boot drives. While the DC1000B is aimed at being a cost effective offering, it doesn’t skimp on features such as power-fail protection that buyers expect from enterprise-grade SSDs. Aside from being used as a boot SSD, the DC1000B is beefy enough and can be leveraged for caching and logging applications as well, with a 0.5 DWPD endurance rating and a 5 year warranty. The DC1000B ships in capacities of 240GB and 480GB.
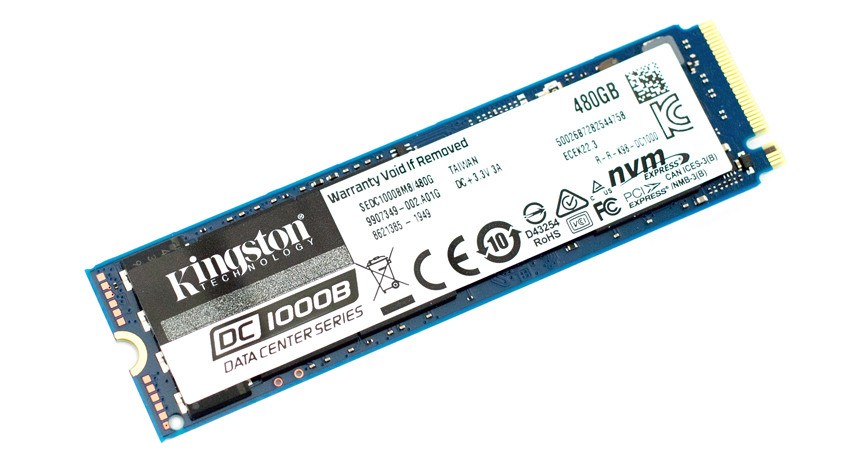
The DC1000B leverages 3D TLC NAND and the PCIe Gen3 x 4 NVMe interface to offer sequential read speeds topping 3.2GB/s. According to Kingston, the drive can hit up to 205K IOPS in 4K steady-state read at an average latency of 161µs. On the write side of performance, things are a bit lower, but this is expected. Top sequential write speed is 565MB/s, top steady-state 4K is 20K IOPS, and latency is only 75µs.
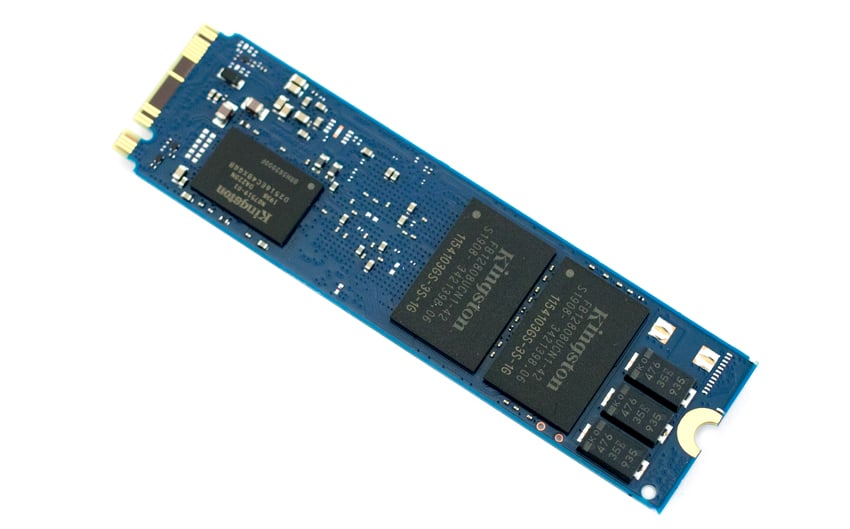
In other highlights, the drive supports SED with AES 256-bit encryption. As noted, the DC1000B has on-board Power Loss Protection to help preserve data in the event of an ungraceful power-off. And users can leverage enterprise-grade SMART tools to track reliability, usage statistics, remaining life, wear leveling, and temperature.
The Kingston DC1000B comes with a 5-year limited warranty and can be picked up for under $100 for the smaller capacity.
For those that would enjoy a video version of the review, we’ve posted this to YouTube:
Kingston DC1000B Specifications
| Form Factor | M.2, 22mm x 80mm (2280) |
| Interface | PCIe NVMe Gen 3 x 4 |
| Capacities | 240GB, 480GB |
| NAND | 3D TLC |
| Self-Encrypting Drive (SED) | AES 256-bit Encryption |
| Performance | |
| Sequential Read/Write | 240GB – 2,200MBs/290MBs 480GB – 3,200MBs/565MBs |
| Steady-State 4k Read/Write | 240GB – 111,000/12,000 IOPS 480GB – 205,000/20,000 IOPS |
| Latency Read (Avg) | 161µs |
| Latency Write (Avg) | 75µs |
| Endurance | |
| Total Bytes Written (TBW) | 240GB – 248TBW 480GB – 475TBW |
| DWPD | 240GB — 0.5 480GB — 0.5 |
| MTBF | 2 million hours |
| Power Consumption | |
| 240GB | Idle: 1.82W Average Read: 1.71W Average Write: 3.16W Max Read: 1.81W Max Write: 3.56W |
| 480GB | Idle: 1.90W Average Read: 1.74W Average Write: 4.88W Max Read: 1.81W Max Write: 5.47W |
| Physical | |
| Dimensions | 80mm x 22mm x 3.8mm |
| Weight | 240GB – 8g 480GB – 9g |
| Environmental | |
| Storage temperature | -40°C ~ 85°C |
| Operating temperature | 0°C ~ 70°C |
| Vibration operating | 2.17G Peak (7–800Hz) |
| Vibration non-operating | 20G Peak (10–2000Hz) |
| Warranty | Limited 5-year |
Performance
Testbed
Our boot-drive Enterprise SSD reviews leverage a Dell PowerEdge R740xd for synthetic benchmarks. Synthetic tests that don’t require a lot of CPU resources use the more traditional dual-processor server. In both cases, the intent is to showcase local storage in the best light possible that aligns with storage vendor maximum drive specs.
Dell PowerEdge R740xd
- 2 x Intel Gold 6130 CPU (2.1GHz x 16 Cores)
- 4 x 16GB DDR4-2666MHz ECC DRAM
- 1x PERC 730 2GB 12Gb/s RAID Card
- Add-in NVMe Adapter
- Ubuntu-16.04.3-desktop-amd64
Testing Background
The StorageReview Enterprise Test Lab provides a flexible architecture for conducting benchmarks of enterprise storage devices in an environment comparable to what administrators encounter in real deployments. The Enterprise Test Lab incorporates a variety of servers, networking, power conditioning, and other network infrastructure that allows our staff to establish real-world conditions to accurately gauge performance during our reviews.
We incorporate these details about the lab environment and protocols into reviews so that IT professionals and those responsible for storage acquisition can understand the conditions under which we have achieved the following results. None of our reviews are paid for or overseen by the manufacturer of equipment we are testing.
Houdini by SideFX
The Houdini test is specifically designed to evaluate storage performance as it relates to CGI rendering. The test bed for this application is a variant of the core Dell PowerEdge R740xd server type we use in the lab with dual Intel 6130 CPUs and 64GB DRAM. In this case, we installed Ubuntu Desktop (ubuntu-16.04.3-desktop-amd64) running bare metal. Output of the benchmark is measured in seconds to complete, with fewer being better.
The Maelstrom demo represents a section of the rendering pipeline that highlights the performance capabilities of storage by demonstrating its ability to effectively use the swap file as a form of extended memory. The test does not write out the result data or process the points in order to isolate the wall-time effect of the latency impact to the underlying storage component. The test itself is composed of five phases, three of which we run as part of the benchmark, which are as follows:
- Loads packed points from disk. This is the time to read from disk. This is single threaded, which may limit overall throughput.
- Unpacks the points into a single flat array in order to allow them to be processed. If the points do not have dependency on other points, the working set could be adjusted to stay in-core. This step is multi-threaded.
- (Not Run) Processes the points.
- Repacks them into bucketed blocks suitable for storing back to disk. This step is multi-threaded.
- (Not Run) Writes the bucketed blocks back out to disk.
We don’t expect buyers to be purchasing the Kingston DC1000B for rendering applications, but with logging and caching in mind, and the Houdini benchmark leveraging SSDs as an extension of system swap memory, we included the results for reference. The 0.5DWPD DC1000B tracked towards the back of the group (as expected) but stayed pretty close to other value-oriented offerings, which don’t include the same power-loss protection.

VDBench Workload Analysis
When it comes to benchmarking storage devices, application testing is best, and synthetic testing comes in second place. While not a perfect representation of actual workloads, synthetic tests do help to baseline storage devices with a repeatability factor that makes it easy to do apples-to-apples comparison between competing solutions. These workloads offer a range of different testing profiles ranging from “four corners” tests, common database transfer size tests, to trace captures from different VDI environments. All of these tests leverage the common vdBench workload generator, with a scripting engine to automate and capture results over a large compute testing cluster. This allows us to repeat the same workloads across a wide range of storage devices, including flash arrays and individual storage devices. Our testing process for these benchmarks fills the entire drive surface with data, then partitions a drive section equal to 5% of the drive capacity to simulate how the drive might respond to application workloads. This is different than full entropy tests which use 100% of the drive and take them into steady state. As a result, these figures will reflect higher-sustained write speeds.
Profiles:
- 4K Random Read: 100% Read, 128 threads, 0-120% iorate
- 4K Random Write: 100% Write, 64 threads, 0-120% iorate
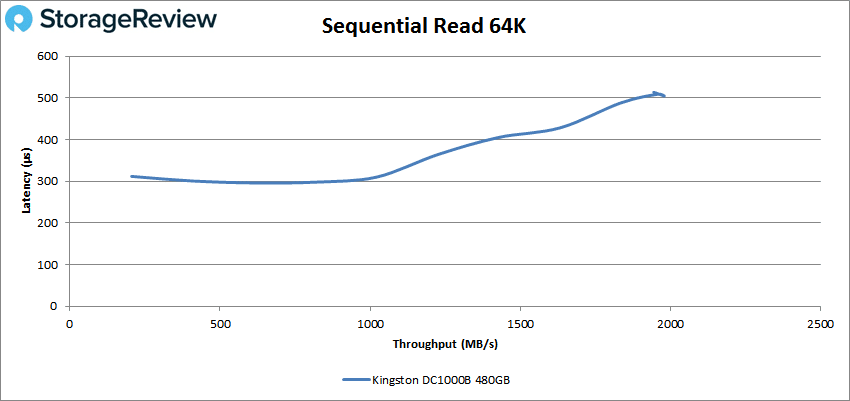
- 64K Sequential Read: 100% Read, 16 threads, 0-120% iorate
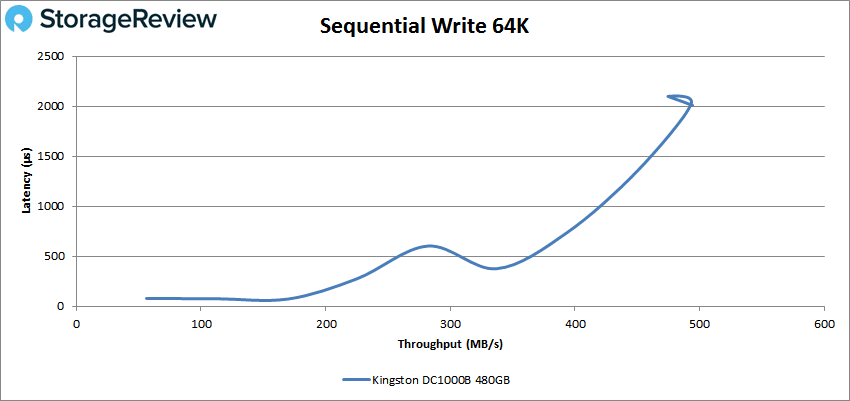
- 64K Sequential Write: 100% Write, 8 threads, 0-120% iorate
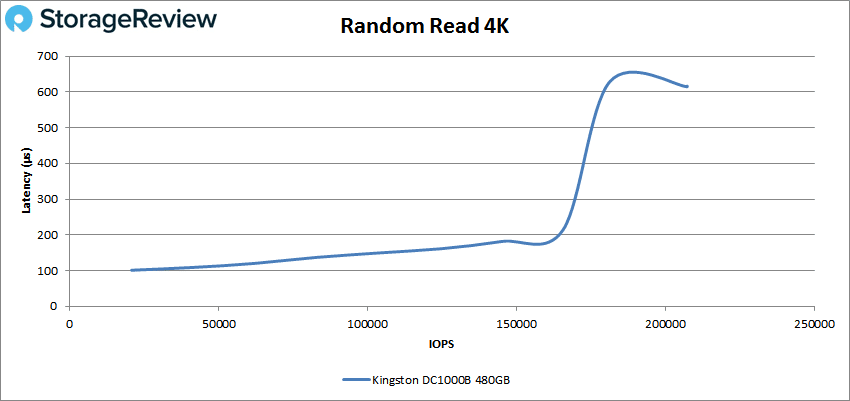
With our random 4K read the Kingston DC1000B started off right at about 100µs and stayed low for a bit before shooting up in latency to peak at 207,369 IOPS with a latency of 614.7µs.
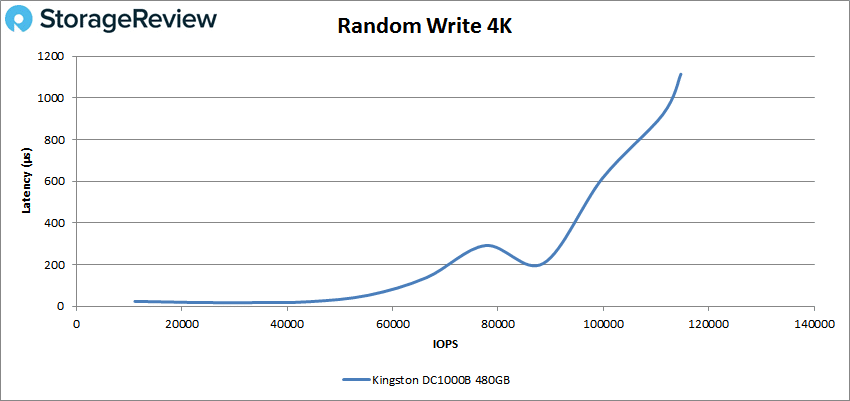
For 4K random write the DC1000B started with very low latency 24.1µs at 11,092 IOPS before going on to peak at 114,705 IOPS at 1.11ms.
Switching over to sequential workloads, the DC1000B peaked at 31,659 IOPS or 1.98GB/s at a latency of 504.7µs in our 64K read test.
For 64K sequential write the DC1000B maintained sub-millisecond latency until about 6,800 IOPS or 430MB/s and peaked at 7,909 IOPS or 494MB/s at 2ms of latency.
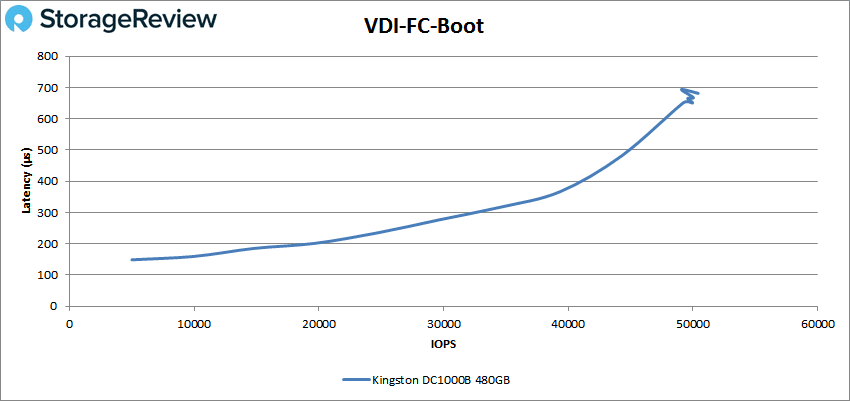
Next, we looked at our VDI benchmarks, which are designed to tax the drives even further. These tests include Boot, Initial Login, and Monday Login. Looking at the Boot test, the DC1000B peaked at 50,427 at a latency of 681.4µs.
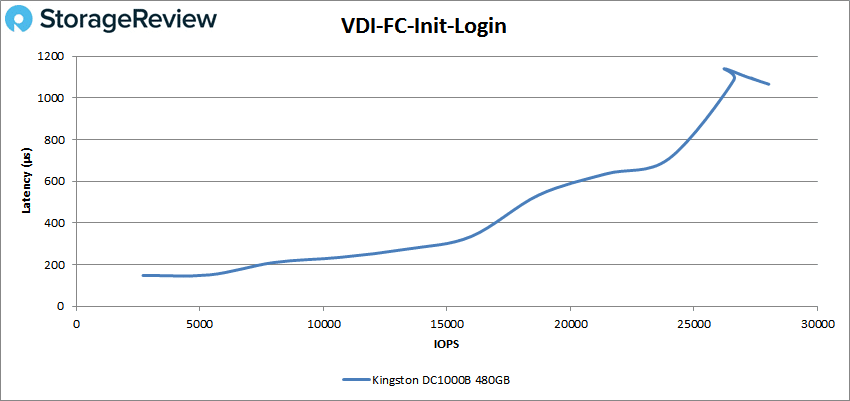
For VDI Initial Login the drive peaked at 28,018 IOPS with a latency of 1.1ms.
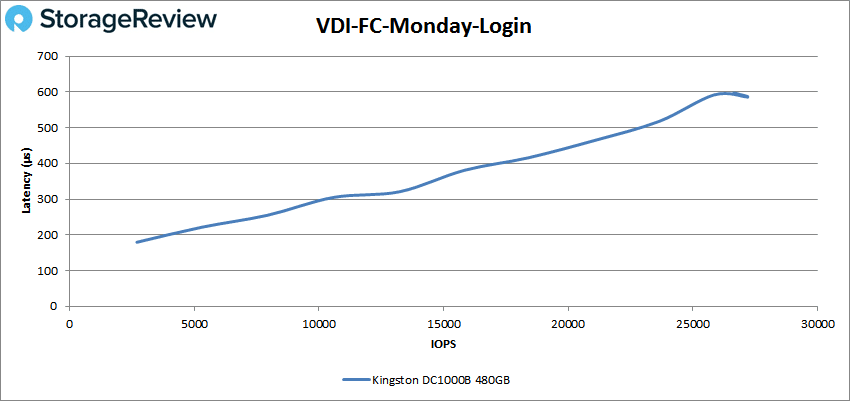
Finally for VDI Monday Login the DC1000B peaked at 27,167 IOPS with a latency of 586.1µs.
Conclusion
While other vendors are battling out IOPS and latency points, Kingston is carving out niche products in an established SSD market. The Kingston DC1000B is yet another addition, this time an SSD designed specifically for server boot, though it can be used for caching and logging applications as well. Being a boot specific drive, the performance is geared more around reads with quoted speeds of 3.2GB/s and throughput of 205K IOPS. The drive supports SED, has on-board power loss protection, and allows users to take advantage of enterprise-grade SMART tools.
For performance we tested the drive with a smaller partition footprint, similar to a client SSD, which we feel is pretty close to how the drive would be leveraged in its intended setting. We also tested the drive alone as we don’t have any other NVMe drives that were designed for this task. The drive did fairly well in our test with peaks of 207K IOPS read and 115K IOPS write in random 4K and 1.98GB/s read and 430MB/s write in 64K sequential. In our VDI workloads the DC1000B hit 50K IOPS in boot, 28K IOPS in Initial Login, and 27K IOPS in Monday Login.
The Kingston DC1000B allows users to have a cost-effective, zero footprint boot drive to their server, leaving drive bays open for higher-performing real estate. The DC1000B can be picked up for under $100 and provides plenty of performance to fit the roll of boot, logging or perhaps even read caching.


 Amazon