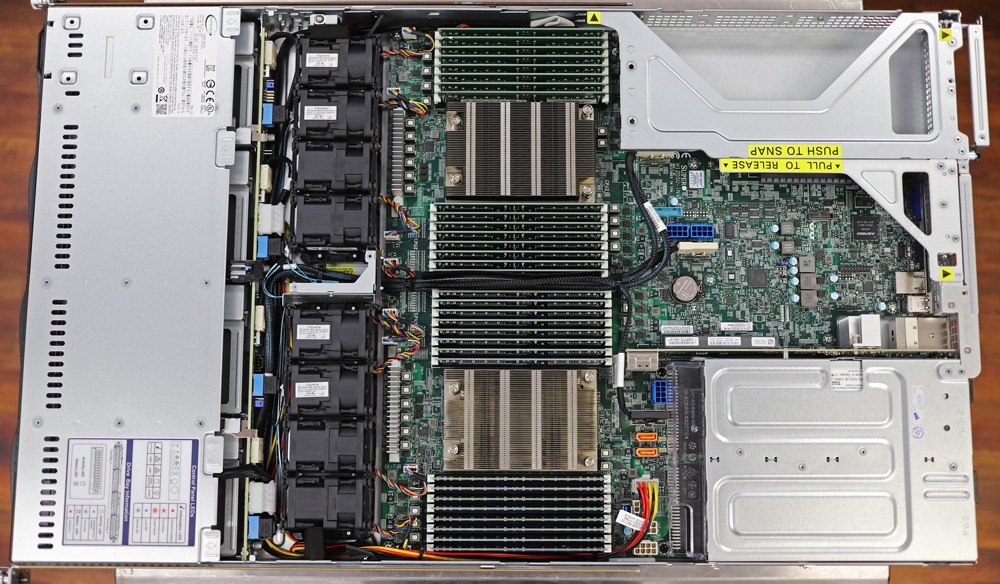
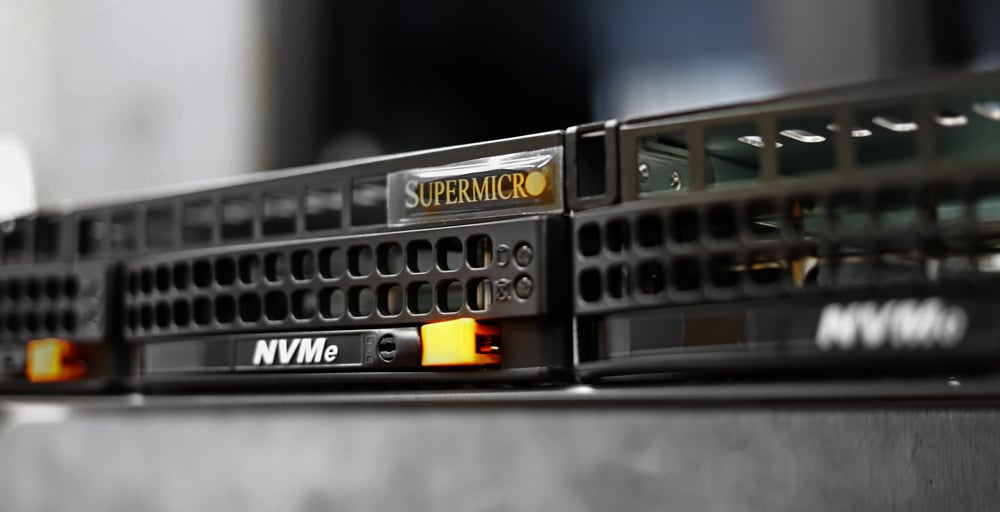
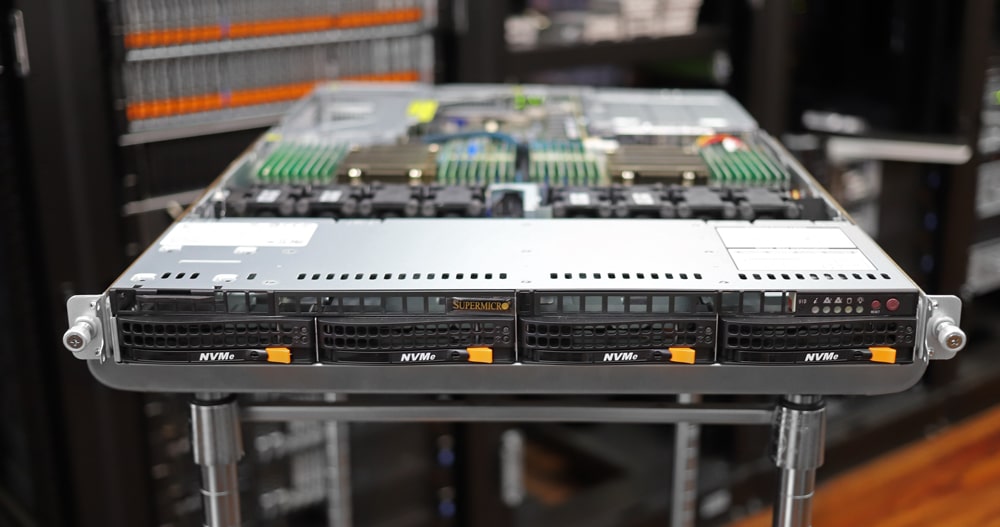
The Supermicro 1024US-TRT is a 1U server from the company’s A+ Ultra family. The server is ideal for organizations who need a performance-driven solution that can excel in dense compute use cases. Coupled with its extensive networking options, the 1024US-TRT features an H12DSU-iN motherboard inside the SC819UTS-R1K02P-A chassis, the former which is highlighted by its dual-socket support for AMD EPYC (Milan) series processors, upwards of 8TB of ECC DDR4 3200MHz SDRAM using 32 DIMM slots, and PCI Gen4 expansion slots.
The Supermicro 1024US-TRT is a 1U server from the company’s A+ Ultra family. The server is ideal for organizations who need a performance-driven solution that can excel in dense compute use cases. Coupled with its extensive networking options, the 1024US-TRT features an H12DSU-iN motherboard inside the SC819UTS-R1K02P-A chassis, the former which is highlighted by its dual-socket support for AMD EPYC (Milan) series processors, upwards of 8TB of ECC DDR4 3200MHz SDRAM using 32 DIMM slots, and PCI Gen4 expansion slots.
Supermicro 1024UT vs. 1023US
Just earlier this year, we reviewed a very similar version of this server in the 1023US-TR4. The 1023US leveraged the EPYC 7002 family, code-named AMD Rome. With the 1024US, Supermicro of course now supports EPYC 7003 CPUs, commonly dubbed AMD Milan. AMD’s new line of processors is a significant upgrade from the previous generation.
Despite being 1U, the Supermicro 1024US-TRT supports a 280W TDP, meaning it is able to leverage the breadth of the AMD family. This includes the top-line 64 core EPYC 7763, or perhaps some of the more VMware licensing-friendly 32-core CPUs like the EPYC 75F3.
For storage, the Supermicro 1024US-TRT features the same configuration options as the 1023-TR4 (3.5″ hot-swap drive bays that can be populated with SATA, SAS, or NVMe SSDs). Supermicro continues with its unique mixture of 3.5″ bays and NVMe to give users as much flexibility for system builds as they can. This particular 4-bay config assumes that the server itself will largely be leveraging shared storage to bring its AMD cores to bear. That said, if CPU proximity is an issue, the bays can leverage a decent data footprint with high-capacity NVMe SSDs or, gasp, HDDs.
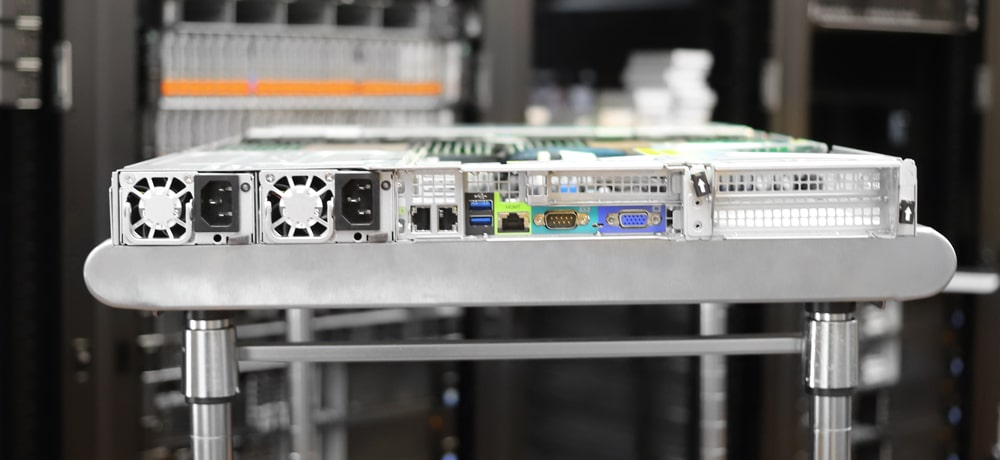
The other noticeable changes between the 1023US and the 1024US are on the back of the chassis. The 1024US swaps the 4 1GbE networking ports from the 1023US for two built-in 10GbE ports. The 1024US also gets a PCIe backplane upgrade as well. It now supports three x16 ports where the 1023US only had two x16, with a single x8.
Our review model is outfitted with four Intel P5510 3.84 PCIe Gen 4 NVMe SSDs, AMD EPYC 7713 processors (64 core), and 512GB of DDR4 RAM. For boot we leveraged a 64GB SATADOM.
Supermicro 1024US-TRT Specifications
| Processor/Chipset | ||
| CPU |
|
|
| Cores |
|
|
| Chipset |
|
|
| System Memory | ||
| Memory Capacity |
|
|
| Memory Type |
|
|
| DIMM Sizes |
|
|
| Memory Voltage |
|
|
| Error Detection |
|
|
| On-Board Devices | ||
| VGA |
|
|
| Expansion Slots | ||
| 1U |
|
|
| Input / Output | ||
| SATA |
|
|
| LAN |
|
|
| USB |
|
|
| VGA |
|
|
| SAS |
|
|
| NVMe |
|
|
| Others |
|
|
| System BIOS | ||
| BIOS Type |
|
|
| BIOS Features |
|
|
| Chassis | ||
| Form Factor |
|
|
| Model |
|
|
| Dimensions | ||
| Height |
|
|
| Width |
|
|
| Depth |
|
|
| Weight |
|
|
| Front Panel | ||
| Buttons |
|
|
| LEDs |
|
|
| Drive Bays | ||
| Hot-swap |
|
|
| Backplane | ||
| HDD Backplane |
|
|
| System Cooling | ||
| Fans |
|
|
| Air Shroud |
|
|
| Power Supply | ||
| 1000W Redundant Power Supplies with PMBus | ||
| Total Output Power |
|
|
| Dimension (W x H x L) |
|
|
| Input |
|
|
| +12V |
|
|
| 12Vsb |
|
|
| Output Type |
|
|
| Certification | Titanium Level | |
| PC Health Monitoring | ||
| CPU |
|
|
| FAN |
|
|
| Temperature |
|
|
| LED |
|
|
| Other Features |
|
|
| Operating Environment / Compliance | ||
| RoHS |
|
|
| Environmental Spec. |
|
|
Supermicro 1024US-TRT Design and Build
The 1024US-TRT uses a tool-less rail system design like most other Supermicro systems. We had no trouble mounting the system, as each end of the rail is equipped with square pegs that easily fit into the rack.
The control panel is located on the right side of the front panel and consists of a power on/off button, a reset button, and six status LEDs: Power, HDD, 2x NIC, information status, and UID indicators. Taking up the rest of the front panel’s real estate, and running along the bottom, are the four hot-swap 3.5-inch bays for SATA, NVME, and SAS drives. You can also add an optical drive to the right of the service/asset tag if needed.
All of the connectivity is located on the back panel of the chassis, in addition to the redundant power supply modules. From left to right are two 10GBase-T ports, two USB 3.0 ports, a dedicated LAN port for IPMI, a serial port, a UID indicator and button (which toggle the UID indicators), a VGA port, and three x16 PCI expansion slots (one PCI-E low profile slot and two PCI-E full height, 9.5″ length slots).
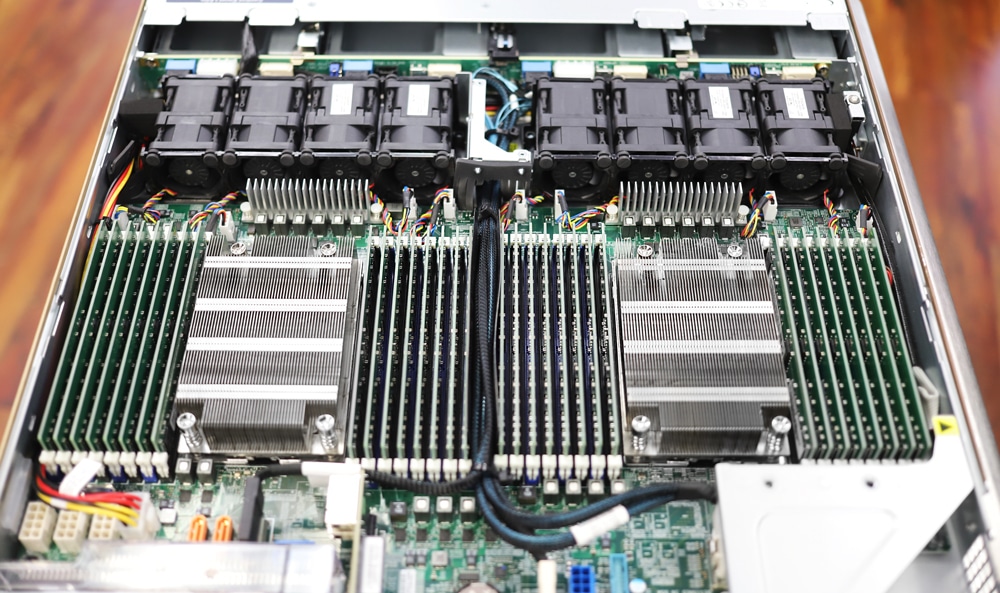
To access the internal components of the H12DSU-iN motherboard, simply remove the top cover by pressing the two release buttons and then sliding the cover off (pushing towards the back of the server). Like servers from the A+ line, the 1024US-TRT has an intelligently laid-out design with plenty of space for airflow.
At the front, you will see the eight heavy-duty PWM fans (with optimal fan speed control), which help keep the system running smoothly. Next to the system fans are the 32 DIMMs, which support up to DDR4 3200 MHz Registered ECC of RAM and surround the dual EPYC 7200 series CPUs (7003 Series processor require an update to BIOS version 2.0 or newer for drop-in support). Toward the back of the motherboard are the redundant 800W/1000W titanium level PSUs.
Supermicro 1024US-TRT Performance
Supermicro 1024U-TRT configuration:
- Intel P5510 3.84 PCIe Gen 4 NVMe SSDs
- AMD EPYC 7713 processor (64 core)
- 512GB DDR4 RAM
- 64GB SATADOM Boot
SQL Server Performance
StorageReview’s Microsoft SQL Server OLTP testing protocol employs the current draft of the Transaction Processing Performance Council’s Benchmark C (TPC-C), an online transaction processing benchmark that simulates the activities found in complex application environments. The TPC-C benchmark comes closer than synthetic performance benchmarks to gauging the performance strengths and bottlenecks of storage infrastructure in database environments.
Each SQL Server VM is configured with two vDisks: 100GB volume for boot and a 500GB volume for the database and log files. From a system resource perspective, we configured each VM with 16 vCPUs, 64GB of DRAM and leveraged the LSI Logic SAS SCSI controller. While our Sysbench workloads tested previously saturated the platform in both storage I/O and capacity, the SQL test looks for latency performance.
SQL Server Testing Configuration (per VM)
- Windows Server 2012 R2
- Storage Footprint: 600GB allocated, 500GB used
- SQL Server 2014
-
- Database Size: 1,500 scale
- Virtual Client Load: 15,000
- RAM Buffer: 48GB
- Test Length: 3 hours
-
- 2.5 hours preconditioning
- 30 minutes sample period
For SQL Server average latency, the Supermicro 1024US-TRT saw an average of 1.5ms with 8VMs.
Sysbench MySQL Performance
Our first local-storage application benchmark consists of a Percona MySQL OLTP database measured via SysBench. This test measures average TPS (Transactions Per Second), average latency, and average 99th percentile latency as well.
Each Sysbench VM is configured with three vDisks: one for boot (~92GB), one with the pre-built database (~447GB), and the third for the database under test (270GB). From a system resource perspective, we configured each VM with 16 vCPUs, 60GB of DRAM and leveraged the LSI Logic SAS SCSI controller.
Sysbench Testing Configuration (per VM)
- CentOS 6.3 64-bit
- Percona XtraDB 5.5.30-rel30.1
- Database Tables: 100
-
- Database Size: 10,000,000
- Database Threads: 32
- RAM Buffer: 24GB
- Test Length: 3 hours
-
- 2 hours preconditioning 32 threads
- 1 hour 32 threads
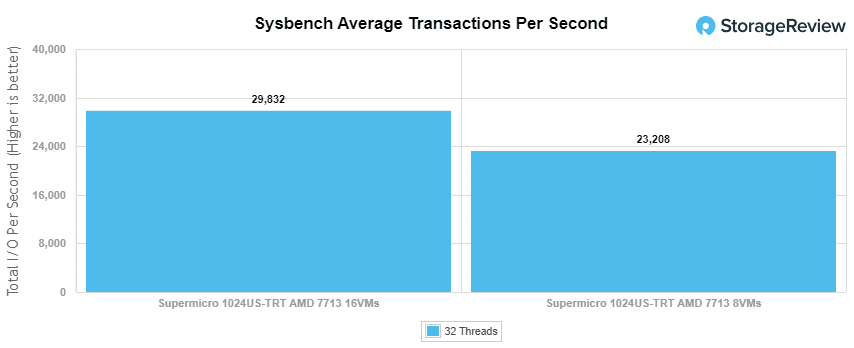
With the Sysbench OLTP, we recorded an aggregate score of 23,208 TPS for 8VMs and 29,832TPS for 16VMs.
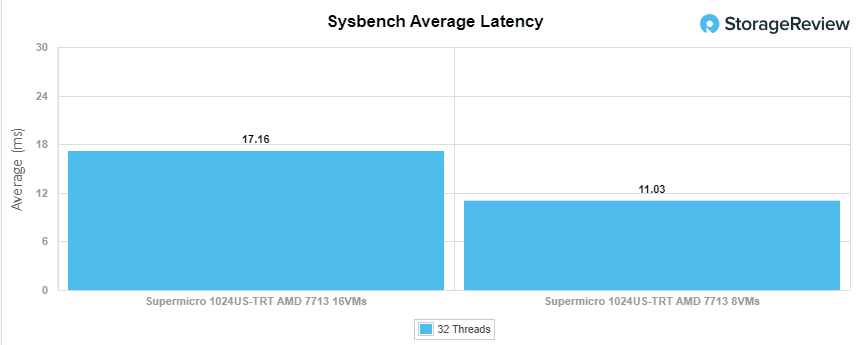
With Sysbench average latency, we saw aggregate scores of 11.03ms for 8VMs and 17.16ms for 16VMs.
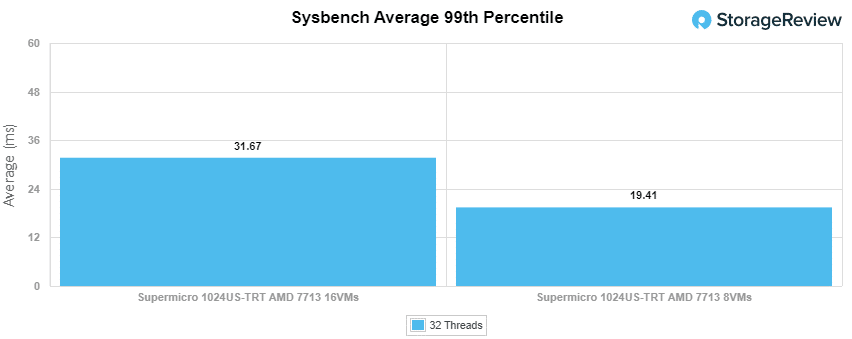
For our worst-case scenario latency (99th percentile), the Supermicro server had aggregate scores of 19.41ms for 8VMs and 31.67ms for 16VMs.
VDBench Workload Analysis
When it comes to benchmarking storage arrays, application testing is best, and synthetic testing comes in second place. While not a perfect representation of actual workloads, synthetic tests do help to baseline storage devices with a repeatability factor that makes it easy to do apples-to-apples comparison between competing solutions.
These workloads offer a range of different testing profiles ranging from “four corners” tests, common database transfer size tests, as well as trace captures from different VDI environments. All of these tests leverage the common vdBench workload generator, with a scripting engine to automate and capture results over a large compute testing cluster. This allows us to repeat the same workloads across a wide range of storage devices, including flash arrays and individual storage devices.
Profiles:
- 4K Random Read: 100% Read, 128 threads, 0-120% iorate
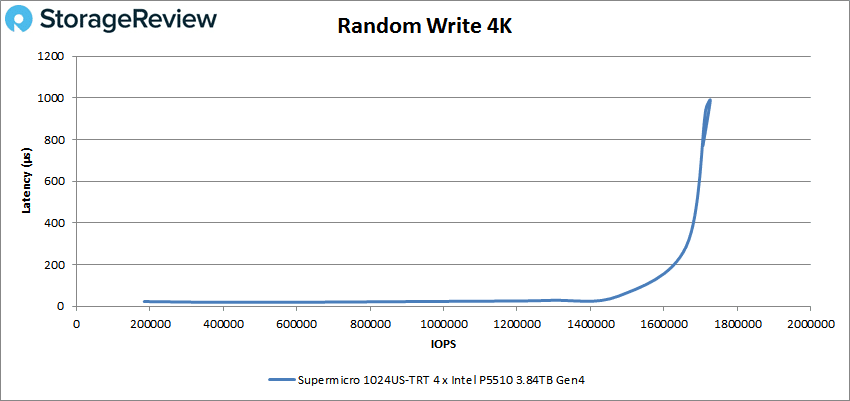
- 4K Random Write: 100% Write, 128 threads, 0-120% iorate
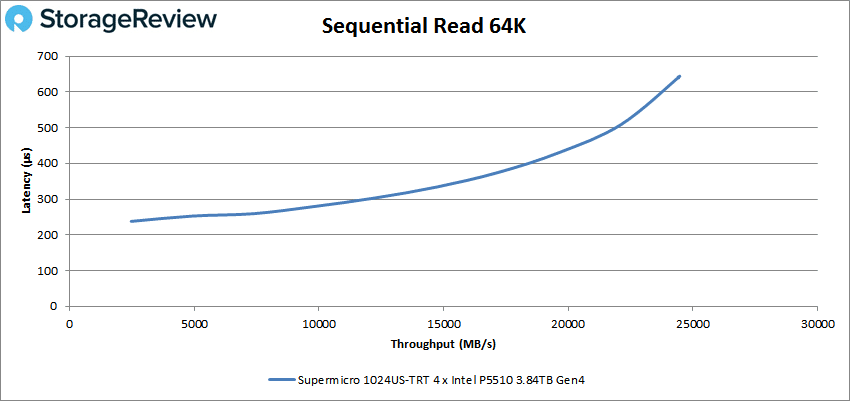
- 64K Sequential Read: 100% Read, 32 threads, 0-120% iorate
- 64K Sequential Write: 100% Write, 16 threads, 0-120% iorate
- Synthetic Database: SQL and Oracle
- VDI Full Clone and Linked Clone Traces
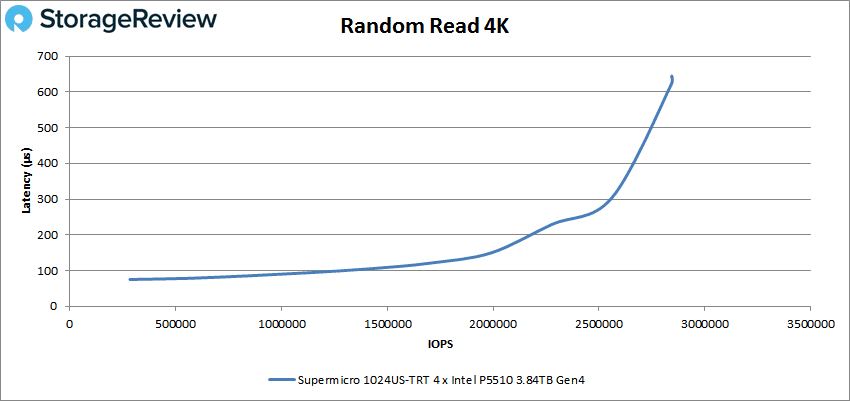
Looking at random 4K read, the Supermicro 1024US-TRT recorded below sub-millisecond latency throughout the test, starting at 283,023 IOPS at 75.2μs then peaking at 2,843,723 IOPS with 640.4μs latency.
Next is sequential workloads. For 64K sequential read, the Supermicro server began at 39,459 IOPS (4.92GB/s) at 252.8μs latency then peaked at 391,527 IOPS or 24.2GB/s at 643.9μs latency. Seeing close to 25GB/s from four SSDs is pretty slick, and a big advantage of what PCIe Gen4 brings to the table.
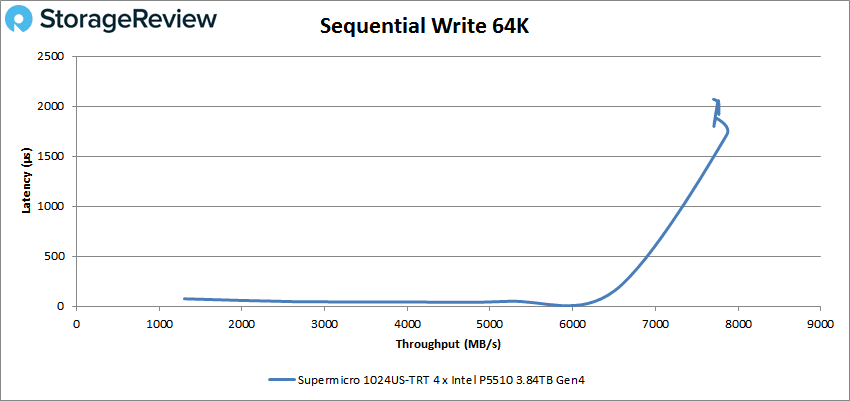
In 64K sequential write, the 1024US-TRT showed sub-millisecond latency throughout until it approached the 120K IOPS mark. It then peaked at 125,819 IOPS (or 7.86GB/s) with 1,719μs in latency before taking a hit in performance at the very end.
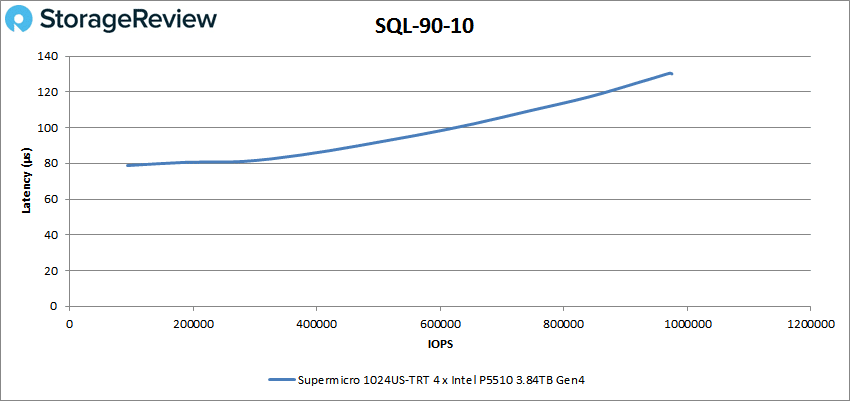
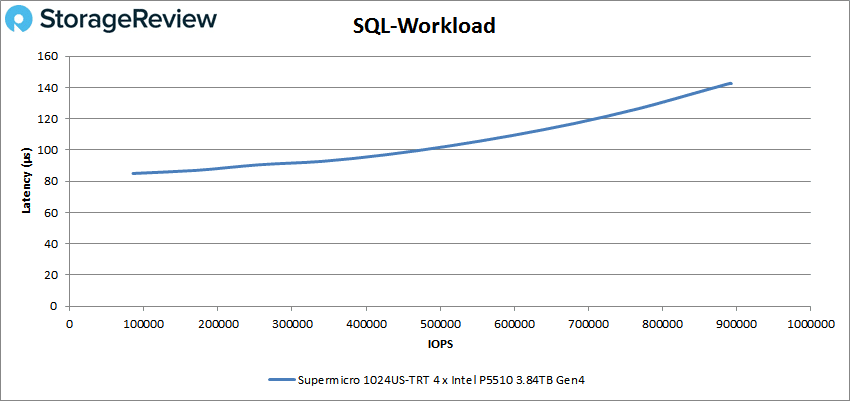
Our next set of tests are our SQL workloads: SQL, SQL 90-10, and SQL 80-20. Starting with SQL, the 1024US-TRT peaked at 892,689 IOPS with a latency of 142.5μs.
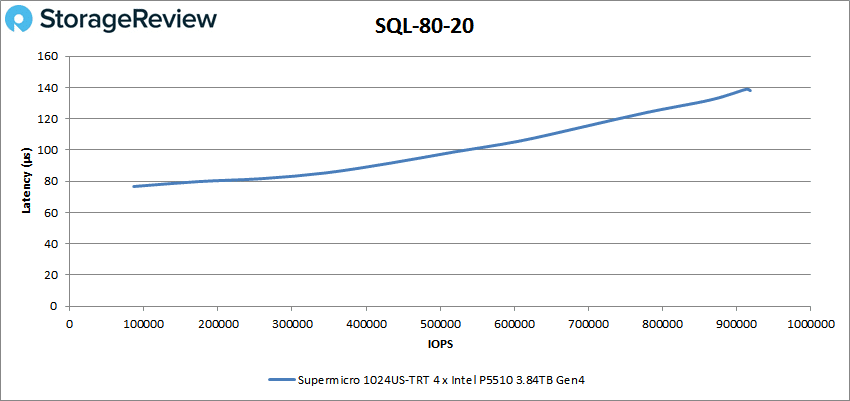
In SQL 80-20, the 1024US-TRT peaked at 918K IOPS with 138μs in latency.
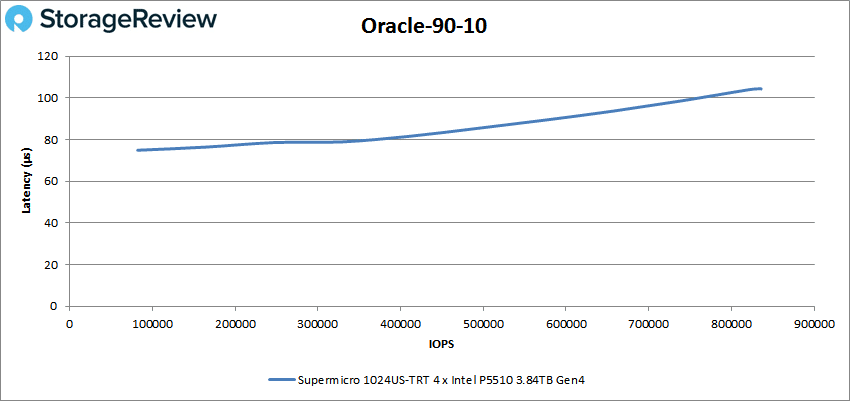
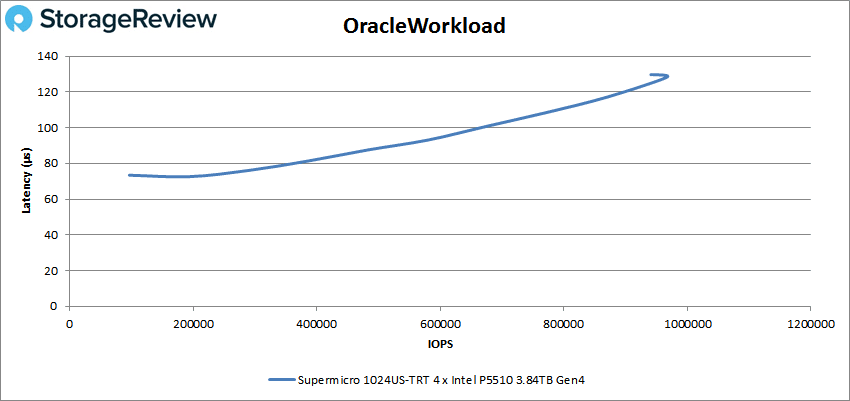
Next up are our Oracle workloads: Oracle, Oracle 90-10, and Oracle 80-20. Starting with Oracle, the 1024US-TRT started at 73.4μs while peaking at 966,601 IOPS with 128.2μs in latency before taking a slight dip in performance at the very end.
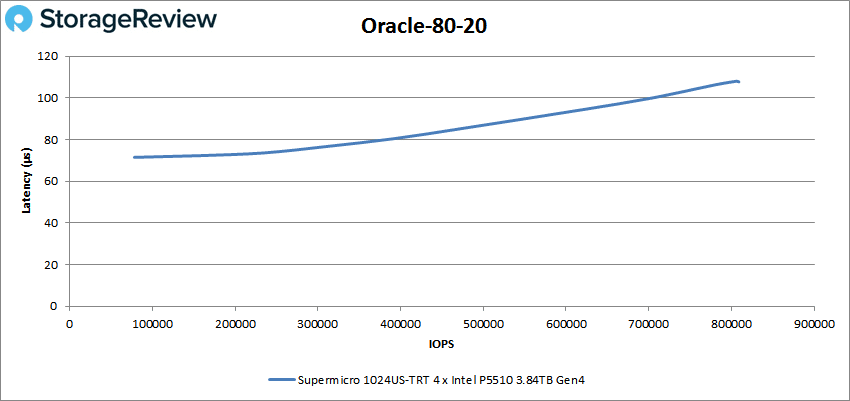
With Oracle 80-20, the 1024US-TRT began at 60,321 IOPS and a latency of 107.2μs, while peaking at 615,507 IOPS and a latency of 141.6μs.
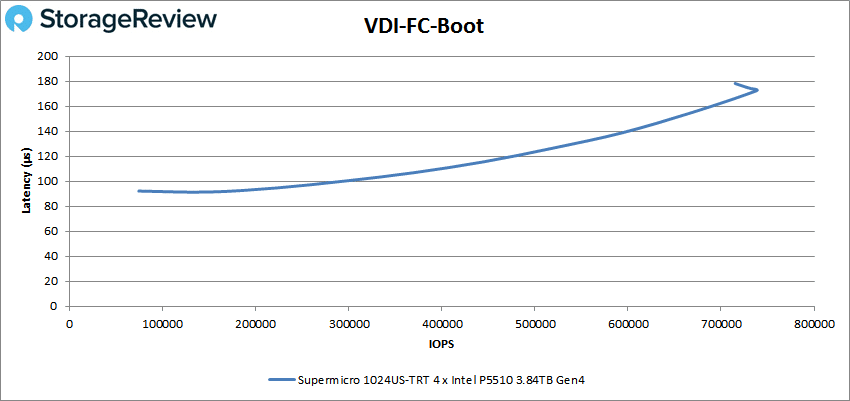
Next, we switched over to our VDI clone test, Full and Linked. For VDI Full Clone (FC) Boot, the Supermicro 1024US-TRT peaked at 738,270 IOPS at a latency of 172.5μs before taking a slight hit in performance at the very end.
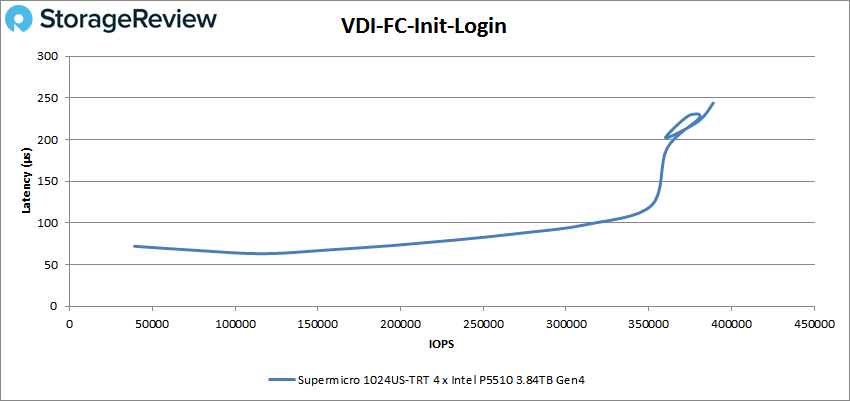
Looking at VDI FC Initial Login, the Supermicro server started at 39,100 IOPS and 72.1μs latency while peaking at 389,068 IOPS at 243.9μs latency.
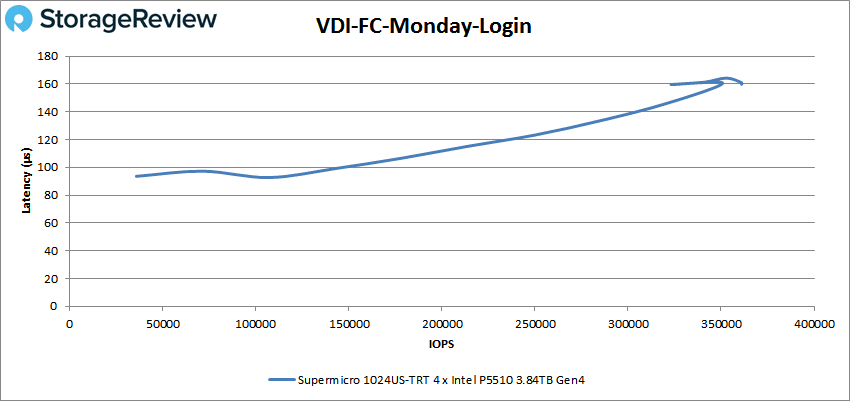
VDI FC Monday Login saw the server start at 36K IOPS and 93.6μs latency while peaking at 361K IOPS at 160μs.
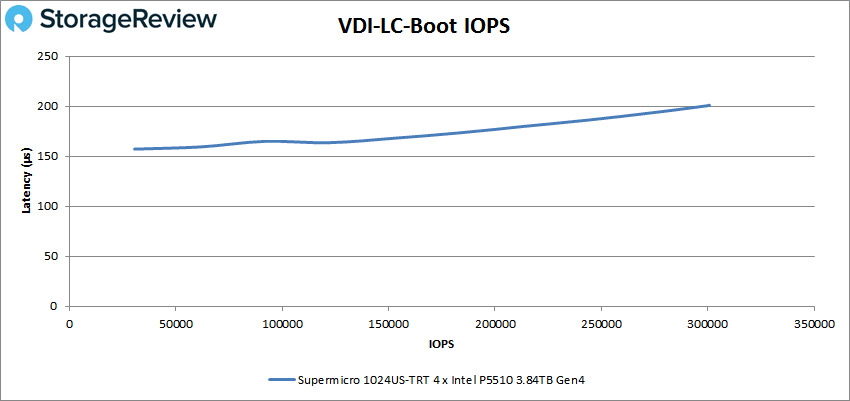
For VDI Linked Clone (LC) Boot, the Supermicro server began at 30,496 IOPS at 157.2μs latency and peaked at 300,452 IOPS at 201μs.
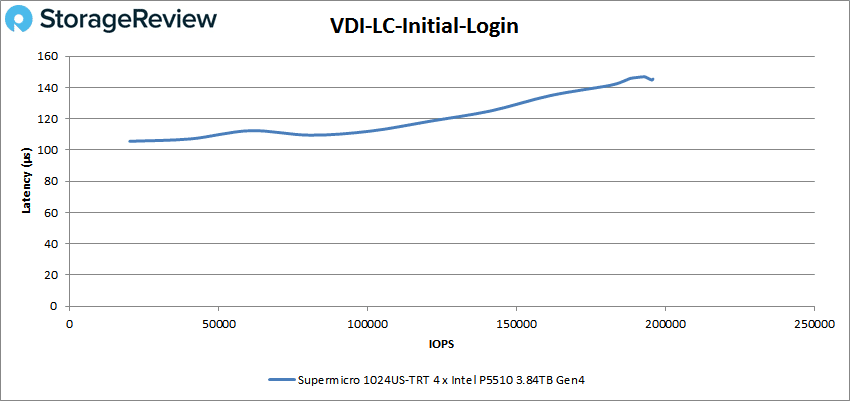
Looking at VDI LC Initial Login, the 1024US-TRT began at 20,185 IOPS with 105.6μs latency, then peaking at 195,871 IOPS with 145.4μs.
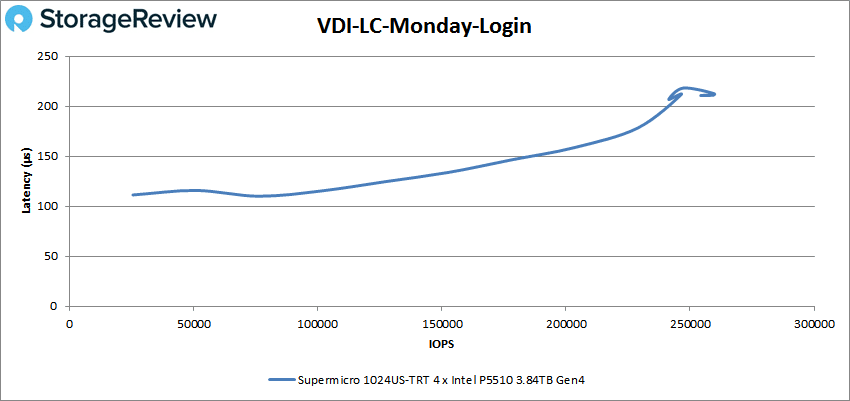
Finally, VDI LC Monday Login started at 25,500 IOPS and 111.4μs latency while peaking at 259,817 IOPS at 212.4μs (before taking a slight hit in performance at the very end).
Conclusion
The Supermicro SuperStorage 1024US-TRT is a very impressive server that is designed to excel in dense compute use cases. To accomplish this, the server can be outfitted with a range of performance-driven components, including up to dual-socket AMD EPYC 7003 series processors, 8TB Registered ECC DDR4 3200MHz SDRAM via its 32 DIMM slots and four NVMe/SAS/SATA drives via its four 3.5″ bays.
The 1024US-TRT can also be equipped with PCIe Gen4 cards via the expansion slots on the back panel (one low profile slot and two full height, 9.5″ length slots). For networking, the 1023US-TR4 features dual 10GBase-T LAN ports and an RJ45-dedicated IPMI LAN port.
Looking at our Application Workload Analysis result first, we recorded an aggregate of 1.5ms for SQL Server average latency. With Sysbench, we saw transactional aggregate scores of 23,208 TPS for 8VMs and 29,832TPS for 16VMs, while average latency gave us aggregate scores of 11.03ms for 8VMs and 17.16ms for 16VMs. Lastly, the worst-case scenario recorded 19.41ms for 8VMs and 31.67ms for 16VMs.
With our VDBench Workload Analysis, the server was populated with four Intel P5510 3.84 PCIe Gen 4 NVMe SSDs, which are specifically designed for data center workloads and similar environments. Here the Supermicro 1024US-TRT showed some pretty impressive results with peak highlights that include 2.8 million IOPS for 4K read, 1.6 million IOPS for 4K write, 24.2GB/s for 64k sequential read, and 7.86GB/s for 64k sequential write.
With our SQL workloads, the Supermicro sever saw peaks of 892,689 IOPS, 975,102 IOPS for 90-10, and 918K IOPS for 80-20. With Oracle, we saw peaks of 966,601 IOPS, 836K IOPS with 90-10, and 615,507 IOPS for 80-20. The 1024US-TRT continued to show us great performance numbers during our VDI clone test as well. For Full Clone, the Supermicro server recorded peaks of 738,270 IOPS in boot, 389,068 IOPS in Initial Login, and 361K IOPS for Monday Login. For Linked Clone, we saw 300,452 IOPS for boot, 195,871 IOPS for Initial Login, and 259,817 IOPS for Monday Login.
The Supermicro 1024US-TRT showed us great performance and a ton of flexibility for a 1U server during our tests. You might have noticed that results were very similar to the 1023-TR4; however, the 1024-TRT was delivering these numbers with lower clock speed cores. So if you’re looking for greater performance, you will certainly find it by outfitting the server with higher-end AMD Milan (EPYC 7003) models. That said, it clearly demonstrates to us that the progression of AMD’s new processors looks pretty good considering they deliver the same performance as the top-of-the-line Rome models (EPYC 7002).
Though 1024US-TRT offers a decent amount of storage with high-capacity NVMe SSDs or HDDs, those looking for a denser solution should look for Supermicro’s larger options. Overall, however, the Supermicro server takes full advantage of its new technology and will certainly deliver the performance needed in a range of enterprise and SMB environments.
Supermicro 1024US-TRT Product Page
Engage with StorageReview
Newsletter | YouTube | LinkedIn | Instagram | Twitter | Facebook | TikTok | RSS Feed

