
 As with most SSD reviewers, StorageReview is typically sent a 240GB capacity drive from a new family of SSDs for review. There are several reasons for this, but in the SandForce world, it’s generally because the 240GB capacity is the fastest due to NAND die configuration. Once the 240GB review is complete, we try to come back and get the more mainstream 120GB capacity as well, due to its favorable price point. These reviews, while detailed and informative, don’t analyze an entire families’ scope of performance though. That’s the purpose of this review, as we examine the entire line of Corsair’s Force Series GT SSD family. We’re breaking down the entire performance profile of all capacities the GT comes in to finally get a clear picture of not just the GT’s performance profile, but the SandForce SF-2281 controller coupled with 25nm synchronous NAND as well.
As with most SSD reviewers, StorageReview is typically sent a 240GB capacity drive from a new family of SSDs for review. There are several reasons for this, but in the SandForce world, it’s generally because the 240GB capacity is the fastest due to NAND die configuration. Once the 240GB review is complete, we try to come back and get the more mainstream 120GB capacity as well, due to its favorable price point. These reviews, while detailed and informative, don’t analyze an entire families’ scope of performance though. That’s the purpose of this review, as we examine the entire line of Corsair’s Force Series GT SSD family. We’re breaking down the entire performance profile of all capacities the GT comes in to finally get a clear picture of not just the GT’s performance profile, but the SandForce SF-2281 controller coupled with 25nm synchronous NAND as well.
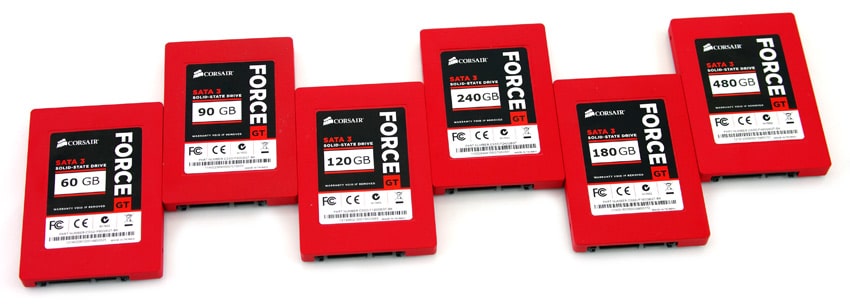
We’re not going to spend a good deal of time on the back-story of the Corsair Force GT, at this point it’s a well known drive. We’ve reviewed the 120GB and 240GB capacities in great detail already. The aim here is to illustrate the performance curve when we analyze the entire family as a whole, which includes 60GB, 90GB, 120GB, 180GB, 240GB and 480GB capacities. While it could be argued that there’s not enough price difference at the lower end to justify so many options, the bottom line is that it’s not terribly onerous to make drives in all of these capacities. Further, the consumer gets more choice, being able to step up in smaller increments as budget allows.
The curious thing from our perspective is performance. If a consumer can make an argument to step from the 60GB to 90GB Force GT because the price delta is so minor, are there implications on performance as well? The spec sheets look pretty similar across the board, a few MB/s here and there when looking at top line burst performance. But what happens when we apply our entire suite of performance benchmarks, including rigorous steady state tests, to all six SSDs? Let’s dive into the results to find out.
Corsair Force GT Specifications
- Capacities:
- 60GB – CSSD-F60GBGT-BK
- Max Read: up to 555MB/s
- Max Write: up to 495MB/s
- Random Write 4KB: 80,000 IOPS
- 90GB – CSSD-F90GBGT-BK
- Max Read: up to 555MB/s
- Max Write: up to 505MB/s
- Random Write 4KB: 85,000 IOPS
- 120GB – CSSD-F120GBGT-BK
- Max Read: up to 555MB/s
- Max Write: up to 515MB/s
- Random Write 4KB: 85,000 IOPS
- 180GB – CSSD-F180GBGT-BK
- Max Read: up to 555MB/s
- Max Write: up to 525MB/s
- Random Write 4KB: 85,000 IOPS
- 240GB – CSSD-F240GBGT-BK
- Max Read: up to 555MB/s
- Max Write: up to 525MB/s
- Random Write 4KB: 85,000 IOPS
- 480GB – CSSD-F480GBGT-BK
- Max Read: up to 540MB/s
- Max Write: up to 455MB/s
- Random Write 4KB: 55,000 IOPS
- 60GB – CSSD-F60GBGT-BK
- LSI SandForce SF-2281 and SF-2282 Controller
- 25nm Synchronous MLC NAND
- Interface SATA 6Gb/s
- Form Factor 2.5” (9mm)
- Power
- Voltage 5V ±5%
- Active – 2.5W Max
- Idle – 0.6W Max
- Environmental
- Operating Temperature – 0C to +70C
- Operating Humidity – 10% to 90% RH (0° to +40° C)
- Maximum Operating Altitude – 3,048 m (up to 10,000 ft.)
- Shock – 1500 G
- S.M.A.R.T. Support
- MTBF – 2,000,000 hours
- Warranty – Three years
Synthetic Benchmarks
The Corsair Force GT family uses synchronous MLC NAND, a SandForce SF-2281 or SF-2282 controller and a 6.0Gb/s SATA interface; our review units are 60GB, 90GB, 120GB, 180GB, 240GB, and 480GB. The comparables used for this review include the following SSDs: 60GB Corsair Force GT (60GB, SandForce SF-2281, Micron 25nm NAND, SATA), 90GB Corsair Force GT (90GB, SandForce SF-2281, Micron 25nm NAND, SATA), 120GB Corsair Force GT (120GB, SandForce SF-2281, Micron 25nm NAND, SATA), 180GB Corsair Force GT (180GB, SandForce SF-2282, Micron 25nm NAND, SATA), 240GB Corsair Force GT (240GB, SandForce SF-2281, Micron 25nm NAND, SATA), 480GB Corsair Force GT (480GB, SandForce SF-2282, Micron 25nm NAND, SATA). All IOMeter figures are represented as binary figures for MB/s speeds. All SSDs were tested on our client testing platform.
We start off with measuring peak sequential read and write performance using IOMeter with a large-block transfer. For the sake of easy comparison, we broke out repeating and random values into different charts.
![]()
![]()
Even though the Corsair Force GT 480GB SSD had the lowest rated read and write speeds, it still led the pack in both read and write speeds in our sequential transfer test.
Our next test sticks with the same large-block transfer but switches from sequential to random transactions.
![]()
![]()
In a large-block random transfer setting, the 240GB model took the lead, maintaining the strongest performance with both repeating and incompressible data.
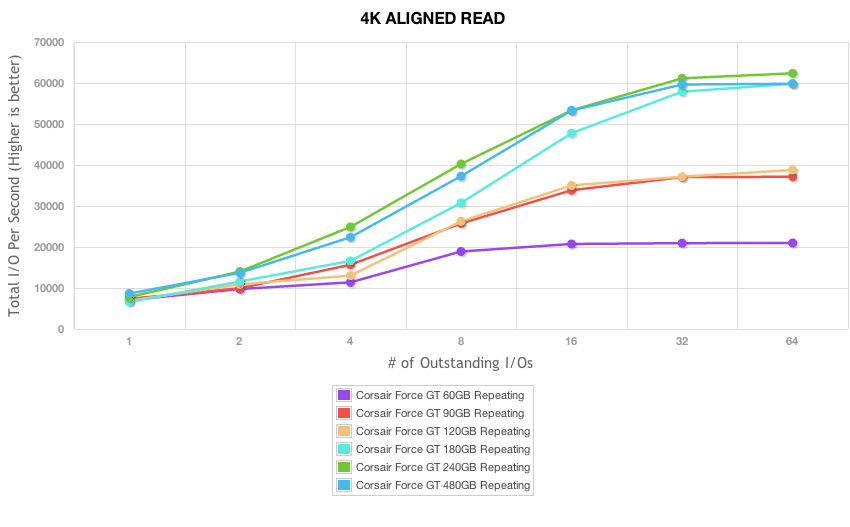
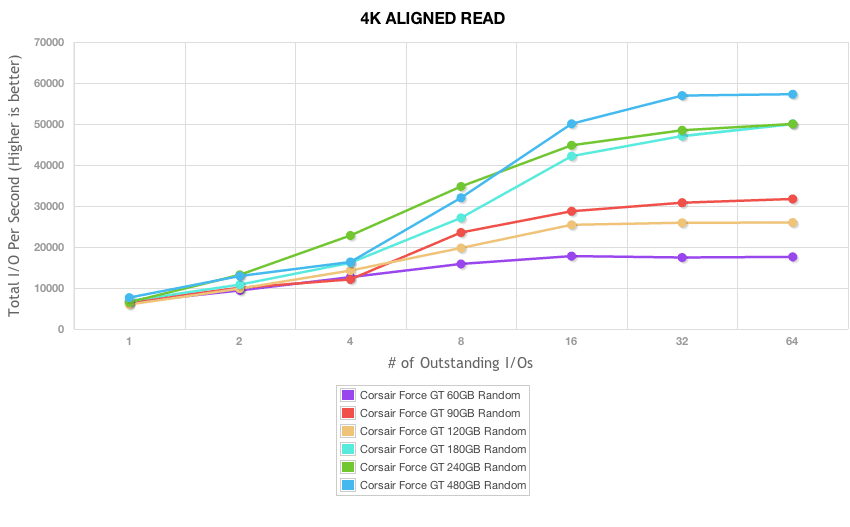
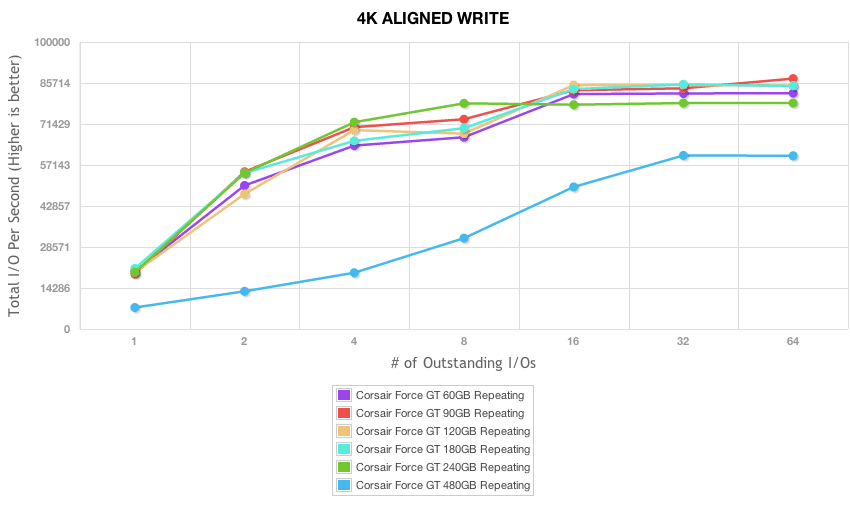
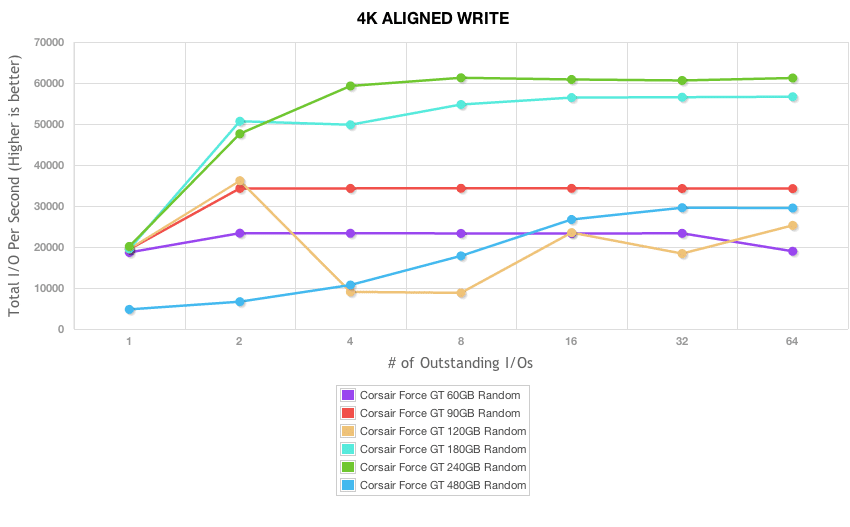
With the bread and butter of SSDs being their 4K random I/O speed, we look at low-queue depth performance, as well as expanded performance to see how well performance scales under higher queue depths.
![]()
![]()
![]()
![]()
In terms of fastest 4K read speeds, the 480GB Force GT came to the front of the pack, although it also offered the slowest 4K write speeds by far. Next in line the 90GB and 240GB SSDs fought over second place depending on the data being transferred; 90GB Force GT winning with repeating data and the 240GB Force GT winning with randomized data.
The next set of tests looks at expanded performance, to measure burst 4K read and write speed, as well as measure the peak I/O levels.
In our ramped 4K read and write tests, the 480GB Force GT came in near the top again in read speed, but fell behind the pack in write speed.
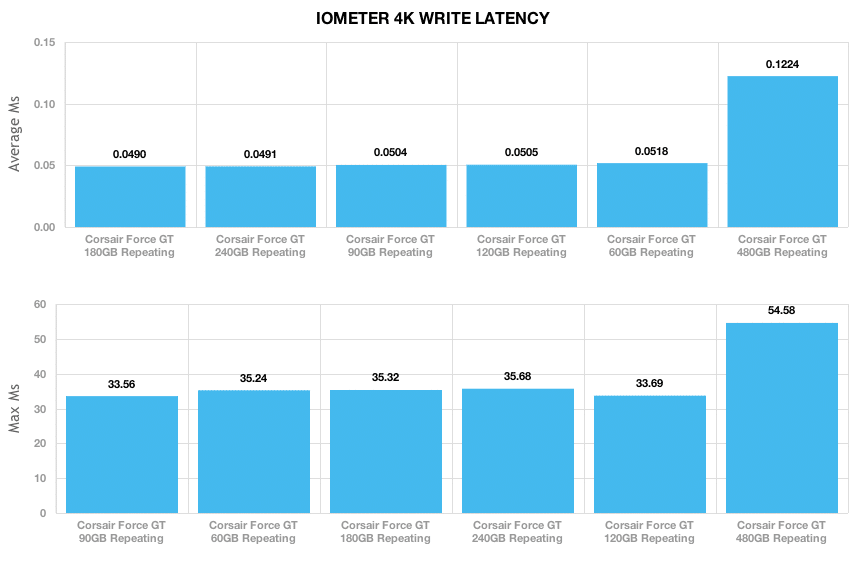
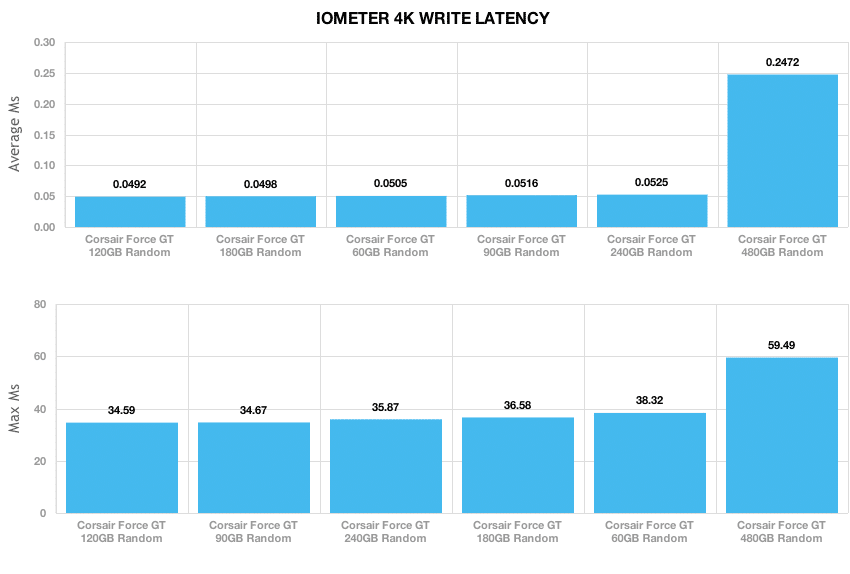
Expanding our QD1 4K test, we look at write latency of each SSD. Lower numbers are better, since it means less wait time for activity to process. Max latency is also important, although that number can change as the NAND wears over time.
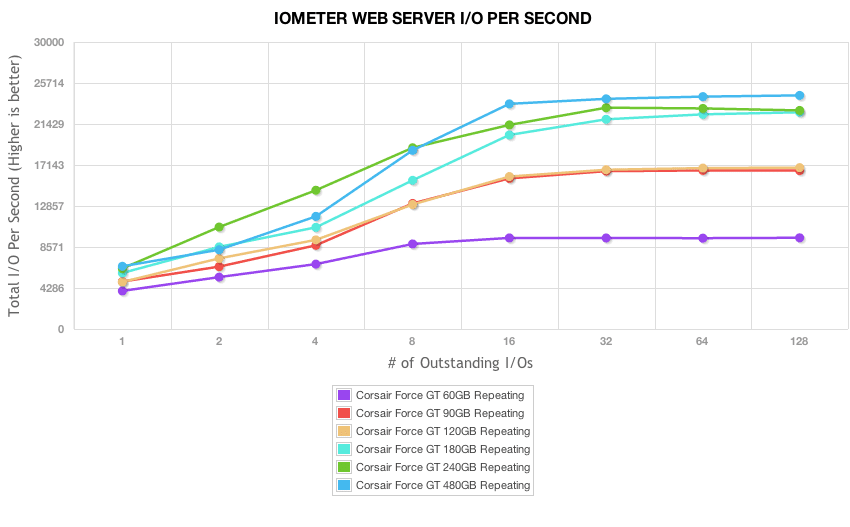
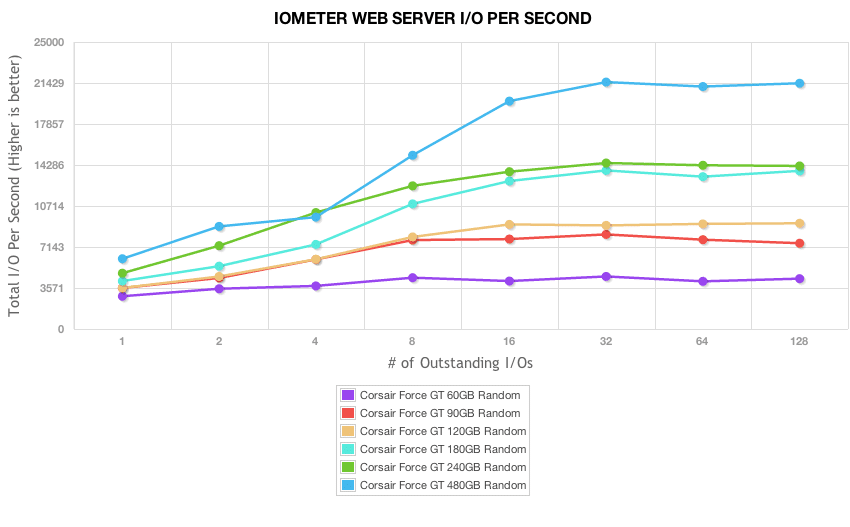
Our last group of IOMeter synthetic benchmarks looks at mixed-load server profiles including Database, Workstation, File Server, and Webserver. In a mixed workload setting the 480GB Force GT lead the pack, offering a huge lead in the read-only web server profile.
Real-World Benchmarks
For the average consumer, trying to translate random 4K write speeds into an everyday situation is pretty difficult. It helps when comparing drives in every setting possible, but it doesn’t exactly work out into faster everyday usage or better game loading times. For this reason we turned to our StorageMark 2010 traces, which include HTPC, Productivity, and Gaming traces to help readers find out how a drive might rank under their conditions.
The first real-life test is our HTPC scenario. In this test we include: playing one 720P HD movie in Media Player Classic, one 480P SD movie playing in VLC, three movies downloading simultaneously through iTunes, and one 1080i HDTV stream being recorded through Windows Media Center over a 15 minute period. Higher IOps and MB/s rates with lower latency times are preferred. In this trace we recorded 2,986MB being written to the drive and 1,924MB being read. Our second real-life test covers disk activity in a productivity scenario. For all intents and purposes this test shows drive performance under normal daily activity for most users. This test includes: a three hour period operating in an office productivity environment with 32-bit Vista running Outlook 2007 connected to an Exchange server, web browsing using Chrome and IE8, editing files within Office 2007, viewing PDFs in Adobe Reader, and an hour of local music playback with two hours of additional online music via Pandora. In this trace we recorded 4,830MB being written to the drive and 2,758MB being read.
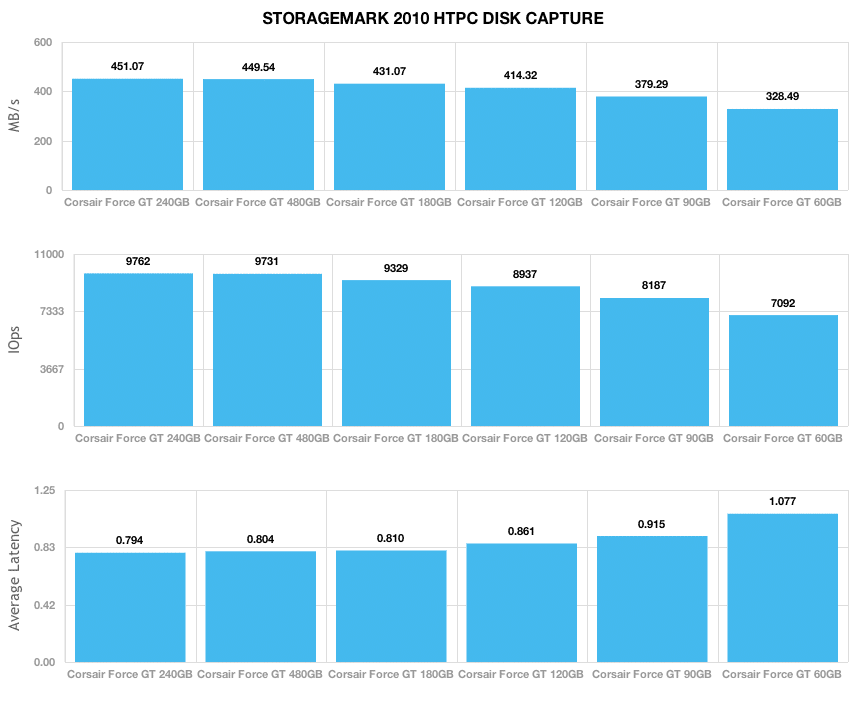
In our HTPC trace the 240GB Force GT lead the pack, trailed by the 480GB and 180GB models.
Our second real-life test covers disk activity in a productivity scenario. For all intents and purposes this test shows drive performance under normal daily activity for most users. This test includes: a three hour period operating in an office productivity environment with 32-bit Vista running Outlook 2007 connected to an Exchange server, web browsing using Chrome and IE8, editing files within Office 2007, viewing PDFs in Adobe Reader, and an hour of local music playback with two hours of additional online music via Pandora. In this trace we recorded 4,830MB being written to the drive and 2,758MB being read.
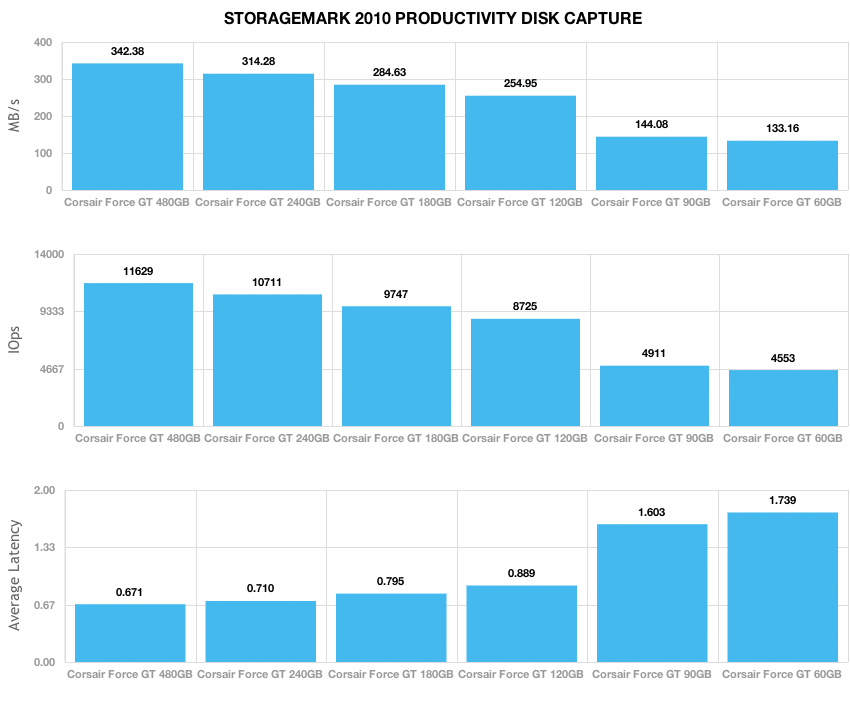
In our Productivity trace, the 480GB Force GT took the top spot, offering a strong lead over the 240GB model.
Our third real-life test covers disk activity in a gaming environment. Unlike the HTPC or Productivity trace, this one relies heavily on the read performance of a drive. To give a simple breakdown of read/write percentages, the HTPC test is 64% write, 36% read, the Productivity test is 59% write and 41% read, while the gaming trace is 6% write and 94% read. The test consists of a Windows 7 Ultimate 64-bit system pre-configured with Steam, with Grand Theft Auto 4, Left 4 Dead 2, and Mass Effect 2 already downloaded and installed. The trace captures the heavy read activity of each game loading from the start, as well as textures as the game progresses. In this trace we recorded 426MB being written to the drive and 7,235MB being read.
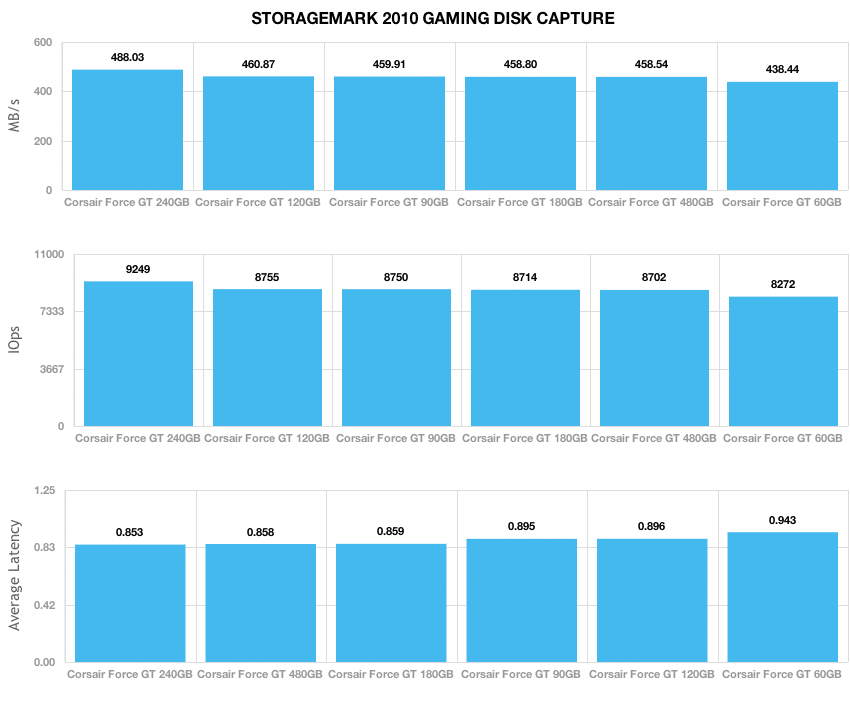
In our read-heavy Gaming trace, the entire family offered similar performance ranging from 488MB/s with the 240GB Force GT down to 438MB/s from the 60GB Force GT.
Enterprise Benchmarks
In an enterprise setting, initial burst is hardly relevant if after one hour of use the drive will never see that speed again. This is where steady state benchmarking comes in, showing how the drive performs when under a 24/7 load. For this reason, all of the following benchmarks were pre-conditioned and recorded in a steady-state mode.
We used our StorageReview Enterprise Testing Environment to benchmark the family of Corsair Force GTs; accurately representing its capabilities in an enterprise environment. The enterprise testing platform is based around a Lenovo ThinkServer RD240, equipped with dual Intel Xeon X5650 processors, running Windows Server 2008 R2. For single-drive benchmarks we connect each SSD through an LSI SAS 9211-8i HBA to measure performance without any influence of caching. All IOMeter figures are represented as binary figures for MB/s speeds. All tests are performed in steady-state. Each of our server profile tests has a strong preference towards read activity, ranging from 67% read with our database profile to 100% read in our web server profile.
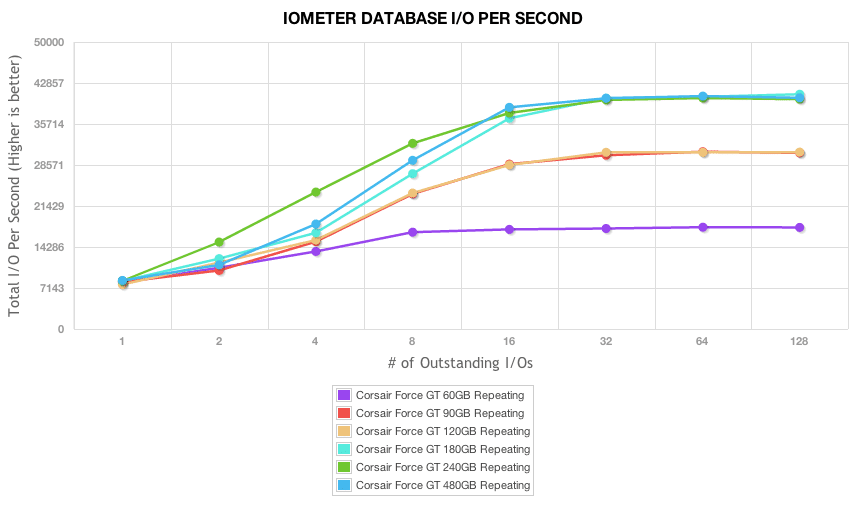
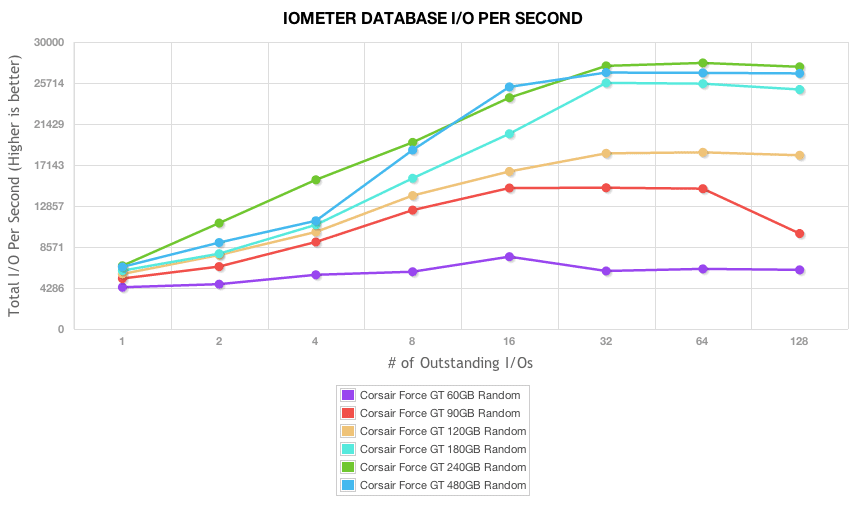
The first is our database profile, with a 67% read and 33% write workload mix primarily centered on 8K transfer sizes.
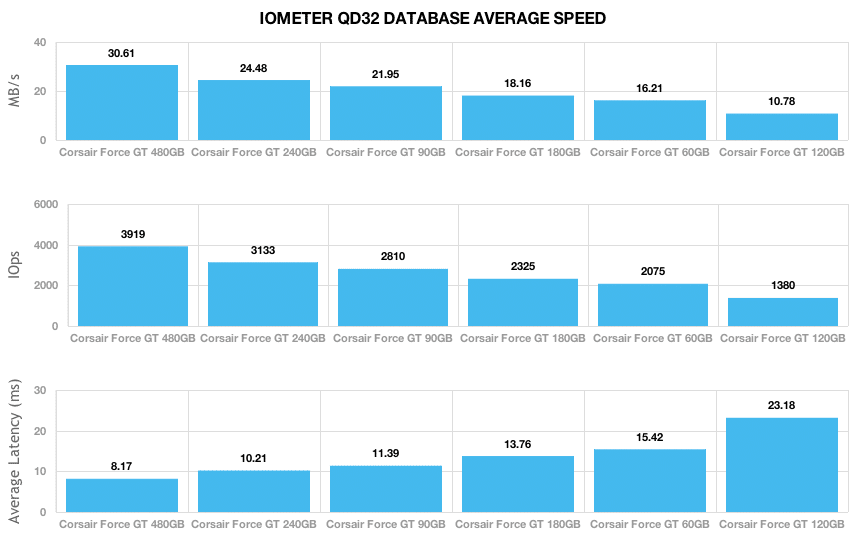
The 480GB Force GT showed the strongest performance in Database profile, averaging 30.61MB/s in steady-state versus 24.48MB/s from the 240GB model.
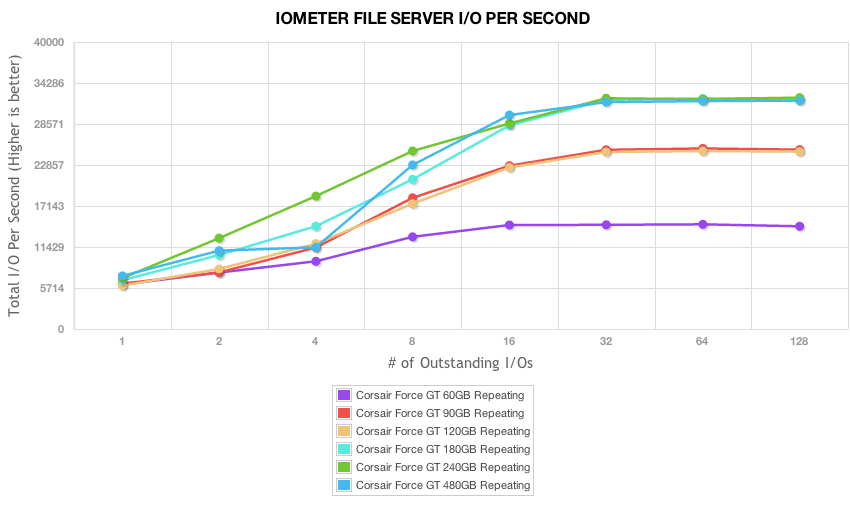
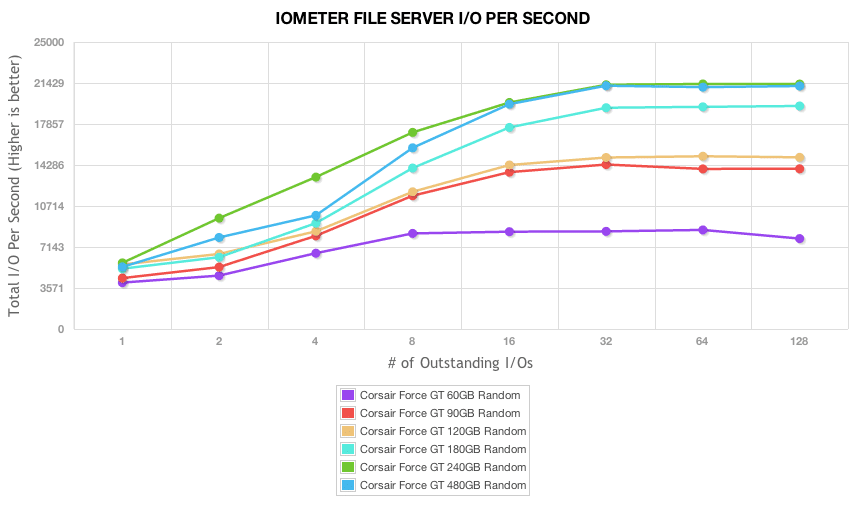
The next profile looks at a file server, with 80% read and 20% write workload spread out over multiple transfer sizes ranging from 512-byte to 64KB.
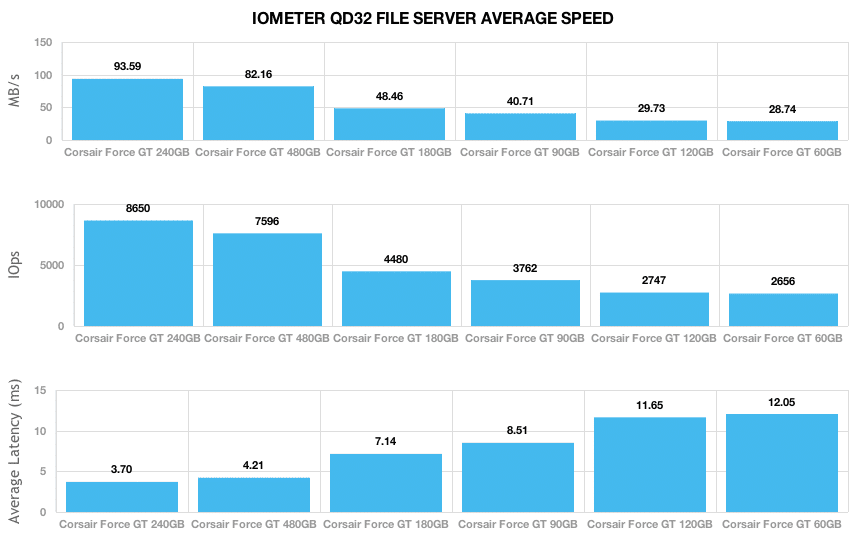
In a file server setting, the 240GB model took the lead, offering steady-state transfer speeds of 93.59MB/s compared to 82.16MB/s from the 480GB Force GT.
Our web server profile is read-only with a spread of transfer sizes from 512-byte to 512KB.
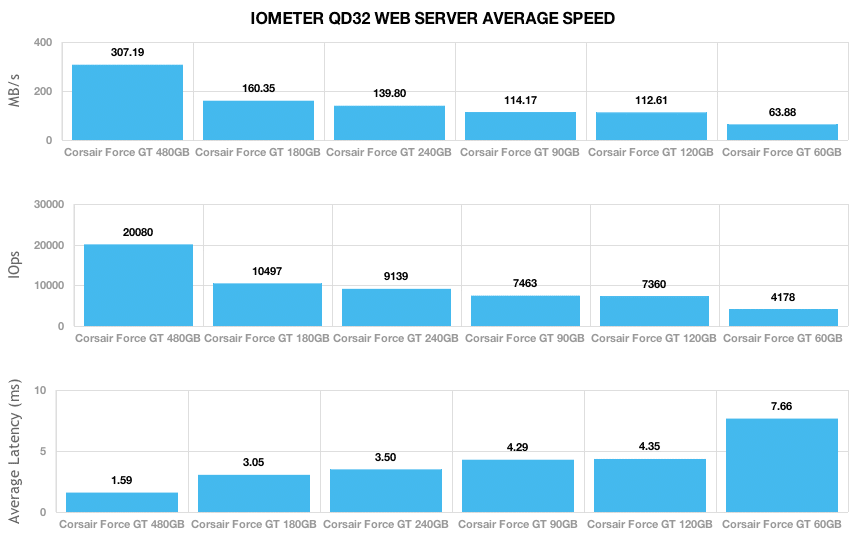
In a read-only webserver profile, the 480GB model offered nearly double the performance of the other Force GTs.
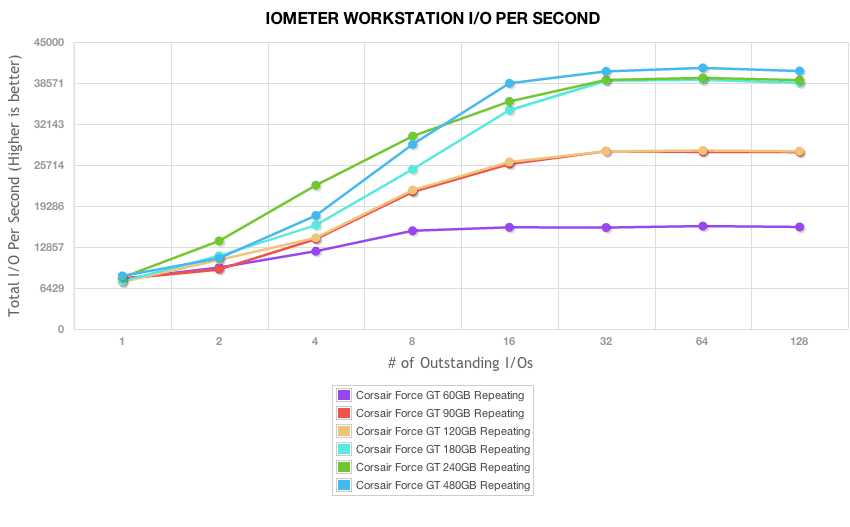
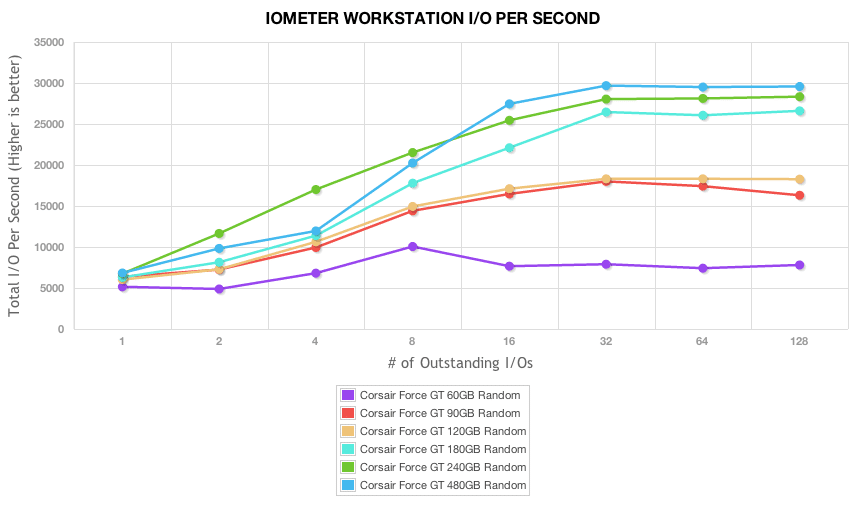
The last profile looks at a workstation, with a 20% write and 80% read mixture using 8K transfers.
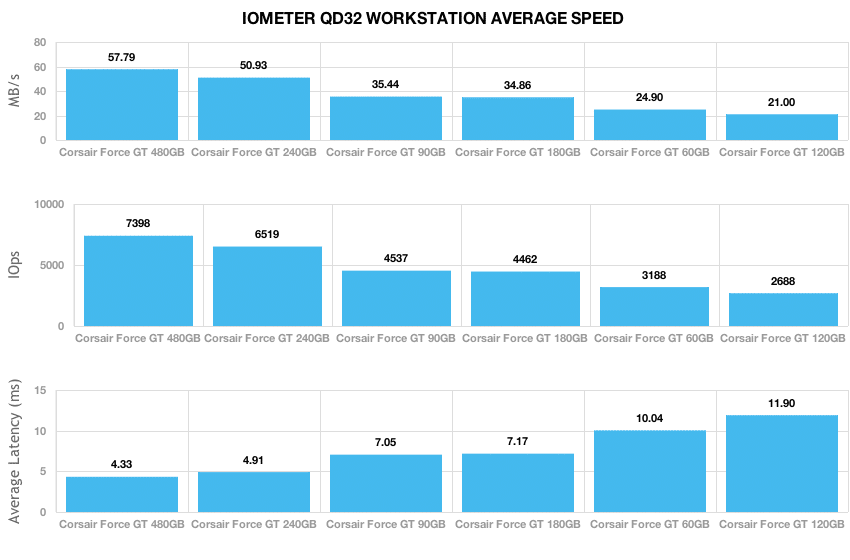
The 480GB Force GT maintained its strong lead in the workstation profile with a 80% write workload, with the 240GB model coming in second.
Conclusion
It’s not only fun to get a chance to break down the entire line of Corsair Force GT SSDs, it’s pretty revealing as well. When we look at 2MB large block sequential file movement for instance, we see near parity in terms of read/write performance with repeating data. Switch to random though and we see that the 180GB, 240GB and 480GB hang together, while the other capacities give up substantial write performance. 2MB random performance follows the same profile.
Switch to 4K and that’s where there’s clearly a penalty for the largest 480GB capacity. While it posts the fastest read speeds in all of our 4K tests, it also posts the slowest write speeds and latency due to the NAND die configuration. The rest of the Force GT family looks nearly identical throughout 4K testing. While the 480GB capacity took the biggest hit in a straight 4K random workload, switch to mixed performance in our burst-speed server profiles and the 480GB model leads the way. It also handily beat all of the models, except for the 240GB Force GT in the File Server profile when comparing steady-state performance. There is a clear advantage to the larger capacity SSDs for write-heavy workloads.
While it may be easy for many to look at this batch of data and shrug shoulders, sophisticated SSD buyers who understand their workloads can definitely start to find sweet spots in different SSD capacities that use the SandForce controller at least. That’s exactly what happens in the enterprise, so it shouldn’t be terribly surprising to see consumers following down that path as well. So if you’re a workstation user who is thinking about buying an SSD, does it matter if you buy the 120GB or 180GB? Well, if you want a 60% boost in throughput it does.
Corsair Force GT SSDs at Amazon.com