The Dell EMC SC5020 fits with Dell EMC’s midrange storage portfolio and is available in a range of configurations including HDD, SSD and hybrid. Billed as a flexible workhorse for SMBs, the SC5020 doesn’t drop features/functionality to be price competitive. In fact, in terms of capabilities, the SC5020 is on par with the all-flash SC9000 we reviewed last year. The differences are mostly around top-end performance specifications, as the SC9000 has more RAM and CPU in the controllers and thus will have a much higher performance threshold. For its part, the SC5020 uses a 3U chassis with two hot-swappable controllers in an active/active configuration and 30 2.5″ drive bays. The system can be expanded with additional drive shelfs to support an additional 192 drives, topping the SC5020 out at over 2PB of maximum raw capacity.
The Dell EMC SC5020 fits with Dell EMC’s midrange storage portfolio and is available in a range of configurations including HDD, SSD and hybrid. Billed as a flexible workhorse for SMBs, the SC5020 doesn’t drop features/functionality to be price competitive. In fact, in terms of capabilities, the SC5020 is on par with the all-flash SC9000 we reviewed last year. The differences are mostly around top-end performance specifications, as the SC9000 has more RAM and CPU in the controllers and thus will have a much higher performance threshold. For its part, the SC5020 uses a 3U chassis with two hot-swappable controllers in an active/active configuration and 30 2.5″ drive bays. The system can be expanded with additional drive shelfs to support an additional 192 drives, topping the SC5020 out at over 2PB of maximum raw capacity.
To be appealing to the midrange market, arrays need to be flexible, efficient with good performance, and not break the bank. The SC5020 takes some of these ideas quite far. From a flexibility standpoint, users can have anywhere from 0-100% flash storage and change as their needs and demands change. The SC5020 fits nicely into the Dell EMC ecosystem, whether this is the direction a customer wants to move in or for customers that already have several other Dell EMC products under their wing. However, the biggest selling point would be the array’s efficiency. The array uses automation and tiering to lower costs of performance and intelligent data reduction to lower the cost of capacity. RAID can be set at multiple levels on the same drive to help match current activity levels or volume policies.
We’ve already previewed some of our SC5020 performance data, as we posted about the new SCOS 7.3 update this past summer. While point updates usually are more centered on bug fixes and minor functionality improvements, 7.3 brought with it a massive performance bump. SCOS, of course, also offers all of the enterprise data services expected like dedupe/compression, snapshots, replication, distributed sparing, encryption and so on. There’s plenty of third-party application support as well, including VMware, Microsoft, IBM, OpenStack, Oracle, Symantec, Commvault, Foglight and Docker. In terms of operational benefits, the SC5020 supports phone home, online non-disruptive firmware updates and Dell EMC’s CloudIQ analytics and monitoring tool. From a management perspective, the SC5020 offers HTML5 tools Unisphere for SC and Unisphere Central (multi-array management), as well as Dell Storage Manager (multi-array, multi-site, cross-platform management).
In this review, we revisit the data from the SCOS 7.3 update and post the rest of our performance data. The system under review is fully populated with write-intensive 800GB SSDs for a total capacity of over 20TB raw.
Dell EMC SC5020 Specifications
| Form Factor | 3U |
| Controllers | 2 hot-swappable per chassis (active/active) |
| CPUs | Intel Xeon Processor E5-2630 v3, 2.4GHz, 8 cores |
| Memory | 128GB per SC5020 array (64GB per controller) |
| OS | Dell Storage Center OS (SCOS) 7.2 or greater |
| Storage | |
| Bays | 30 x2.5” |
| Supported expansion enclosures | Dell SC420: 24 x 2.5” drive bays (12Gb SAS) Dell SC400: 12 x 3.5” drive bays (12Gb SAS) |
| Max drive count | 222 (30 internal, plus 192 external) |
| Max raw capacity | 2PB per array |
| Max raw capacity (NAS) | 2 PB per array with optional FS8600 4PB in single namespace (with FS8600 and multiple SC Series arrays) |
| Storage Media | SAS and NL-SAS drives SSD: write-intensive and read-intensive drives HDD: 15K, 10K, 7.2K RPM |
| RAID support | RAID 0, 1, 5, 6, RAID 10, and RAID 10 DM (Dual Mirror) |
| Front-end-network protocols | FC, iSCSI, SAS |
| Ports | Max 32Gb FC ports: 8 per array (SFP+) Max 16Gb FC ports: 8 per array (SFP+) Max 10Gb/1Gb iSCSI ports: Up to 8 SFP+ or BaseT ports per array Max 12Gb SAS ports: Up to 8 12Gb SAS7 ports Management ports: 2 per array (1Gb BASE-T) Back-end expansion protocols: 12Gb SAS Max back-end expansion ports: 4 per array Up to 16 expansion enclosures per array |
| Environmental | |
| Operating temperature | 50 – 95°F (10 – 35°C) |
| Non-operating temperature | -40 – 149°F (-40 – 65°C) |
| Operating humidity ranges | 10% to 80% with 29°C (84.2°F) maximum dew point |
| Non-operating humidity | 5% to 95% with 33°C (91°F) maximum dew point |
| Power | |
| Wattage | 2 hot-swappable 1485W power supplies; 1485W maximum power |
| Heat dissipation | 5,067 BTU/hr maximum |
| Voltage | 200-240 VAC |
| Frequency | 50/60Hz |
| Amperage | 1485/100-14A, 1485/240-6.2A |
| Physical | |
| HxWxD | 13.33 x 44.5 x 78.5 cm (5.25 x 17.52 x 30.9 in) |
| Max weight | 24.22 kg (53.4 lb) |
Design and Build
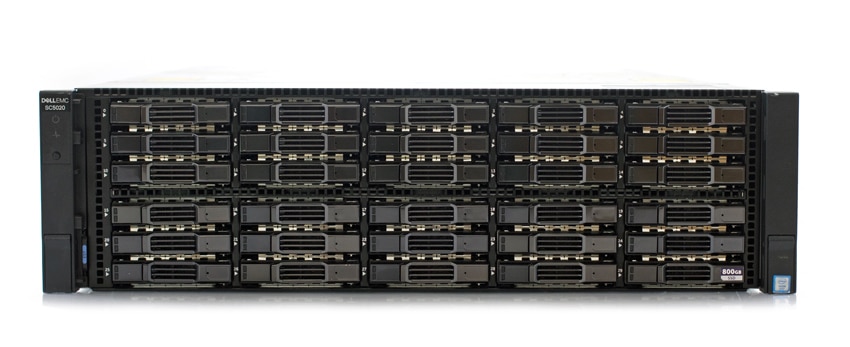
The Dell EMC SC5020 is a 3U storage array that comes with one of the stylish bezels the company is known for. Beneath the bezel are the 30 hot-swap, 2.5” drive bays. On the right side of the device are the power indicator, status indicator, and identification button.
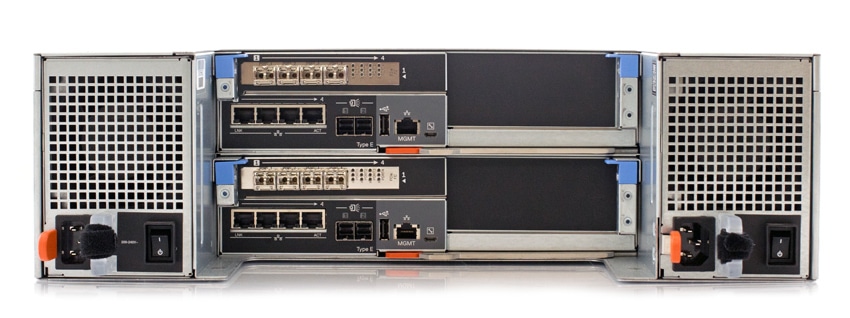
Flipping around to the rear of the device, one can easily see the two power supplies and fans on either side. The two storage controllers are stacked one atop the other in the middle. Each controller contains an I/O care slot (that we populated with Fibre Channel cards), four iSCSI ports, two mini-SAS ports, a USB 2.0 port, a management port, and a serial port.
Management
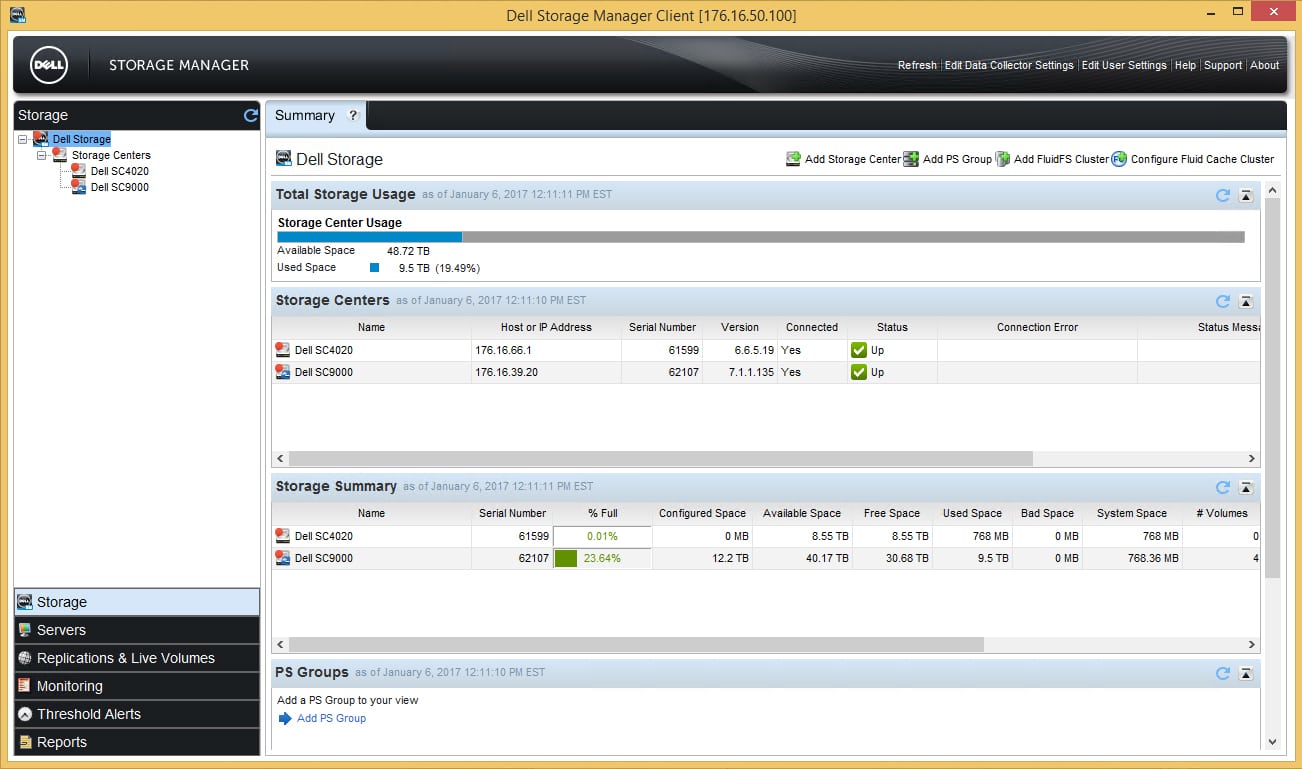
Part of the update to SCOS 7.3 brings Unisphere and all of its benefits to the SC Series. Unisphere is an HTML5 UI that is sleeker and more intuitive than the previously used Dell Storage Manager.
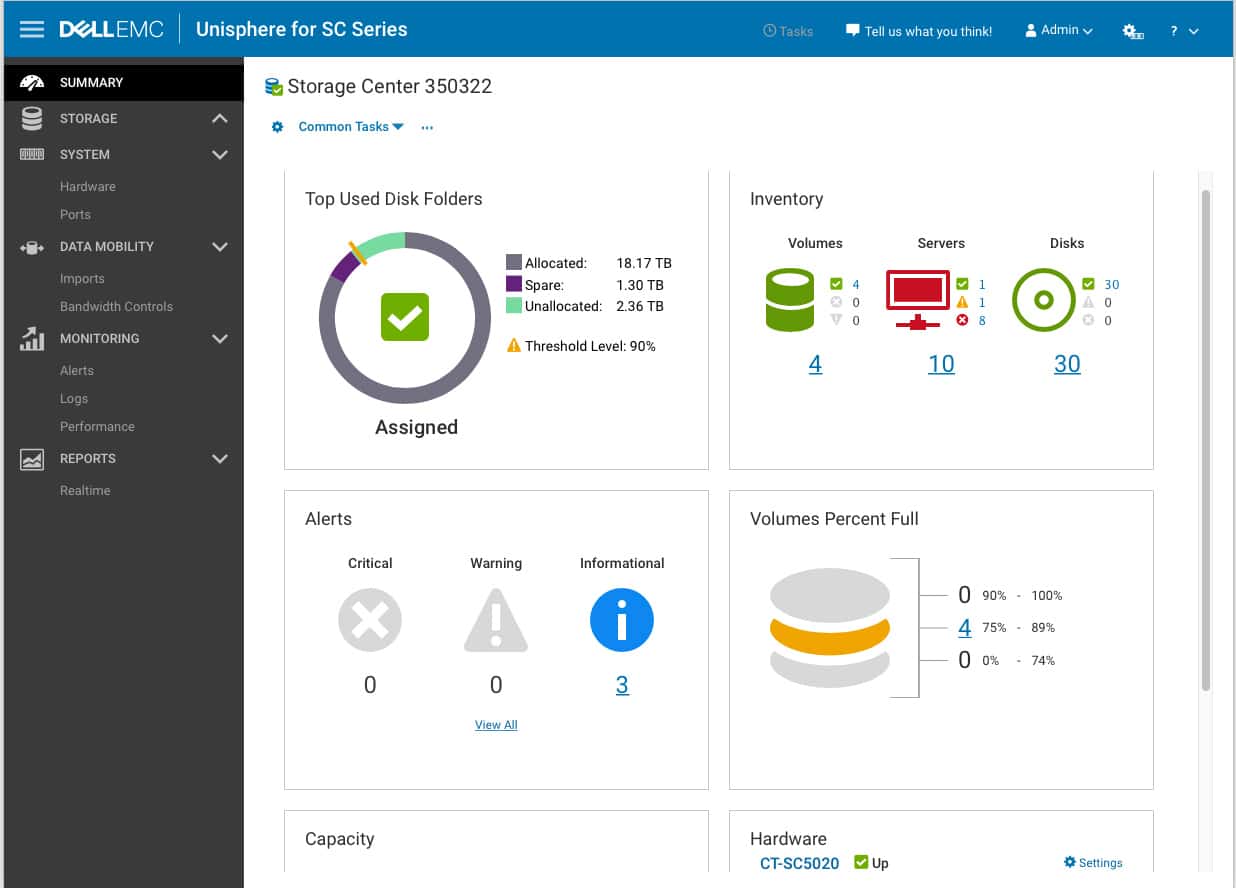
Signing in brings users to the Summary page. As the name implies, this page gives admins a run down of what is happening on the SC5020. Along the left side are several tabs (Storage, System, Data Mobility, Monitoring, and Reports) with their own sub-tabs.
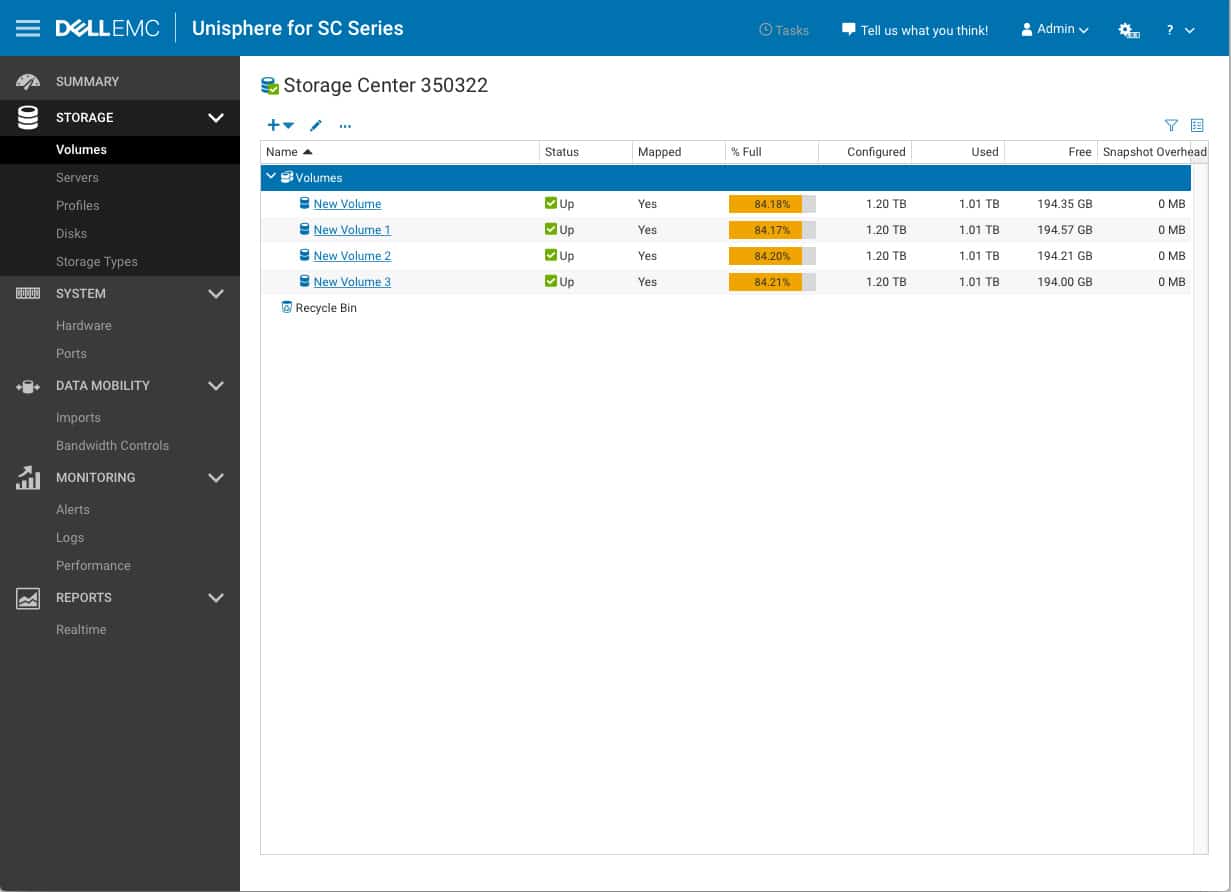
The Storage tab has several sub-tabs including Volumes, Servers, Profiles, Disks, and Storage Types. Under the Volumes sub-tab, admins can quickly see their existing volumes along with pertinent information about them, as well as the ability to create new volumes or delete existing ones.
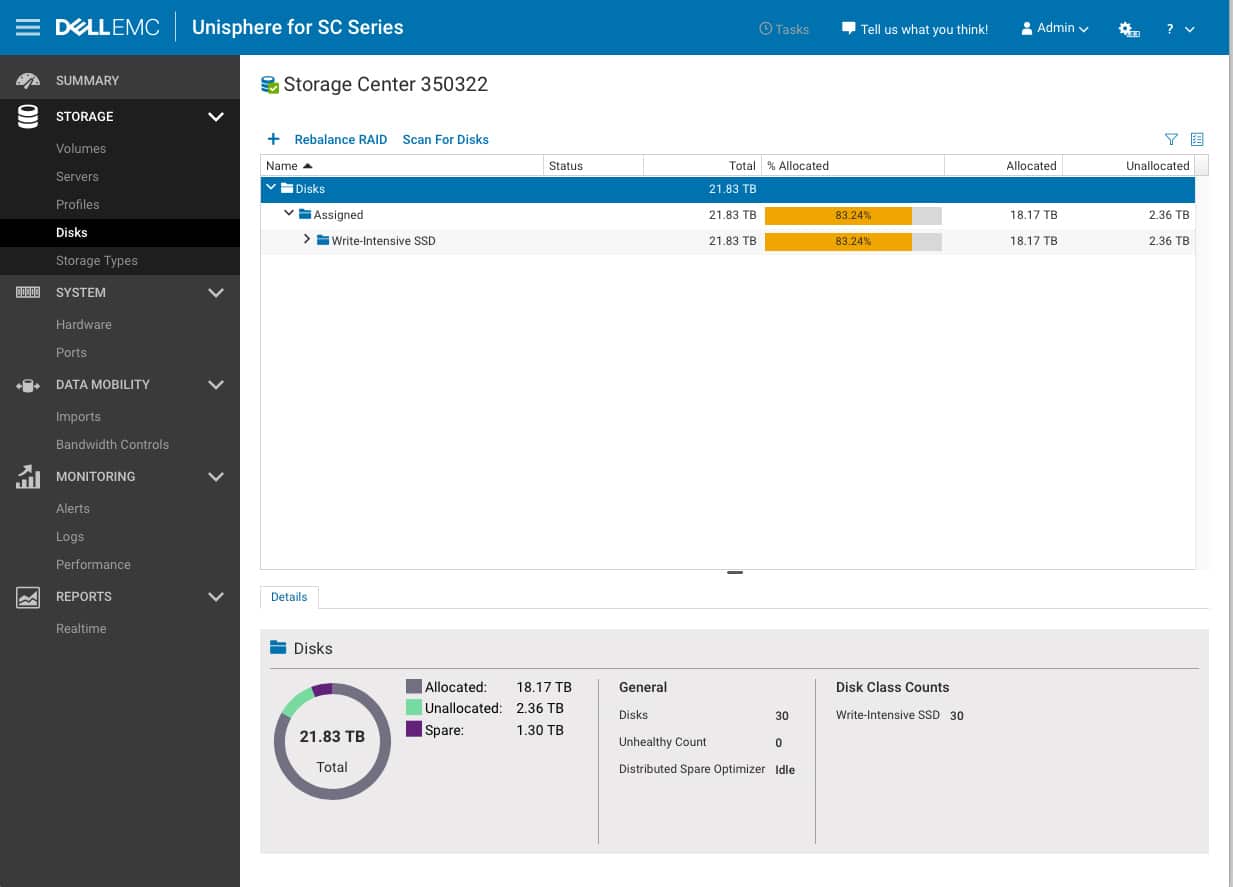
The Disks sub-tab lists out the disks as well as total capacity with allocated versus unallocated and has a graphical representation at the bottom. Admins can add more disks and rebalance RAID through this sub-tab.
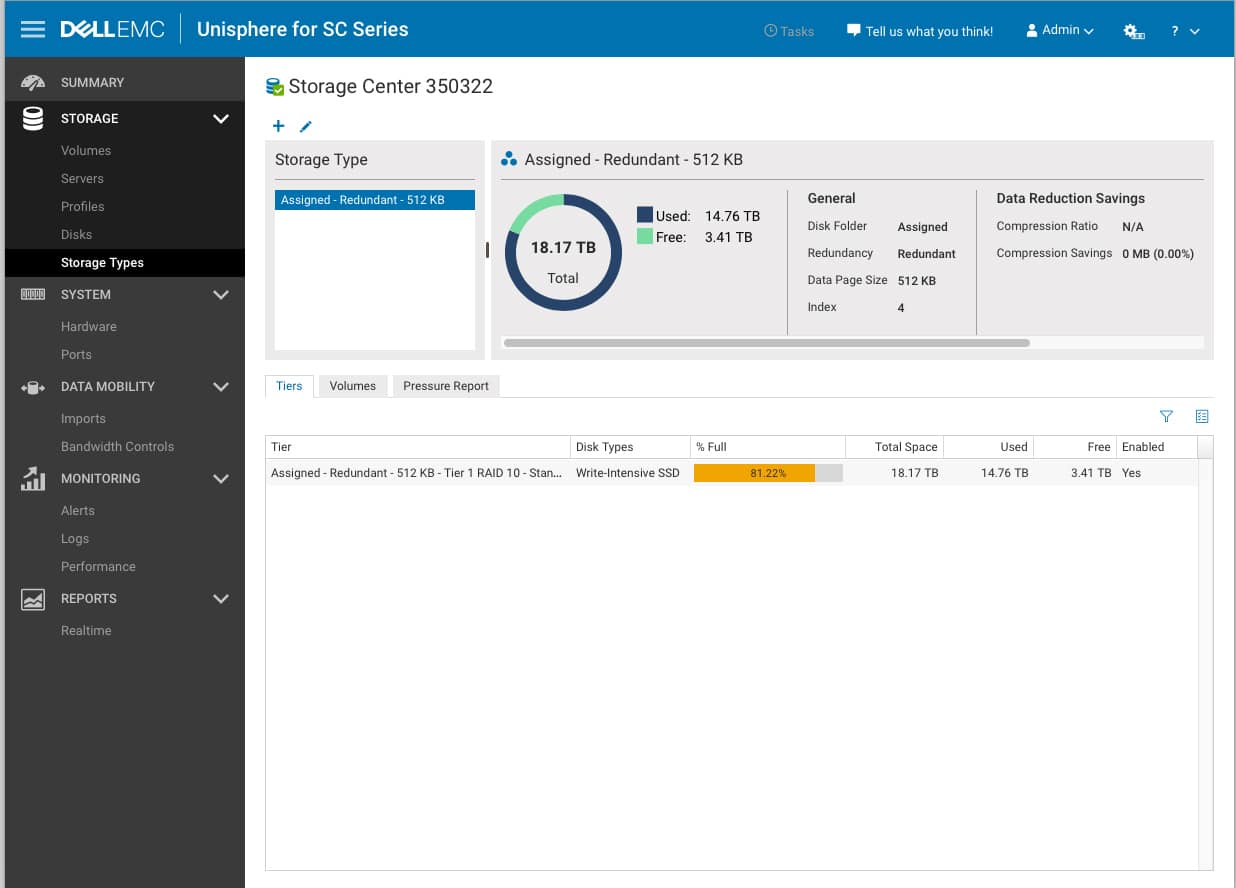
With the Storage Types sub-tab, admins can easily see tiers, volumes, as well as pressure reports. And they can set up storage between assigned and redundant.
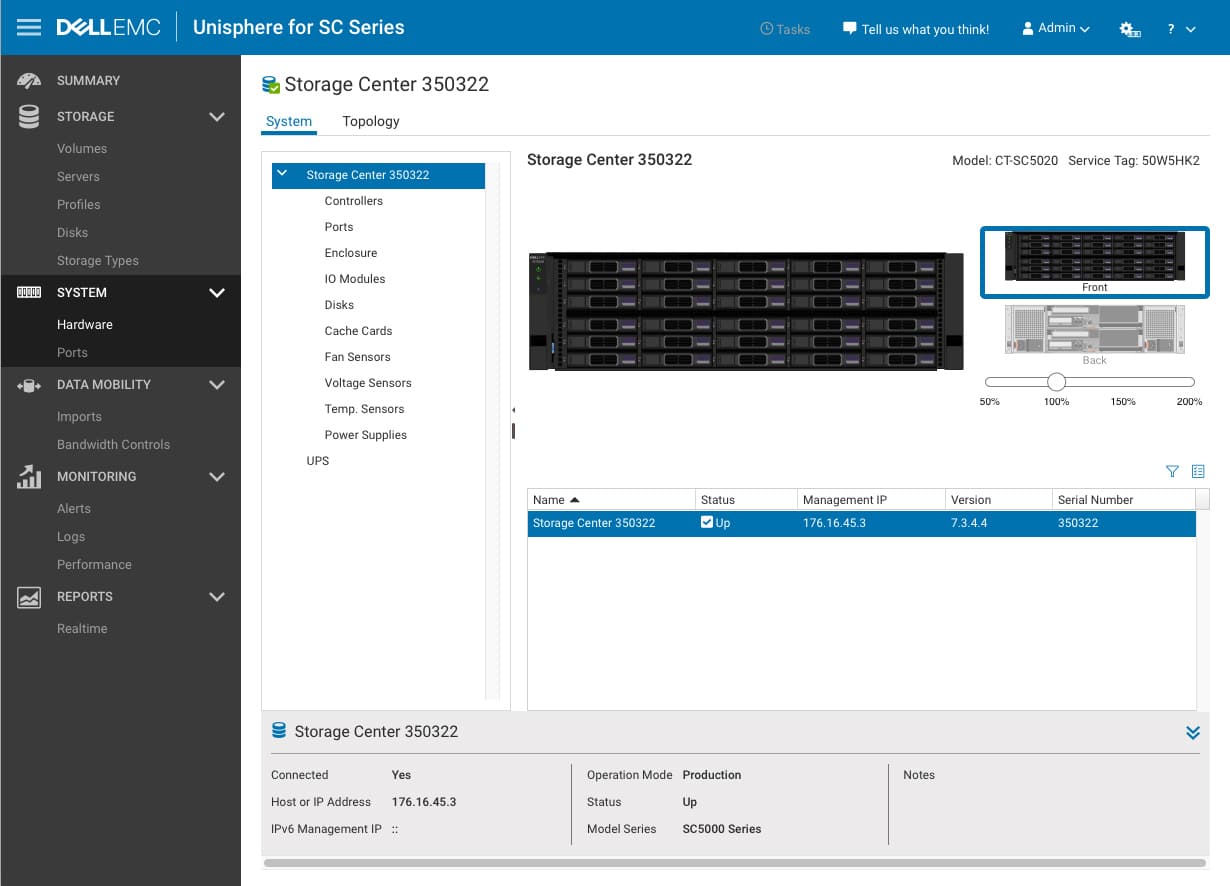
The System tab has two sub-tabs: Hardware and Ports. The Hardware sub-tab gives admins a quick overview of the system and its components and allows users to drill down into each part through Storage Center.
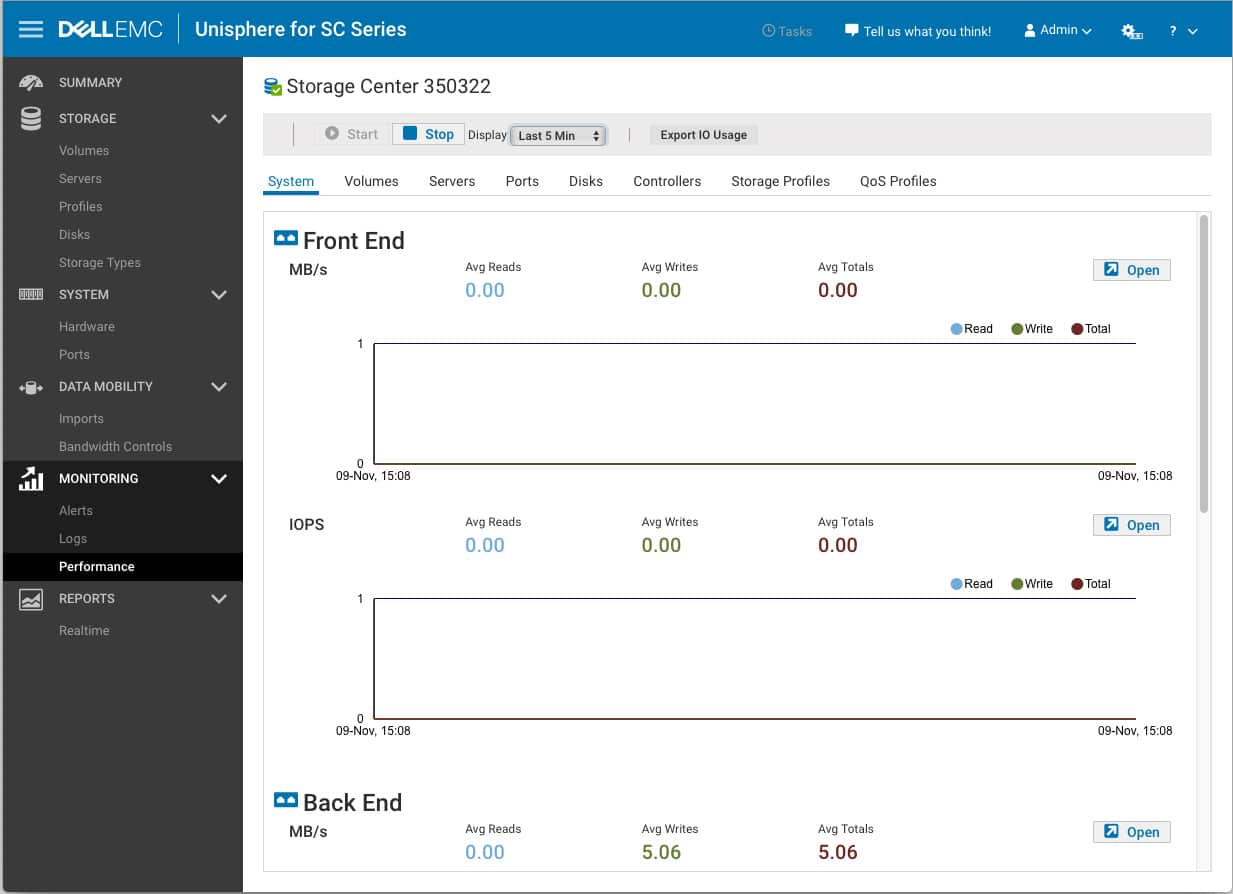
The Monitoring tab has three sub-tabs: Alerts, Logs, and Performance. With the performance sub-tab we can easily see the performance within a given range of time in both MB/s and IOPS on either the front or back end.
Performance
Across all of our performance testing, we leveraged a total of eight 16Gb FC ports connected through a dual 16Gb FC switch fabric.
Application Workload Analysis
The application workload benchmarks for the Dell EMC SC5020 consist of the MySQL OLTP performance via SysBench and Microsoft SQL Server OLTP performance with a simulated TPC-C workload. In each scenario, we had the array configured with 30 800GB Write Intensive SSDs, using volumes provisioned with a Tier 1 RAID10 storage profile. Four volumes were then created, balanced across both storage controllers. In our testing environment, this created a balanced load for our SQL and Sysbench workloads.
SQL Server Performance
Each SQL Server VM is configured with two vDisks: 100GB volume for boot and a 500GB volume for the database and log files. From a system resource perspective, we configured each VM with 16 vCPUs, 64GB of DRAM and leveraged the LSI Logic SAS SCSI controller. While our Sysbench workloads tested previously saturated the platform in both storage I/O and capacity, the SQL test is looking for latency performance.
This test uses SQL Server 2014 running on Windows Server 2012 R2 guest VMs, and is stressed by Quest’s Benchmark Factory for Databases. While our traditional usage of this benchmark has been to test large 3,000-scale databases on local or shared storage, in this iteration we focus on spreading out four 1,500-scale databases evenly across the storage array.
SQL Server Testing Configuration (per VM)
- Windows Server 2012 R2
- Storage Footprint: 600GB allocated, 500GB used
- SQL Server 2014
- Database Size: 1,500 scale
- Virtual Client Load: 15,000
- RAM Buffer: 48GB
- Test Length: 3 hours
- 2.5 hours preconditioning
- 30 minutes sample period
SQL Server OLTP Benchmark Factory LoadGen Equipment
- Dell EMC PowerEdge R740xd Virtualized SQL 4-node Cluster
- 8 Intel Xeon Gold 6130 CPU for 269GHz in cluster (Two per node, 2.1GHz, 16-cores, 22MB Cache)
- 1TB RAM (256GB per node, 16GB x 16 DDR4, 128GB per CPU)
- 4 x Emulex 16GB dual-port FC HBA
- 4 x Mellanox ConnectX-4 rNDC 25GbE dual-port NIC
- VMware ESXi vSphere 6.5 / Enterprise Plus 8-CPU
For SQL Server, the Dell EMC SC5020 hit an aggregate transactional score of 12,630.3 TPS with individual VMs ranging from 3,156.6 TPS to 3,158.5 TPS.
With SQL Server average latency, the SC5020 had an aggregate score of 7ms with individual VMs ranging from 6ms to 8ms.
Sysbench Performance
Each Sysbench VM is configured with three vDisks: one for boot (~92GB), one with the pre-built database (~447GB), and the third for the database under test (270GB). From a system-resource perspective, we configured each VM with 16 vCPUs, 60GB of DRAM and leveraged the LSI Logic SAS SCSI controller. Load gen systems are Dell R740xd servers.
Dell PowerEdge R740xd Virtualized MySQL 8 node Cluster
- 16 Intel Xeon Gold 6130 CPU for 538GHz in cluster (two per node, 2.1GHz, 16-cores, 22MB Cache)
- 2TB RAM (256GB per node, 16GB x 16 DDR4, 128GB per CPU)
- 8 x Emulex 16GB dual-port FC HBA
- 8 x Mellanox ConnectX-4 rNDC 25GbE dual-port NIC
- VMware ESXi vSphere 6.5 / Enterprise Plus 8-CPU
Sysbench Testing Configuration (per VM)
- CentOS 6.3 64-bit
- Storage Footprint: 1TB, 800GB used
- Percona XtraDB 5.5.30-rel30.1
- Database Tables: 100
- Database Size: 10,000,000
- Database Threads: 32
- RAM Buffer: 24GB
- Test Length: 3 hours
- 2 hours preconditioning 32 threads
- 1 hour 32 threads
For Sysbench, we tested the Dell EMC SC5020 with several sets of VMs, including 8, 16 and 32 VMs. With 8VM we saw an aggregate score of 14,742 TPS, with 16VM we saw 18,384 TPS, and with 32VM the SC5020 was able to hit 26,723 TPS.
For Sysbench average latency we saw aggregate scores of 17.4ms for 8VM, 27.9ms for 16VM, and 38.6ms for 32VM.
Looking at 99th percentile latency (worst-case scenario), the SC5020 was able to hit 33.6ms for 8VM, 55ms for 16VM, and 76.7ms for 32VM.
VDBench Workload Analysis
When it comes to benchmarking storage arrays, application testing is best, and synthetic testing comes in second place. While not a perfect representation of actual workloads, synthetic tests do help to baseline storage devices with a repeatability factor that makes it easy to do apples-to-apples comparison between competing solutions. These workloads offer a range of different testing profiles ranging from “four corners” tests, common database transfer size tests, as well as trace captures from different VDI environments. All of these tests leverage the common vdBench workload generator, with a scripting engine to automate and capture results over a large compute testing cluster. This allows us to repeat the same workloads across a wide range of storage devices, including flash arrays and individual storage devices. On the array side, we use our cluster of Dell PowerEdge R740xd servers attached to eight Tier 1 RAID10 volumes provisioned from the Dell EMC SC5020.
Profiles:
- 4K Random Read: 100% Read, 128 threads, 0-120% iorate
- 4K Random Write: 100% Write, 64 threads, 0-120% iorate
- 64K Sequential Read: 100% Read, 16 threads, 0-120% iorate
- 64K Sequential Write: 100% Write, 8 threads, 0-120% iorate
- Synthetic Database: SQL and Oracle
- VDI Full Clone and Linked Clone Traces
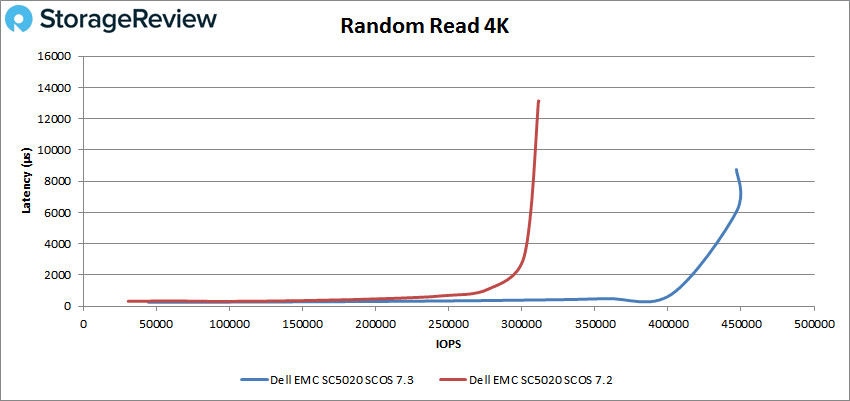
With VDBench we are comparing the Dell EMC SC5020 to itself with updated software, SCOS 7.2 vs SCOS 7.3. For peak 4K random read the 7.2 version made it to roughly 275K IOPS at sub-millisecond latency while the 7.3 went on to over 400K before breaking 1ms. SCOS 7.2 peaked at 311,436 IOPS at 13.1ms latency. The SCOS 7.3 version peaked at about 450K IOPS and roughly 7ms latency.
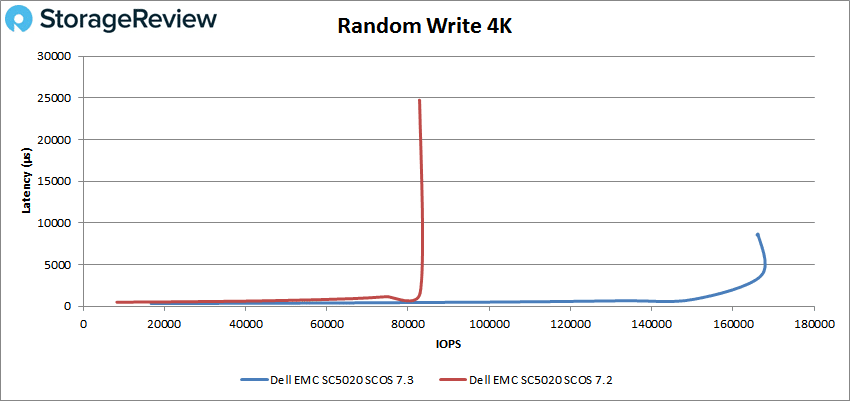
With 4K random write, the SCOS 7.2 version ran under 1ms until about 80K IOPS and peaked at 82,862 IOPS with 24.7ms latency. The SCOS 7.3 had sub-millisecond latency performance until about 150K IOPS with a peak performance of about 167K IOPS and 4.8ms latency.
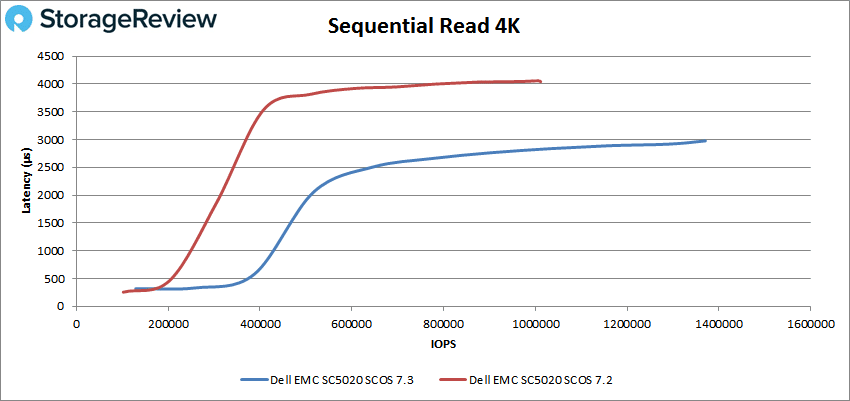
Sequential 4K performance from SCOS 7.3 continued to show strong improvements in sequential 4K rear performance, allowing the unit to push out to 1.37M IOPS, whereas the one running 7.2 measured 1.01M IOPS.
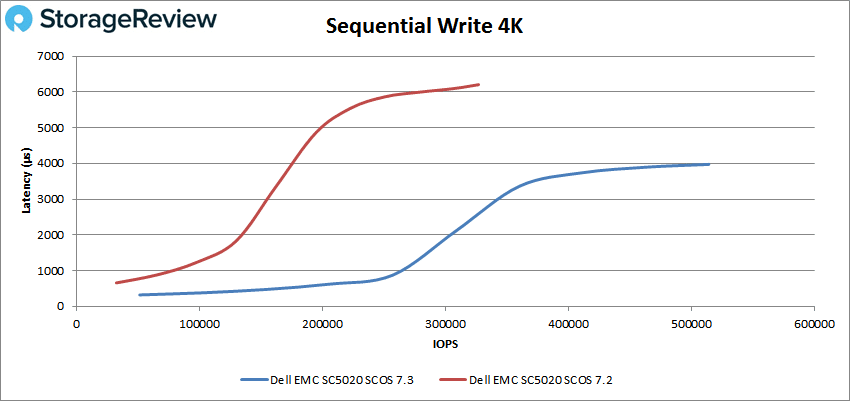
Again, in our write test measuring 4K sequential performance, we saw SCOS 7.3 push out beyond 500K IOPS, improving beyond the 326k IOPS measured from the older SCOS 7.2.
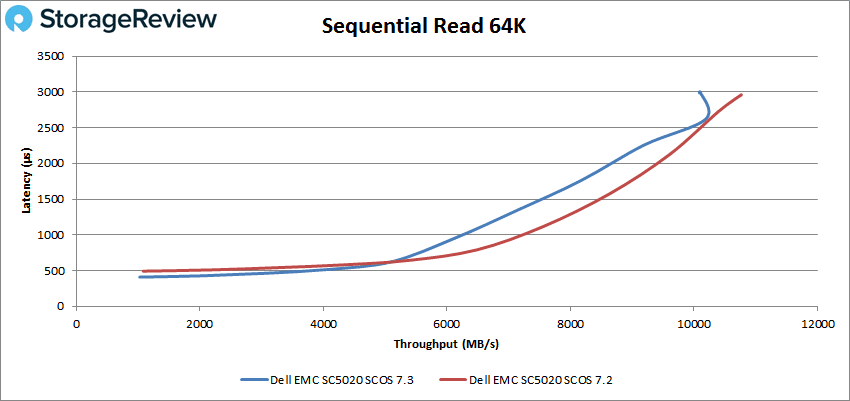
Switching over to sequential 64K benchmarks, we saw the SCOS 7.3 version slip behind the 7.2 in reads with the 7.3 breaking 1ms at 100K IOPS or 6.2GB/s and peaking at roughly 163K IOPS or 10.2GB/s with 2.6ms latency, while the 7.2 made it until about 117K IOPS or 7.6GB/s under 1ms and peaked at 172,247 IOPS or 10.8GB/s with a latency of 2.96ms.
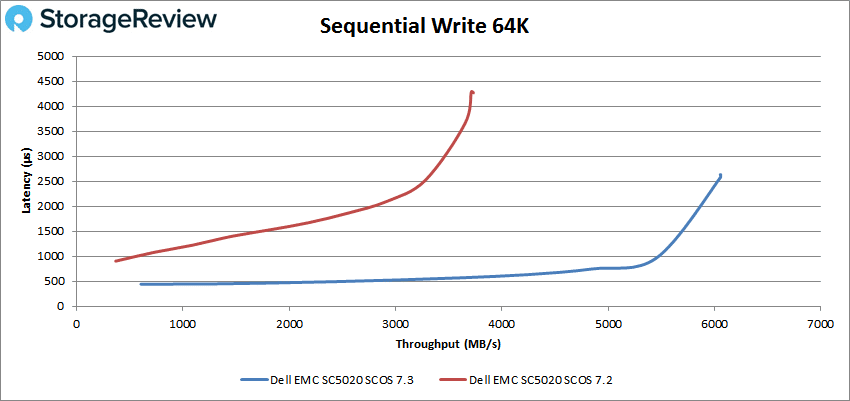
64K sequential write saw the 7.3 version jump out ahead again by quite some margin. The SCOS 7.2 started off beneath 1ms but quickly shot above it going on to peak at 59,408 IOPS or 3.7GB/s with a latency of 4.3ms. The 7.3 version made it to just over 87K IOPS or 5.5GB/s before going over 1ms of latency and went on to peak at 96,868 IOPS or 6.1GB/s with a latency of 2.6ms.
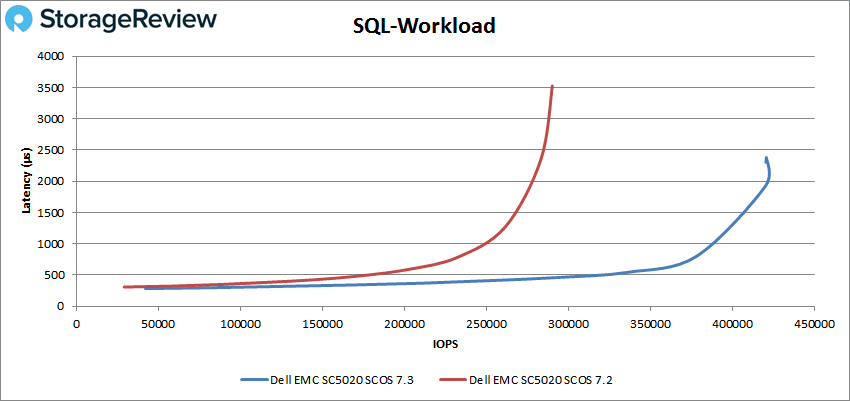
Next, we moved on to our SQL workloads. The Dell EMC SC5020 SCOS 7.2 had sub-millisecond latency performance until about 250K IOPS and peaked at 290,297 IOPS with a latency of 3.52ms. For the SCOS 7.3 version, the array made it to nearly 400K IOPS with latency under 1ms and peaked at roughly 422K IOPS with a latency of about 2ms.
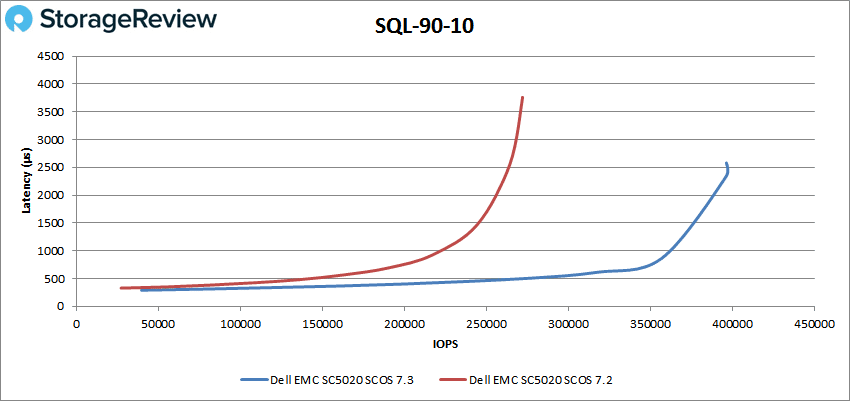
With SQL 90-10, we saw the 7.2 make it to about 220K IOPS before breaking 1ms latency and going on to peak at 272,154 IOPS with a latency of 3.8ms. The 7.3 went over 350K IOPS and peaked at about 396K IOPS with a latency of 2.4ms.
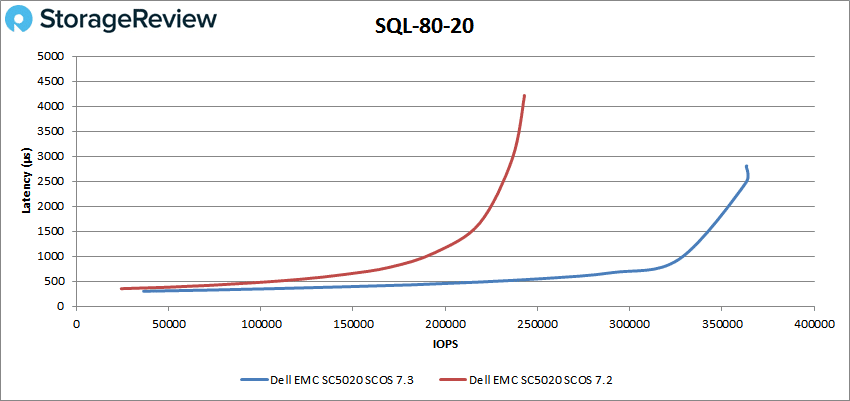
The SQL 80-20 saw the 7.2 version break 1ms at about 185K IOPS with a peak score of 242,928 IOPS and a latency of 4.2ms. The 7.3 version had sub-millisecond latency performance until 327K IOPS or so and peaked at about 364K IOPS with a latency of 2.5ms.
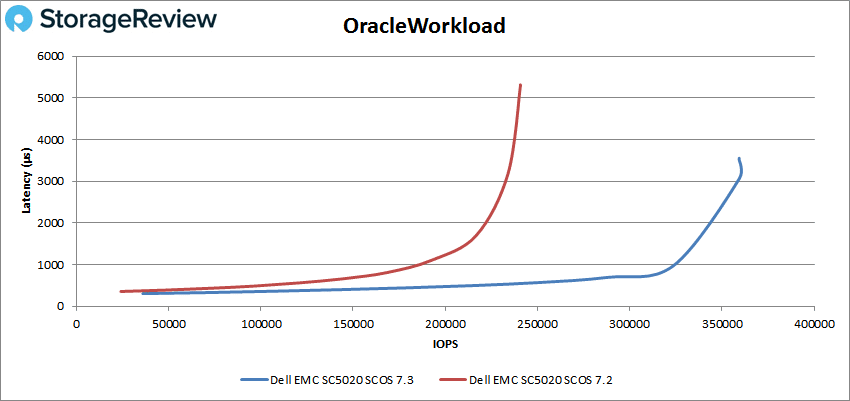
Moving on to the Oracle workloads, the SCOS 7.2 had sub-millisecond latency up to about 190K IOPS and peaked at 240,795 IOPS with a latency of 5.3ms. The SCOS 7.3 ran under 1ms until about 323K IOPS and peaked at about 360K IOPS with a latency of 3.3ms.
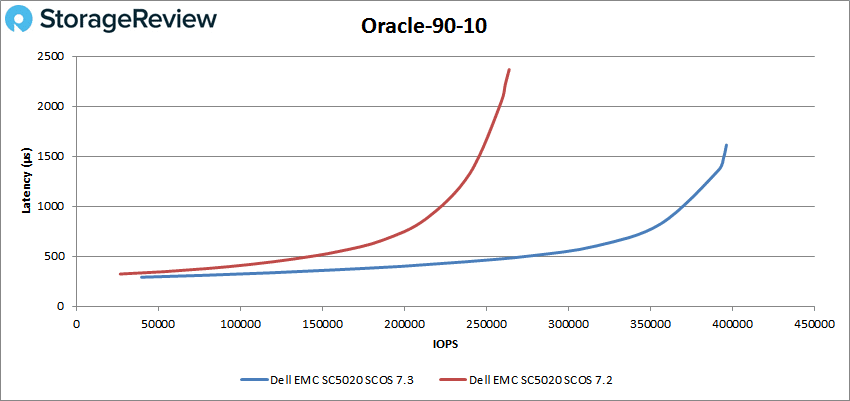
With Oracle 90-10, the SCOS 7.2 made it to about 225K IOPS before breaking 1ms and peaked at 263,969 IOPS at 2.4ms latency. The SCOS 7.3 made it to about 360K IOPS with sub-millisecond latency performance and peaked at 396,504 IOPS with a latency of 1.6ms.
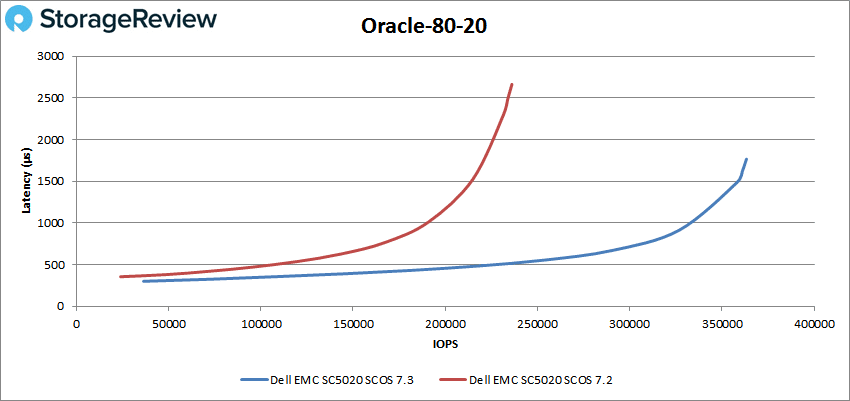
For Oracle 80-20, the SCOS 7.2 had sub-millisecond latency performance until about 190K IOPS and peaked at 236,098 IOPS with a latency of 2.7ms. The 7.3 broke 1ms at roughly 330K IOPS and peaked at 363,286 IOPS with a latency of 1.8ms.
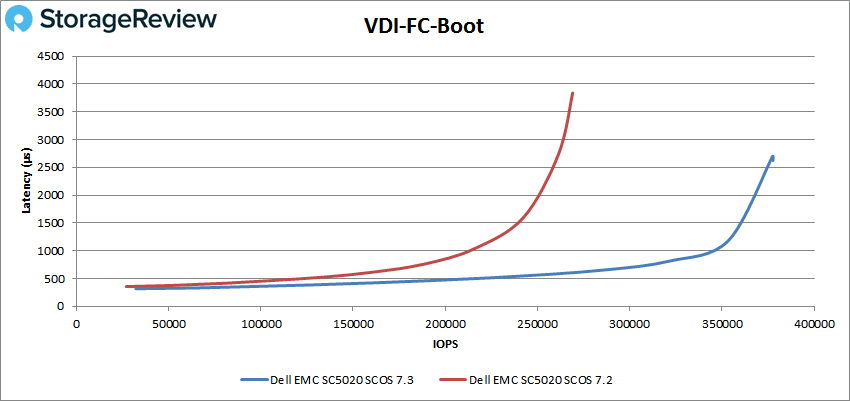
Next, we switched over to our VDI clone test, Full and Linked. For VDI Full Clone Boot, the Dell EMC SC5020 SCOS 7.2 went to about 210K IOPS before breaking 1ms and peaked at 269,042 IOPS with a latency of 3.8ms. The 7.3 version had sub-millisecond latency performance until nearly 350K IOPS and peaked at 377,413 IOPS with 2.7ms for latency.
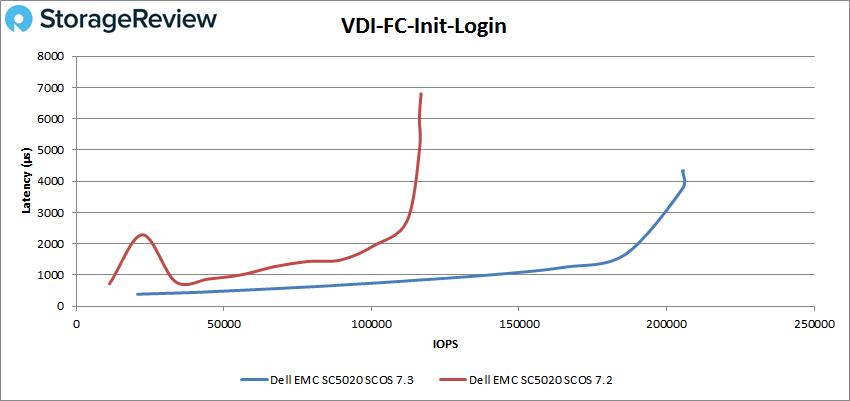
VDI FC Initial Login saw the 7.2 start with a large spike in latency that came back down and went on to peak at 116,758 IOPS with a latency of 6.8ms. The 7.3 had sub-millisecond latency until just before 150K IOPS and peaked at roughly 206K IOPS with a latency of 3.9ms.
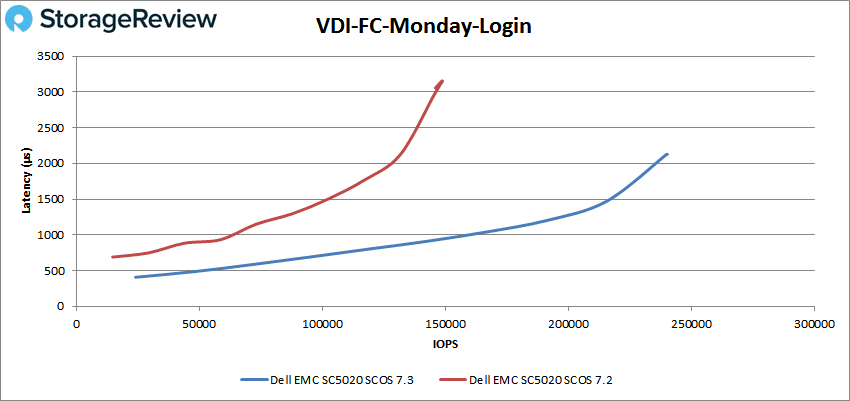
For VDI FC Monday Login, the 7.2 started off with better performance staying under 1ms until about 60K IOPS and going on to peak at 148,872 IOPS with a latency of 3.1ms. The 7.3 version had sub-millisecond latency performance until 150K IOPS and peaked at 239,271 IOPS with a latency of 2.1ms.
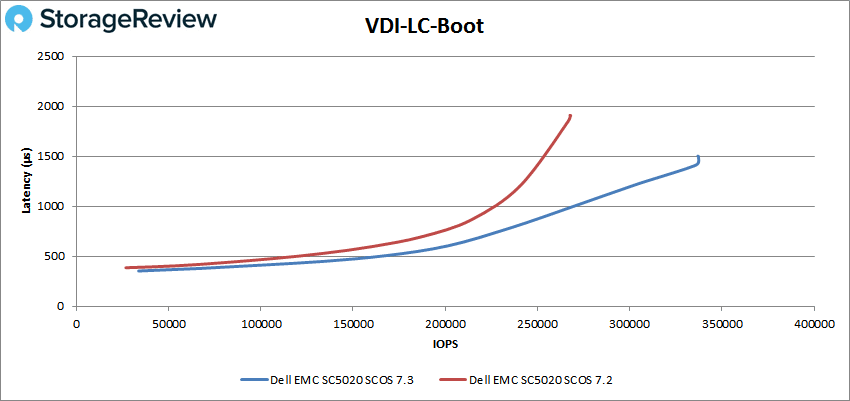
Moving on to VDI Linked Clone (LC), the boot test had the 7.2 go over 1ms at about 220K IOPS going on to peak at 266,623 IOPS having a latency of 1.9ms. The 7.3 had sub-millisecond latency performance until just under 270K IOPS going on to peak at 337,175 IOPS with a latency of 1.5ms.
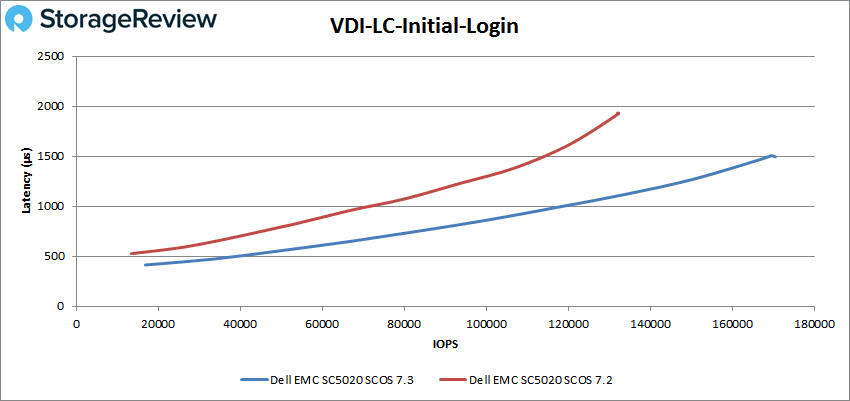
VDI LC Initial Login had the 7.2 with latency under 1ms until just over 70K IOPS with a peak of 132,284 IOPS and a latency of 1.9ms. The 7.3 did better with sub-millisecond latency until about 120K IOPS and a peak performance of 170,197 IOPS with a latency of 1.5ms.
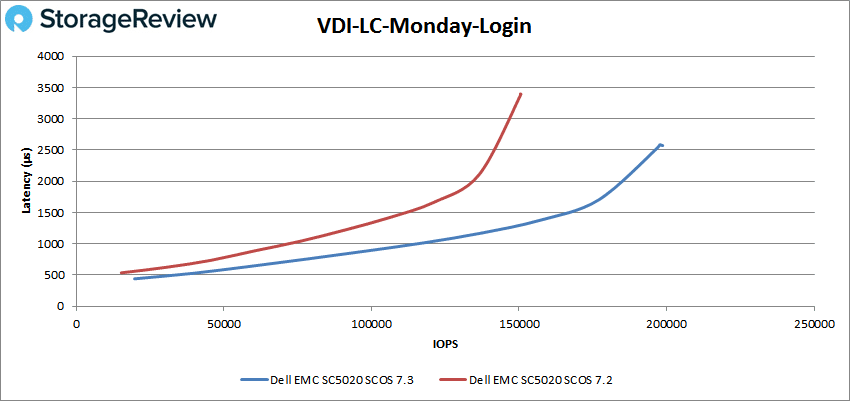
Finally, VDI LC Monday Login had the 7.2 with sub-millisecond latency until about 70K IOPS and a peak of 150,273 IOPS and a latency of 3.4ms. The 7.3 stayed under 1ms until it hit 115K IOPS and peaked at 198,092 IOPS with a latency of 2.6ms.
Conclusion
The Dell EMC SC5020 is one of the company’s midrange storage arrays that can be configured with HDDs, SSDs, and in a hybrid setup. The 3U SC5020 is designed for SMBs that need higher levels of performance and capacity, with a max raw of 2PB with expansion enclosures. The array provides HA with two active/active hot-swappable controllers. The SC5020 can help customers lower costs and be more efficient through intelligent data reduction and RAID and storage tiering that allows it to respond to current needs. And the latest update of SCOS to 7.3 brings Unisphere to the array, a more intuitive UI with more benefits.
For our application workload analysis, we ran our SQL Server and Sysbench tests. With SQL Server, we saw an aggregate transactional score of 12,630.2 TPS and an aggregate average latency of 7ms. For Sysbench, we tested several sets of VMs including 8, 16, and 32VMs resulting in TPS scores of 14,743, 18,385, and 26,723 respectively. Looking at average latency, we saw 17.4ms, 27.9ms and 38.6ms in 8, 16, and 32VMs. And our worst-case 99th percentile latency had only 33.6ms at 8VM, 55ms at 16VM, and 76.7ms at 32VM.
Looking at VDBench performance, there was an increase across the board switching from SCOS 7.2 to 7.3. And in some cases, there was a very dramatic boost. Instead of rehashing the numbers above, we are going to look at some of the percentages of improvements. For the 4K random, once we upgraded we saw a 62% increase in peak performance on read and a 102% increase in writes. For 4K sequential, we saw a 35.6% improvement in reads and a 53% improvement in writes. Some other notable performance improvements include 64K write (62% increase), SQL (44.8% increase), VDI FC Initial Login (77.5% increase), and VDI FC Monday Login (62% increase).
We’re clearly excited about the performance profile the all-flash SC5020 array offers; and that doesn’t even factor in that its pricing profile is very good too. It’s simply astounding to see what Dell EMC has done with a “point release” of the underlying SCOS. Furthermore, with SCOS 7.3, users get access to a much more modern look and feel with Unisphere, bringing SC storage management more current. While Unity is obviously a great product for Dell EMC, it’s refreshing to see the company’s continued commitment to the SC storage family as well. We continue to have tremendous respect for the Dell EMC SC Storage family and specifically, the SC5020.
Sign up for the StorageReview newsletter

