

We first became acquainted with Diamanti two years ago at KubeCon 2017, and we were impressed with their vision: to provide a bare-metal container platform purpose-built for microservices and cloud-native environments, and optimized for Kubernetes or, basically, a hyperconverged infrastructure appliance for Kubernetes. We saw this as an interesting play and last year at KubeCon 2018 we started to talk to them about working with us to understand storage on Kubernetes and how Kubernetes storage can be tested, and quantified in a methodical fashion so we can start to test and document Kubernetes storage performance.
Diamanti has been great to work with and have been able to provide us with the deep understanding of Kubernetes and Kubernetes storage that we needed to create our testing methodology. Diamanti was started by former VMware, VERITAS, and Cisco Engineers and is funded by Goldman Sachs and other well-known VCs which is impressive but what is more impressive is Diamanti has been a major contributor to the storage and networking standards (namely FlexVolume/CSI and CNI) that have been accepted into upstream Kubernetes code.
Enterprise business is evolving at the speed of light, and companies are trying to keep pace with this evolution with new technologies to speed up their entire production cycle of applications. Containers was the technology designed to accelerate application development and deployment, but building them on legacy infrastructure can be complicated and quickly becomes a considerable obstacle to structure a fully functional container stack. Containers are incompatible with traditional storage and network infrastructure, so a do-it-yourself (DIY) approach to building a container environment is IT-challenging, costly and slow-paced. The Diamanti Enterprise Kubernetes Platform is intended to give infrastructure architects, IT operations, and application owners the speed, simplicity, efficiency, and control they need to run stateful containerized applications at scale.
The Diamanti Enterprise Kubernetes Platform is a bare-metal container platform focused on the networking and storage aspects of getting up and running fast, especially for large enterprises. With open-source Docker and Kubernetes fully integrated, together with purpose-built hardware and complete support for the entire stack, the Diamanti Enterprise Kubernetes Platform is a full container solution that could be deployed in minutes. Diamanti states to have unmatched performance and utilization on its Enterprise Kubernetes Platform; the secret sauce for this performance is using a unique hyper-converged architecture designed specifically for the way Kubernetes containers use network and storage resources.
Diamanti D10 Specifications
| Network | 4×10 GbE via a single QSFP+ connection (per node) |
| Storage | |
| Data Storage | 4 TB configuration (4x 1000 GB NVMe SSD per node) 8 TB configuration (4x 2000 GB NVMe SSD per node) 32 TB configuration (4x 8000 GB NVMe SSD per node) |
| Host OS and Docker Image Storage | 960 GB (2x 480 GB SATA SSD per node) |
| Compute | |
| CPU | 2x Intel Xeon Processors with 20 / 32 / 44 cores (per node) |
| RAM | 192 GB / 384 GB / 768 GB (per node |
| Physical | |
| Form Factor | 1U |
| Dimensions and Weight (Per Node) | 17.25″W x 28″D x 1.72″H / 52 lbs. 43.8cm x 71.1cm x 4.4cm / 24 kg |
| Power | Dual redundant 110/220V power supplies |
| Environmental | Operating temperature: 50°F to 95°F (10°C to 35°C) |
Build and Design
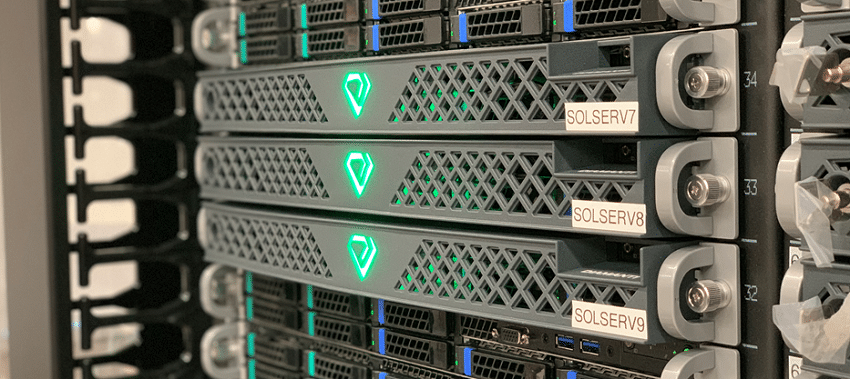
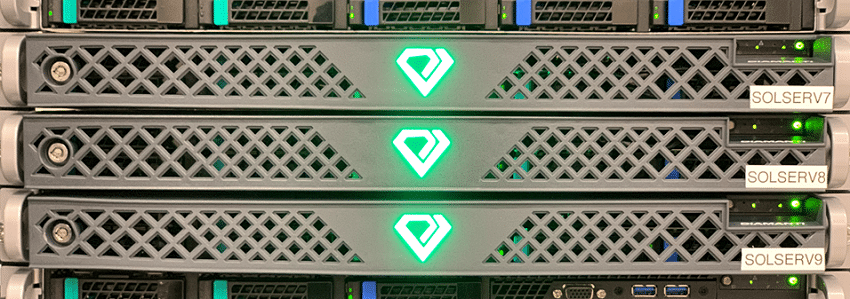
The Diamanti appliance is the physical hardware of Diamanti’s container stack solution. This appliance is offered in a minimum three-node cluster, where each node is a 1U rack providing up to 32TB of data storage capacity and 960GB for host OS and Docker image storage.
The front of a node shows an aluminum grill designed for efficient airflow with the company’s log in the middle and on the top-left, a locking mechanism. On the top-right of the front, is the control panel that provides a power switch, along with indicator LEDs for system health. Removing the aluminum grill will reveal the drive slot locations, also one VGA and two USB ports.
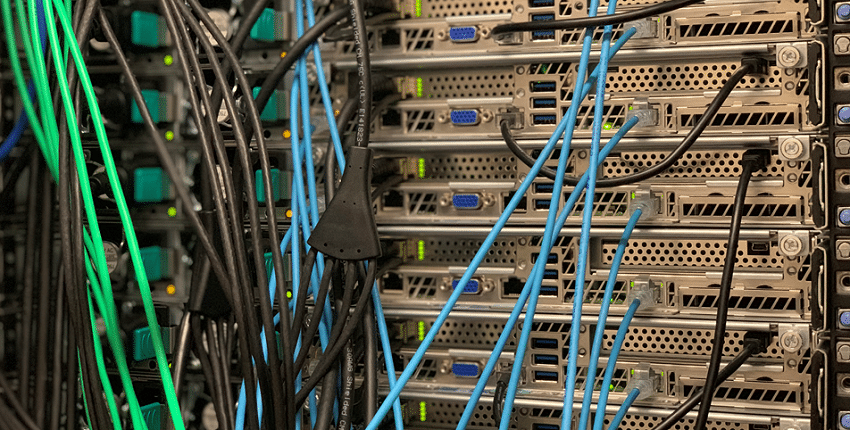
Moving around to the rear of the appliance, we see the ports of the device. Here we highlight the left two independent power supply and a ventilated system; and in the middle/right, the two management ports, a 10GbE port to connect nodes with high-performance and low-latency, a QSFP+ port (for 4x10G SFP+), and 4 USB ports to connect a keyboard and other peripherals.
Management
The appliance ships with pre-integrated full software stack including OS, Docker, Kubernetes and other container convergence services. It provides dashboards and reporting functions via a browser, CLI or REST API, and Diamanti OS. The Diamanti Enterprise Kubernetes Platform is K8s certified; a certification designed by CNCF organization.
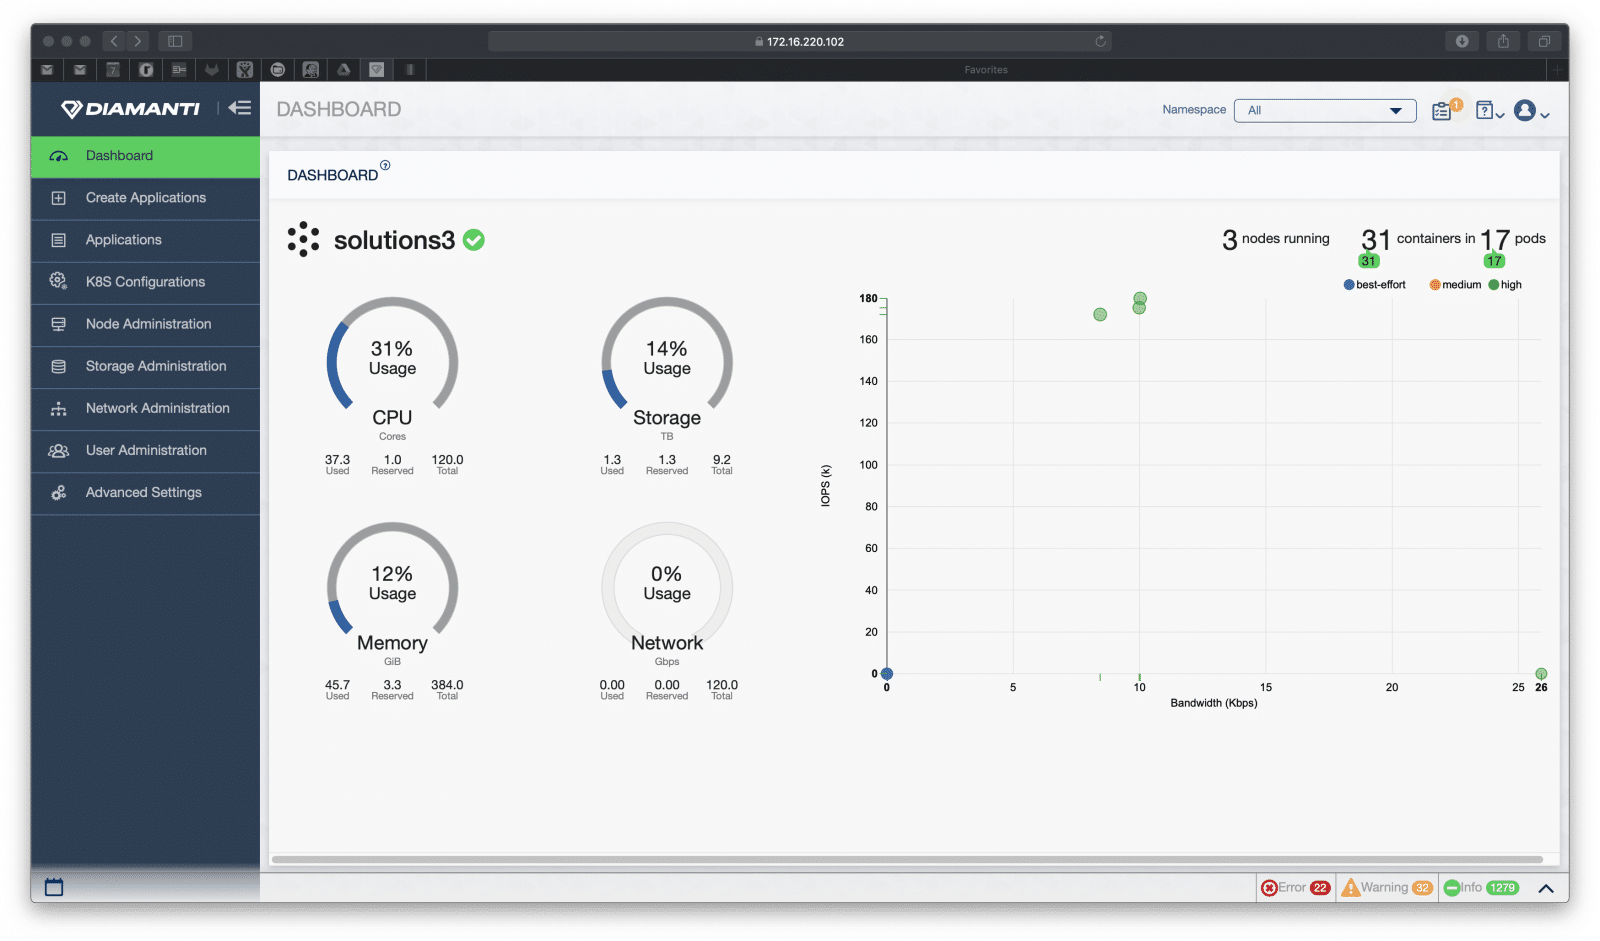
For management we look to the Diamanti console. Opening it up we go straight into the dashboard that has basic information that is easy to quickly read over. Here we can see how many nodes are running, how many containers, and how many pods. The usage of CPU, storage, memory, and network are also easily seen in percentages on the left. On the right is the bandwidth in Kbps.
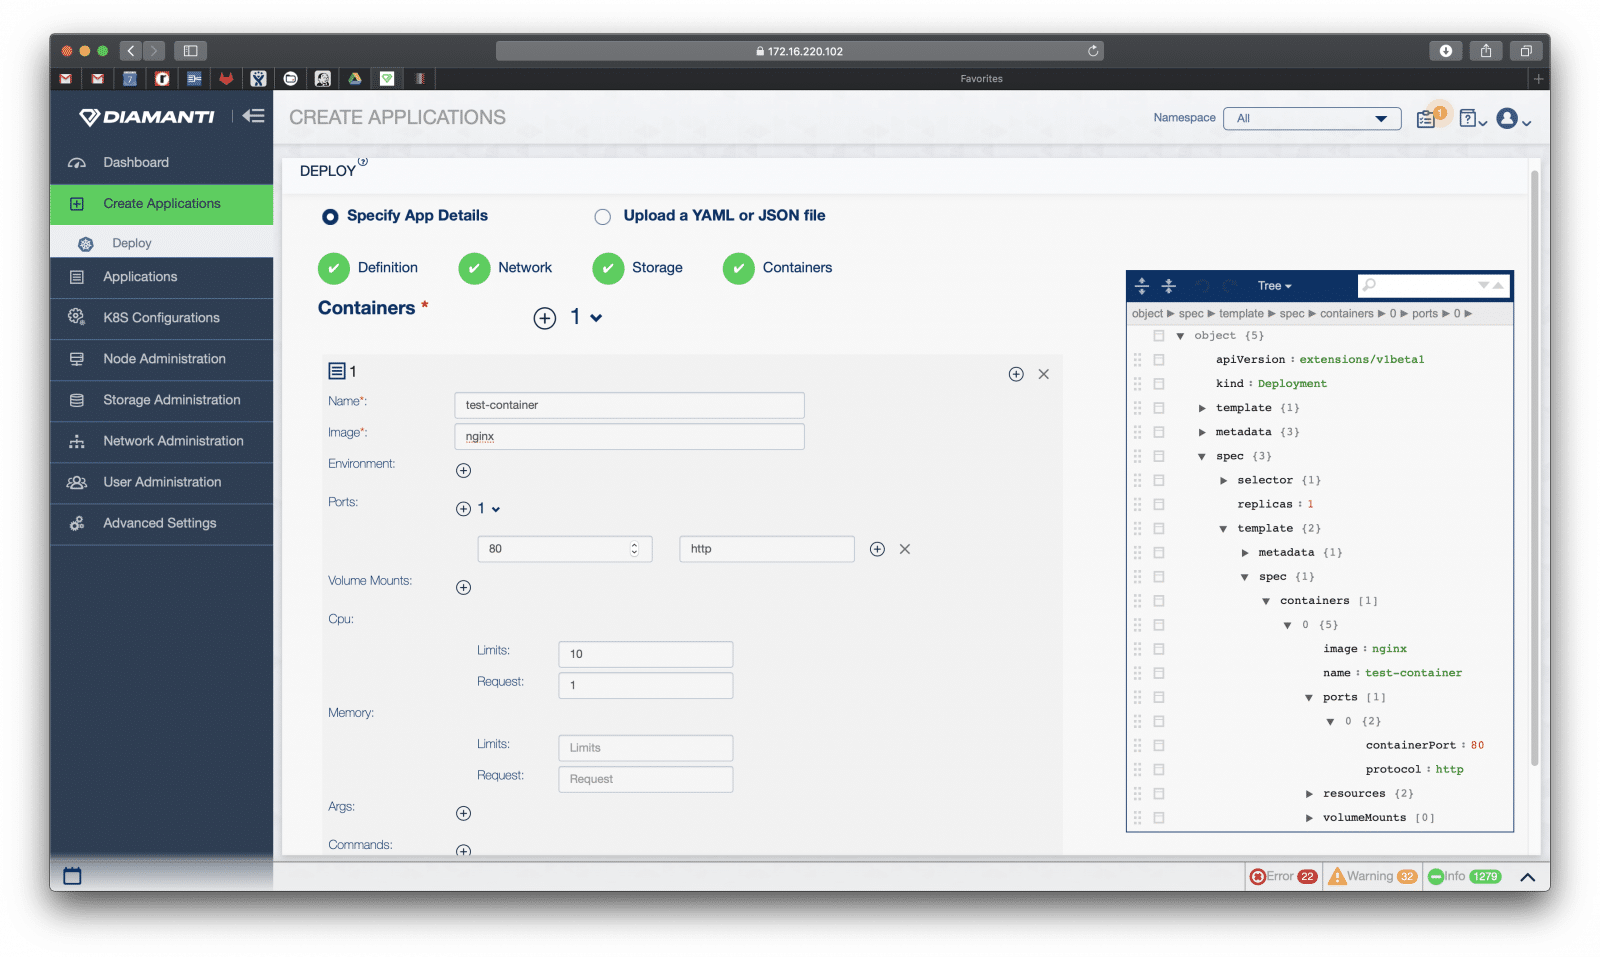
The next main tab down is Create Applications. Once users have the applications they want created, the sub-tab is Deploy with a little Kubernetes icon. From here users need to put in the information like name, image, environment, port, volume mounts, and the amount of CPU and memory.
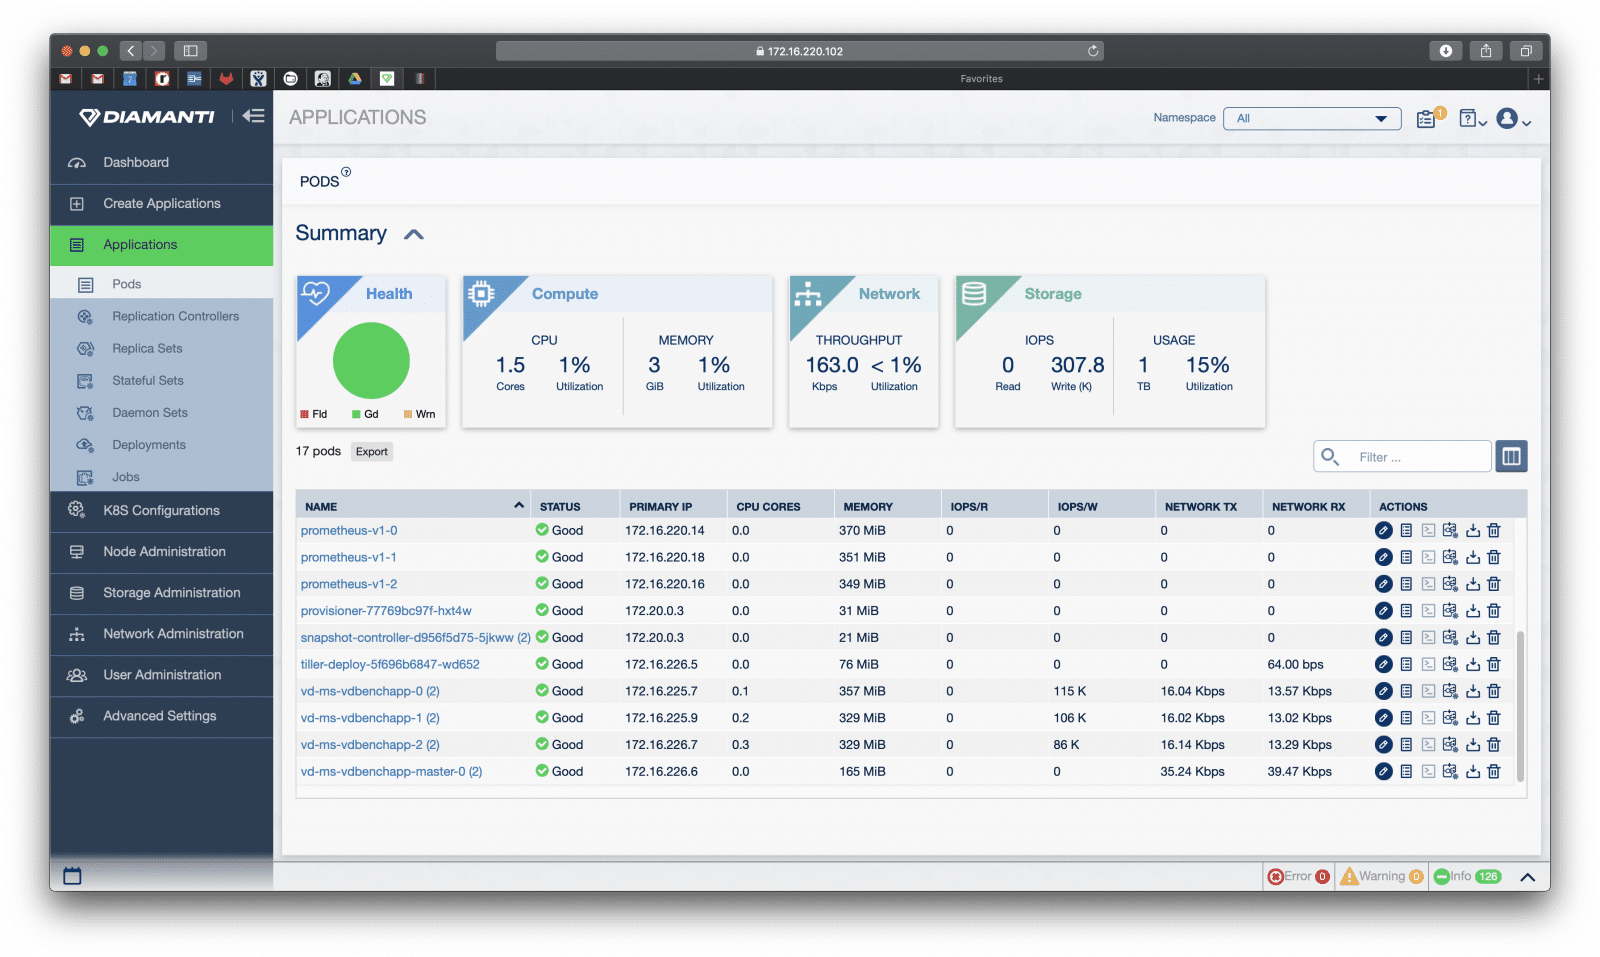
The next main tab down is Applications. Beneath the main tab are the sub-tabs: Pods, Replications Controllers, Replica Sets, Stateful Sets, Daemon Sets, Deployments, and Jobs. Pods gives users a brief summary of the health of a selected pod as well as the attributed compute, network, and storage.
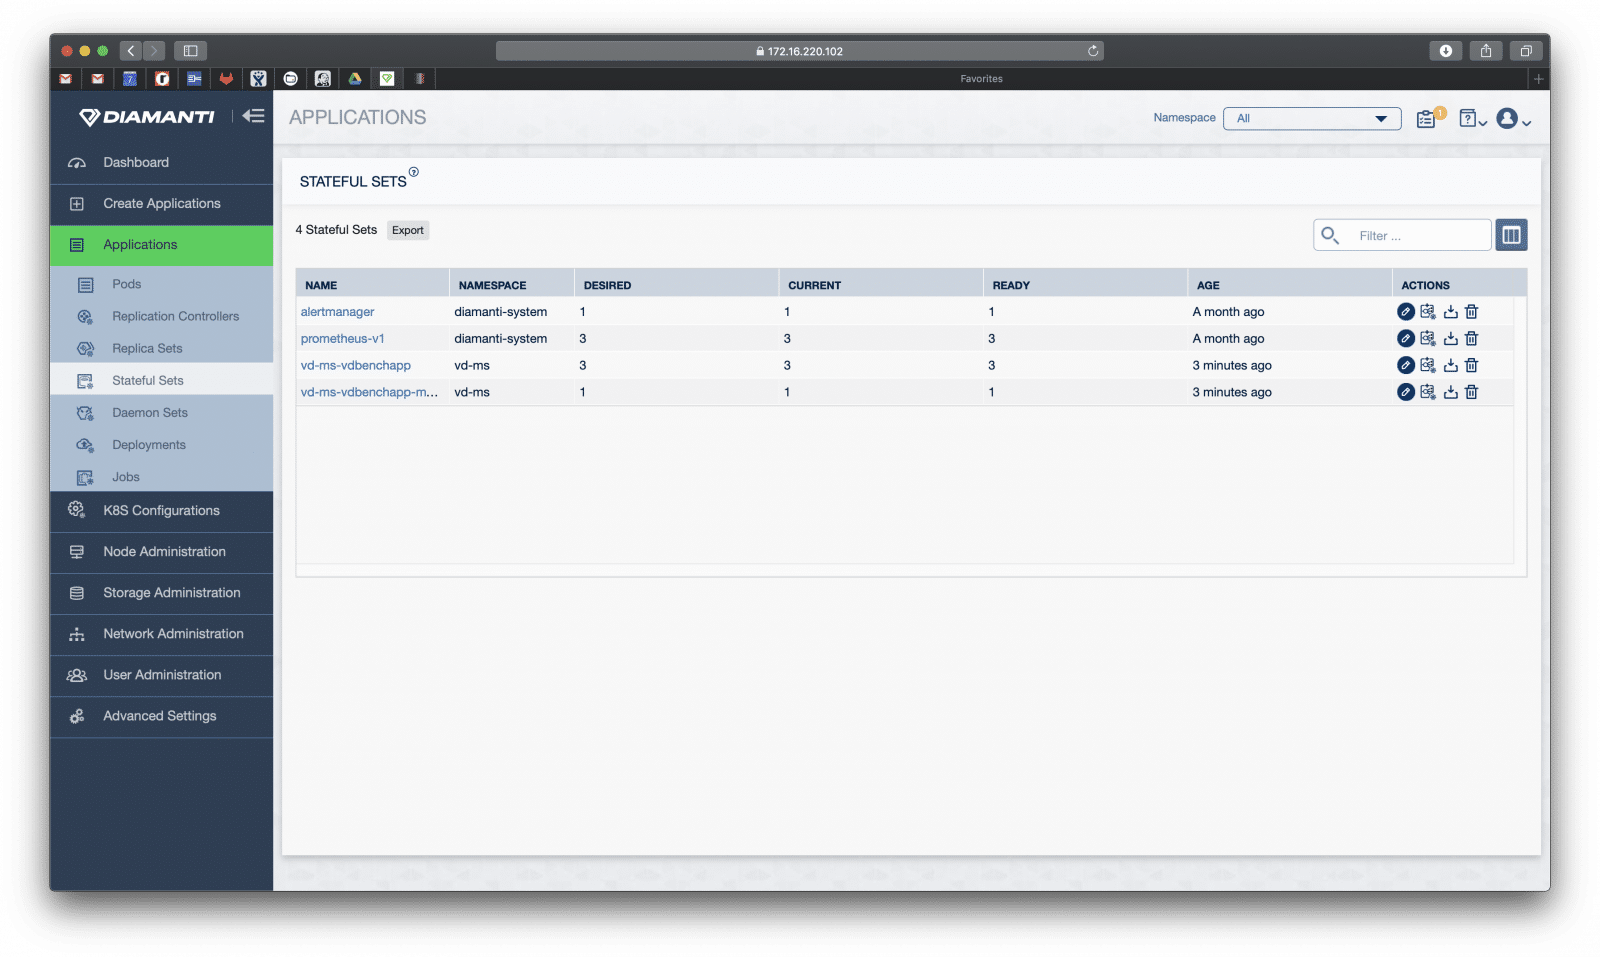
The Stateful Sets sub-tab enables users to drill down more into the sets and export them if needed. Here we are presented with basic information such as the name, namespace, desired number, current number, number ready, age, and options on what actions to take.
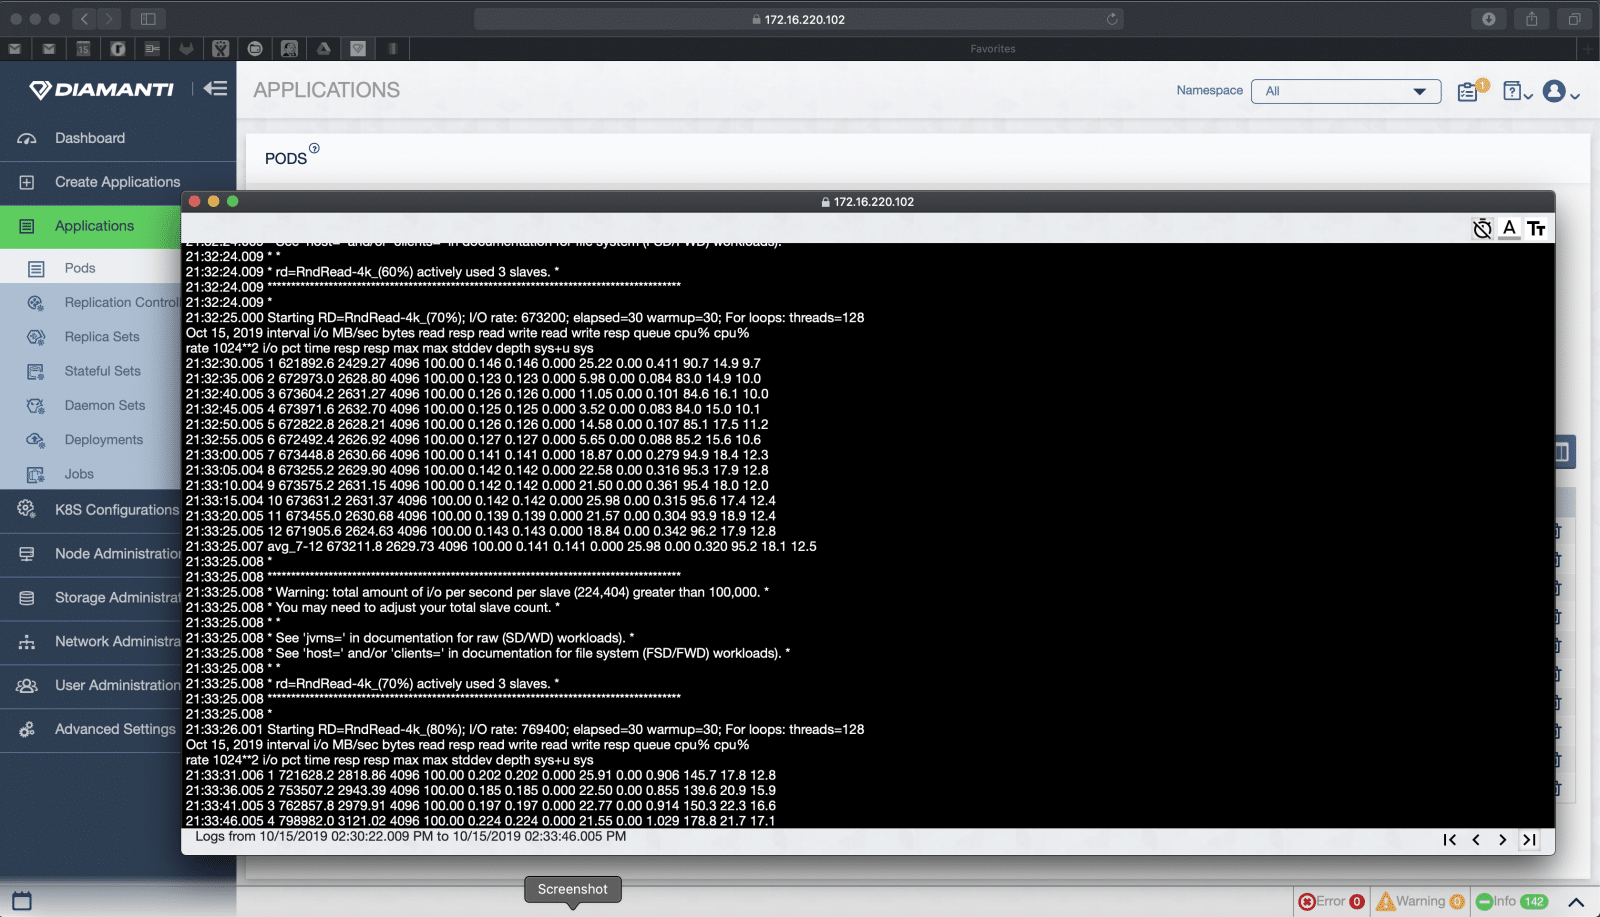
Users can drill down into Pod logs as well to see activity and any potential issues.
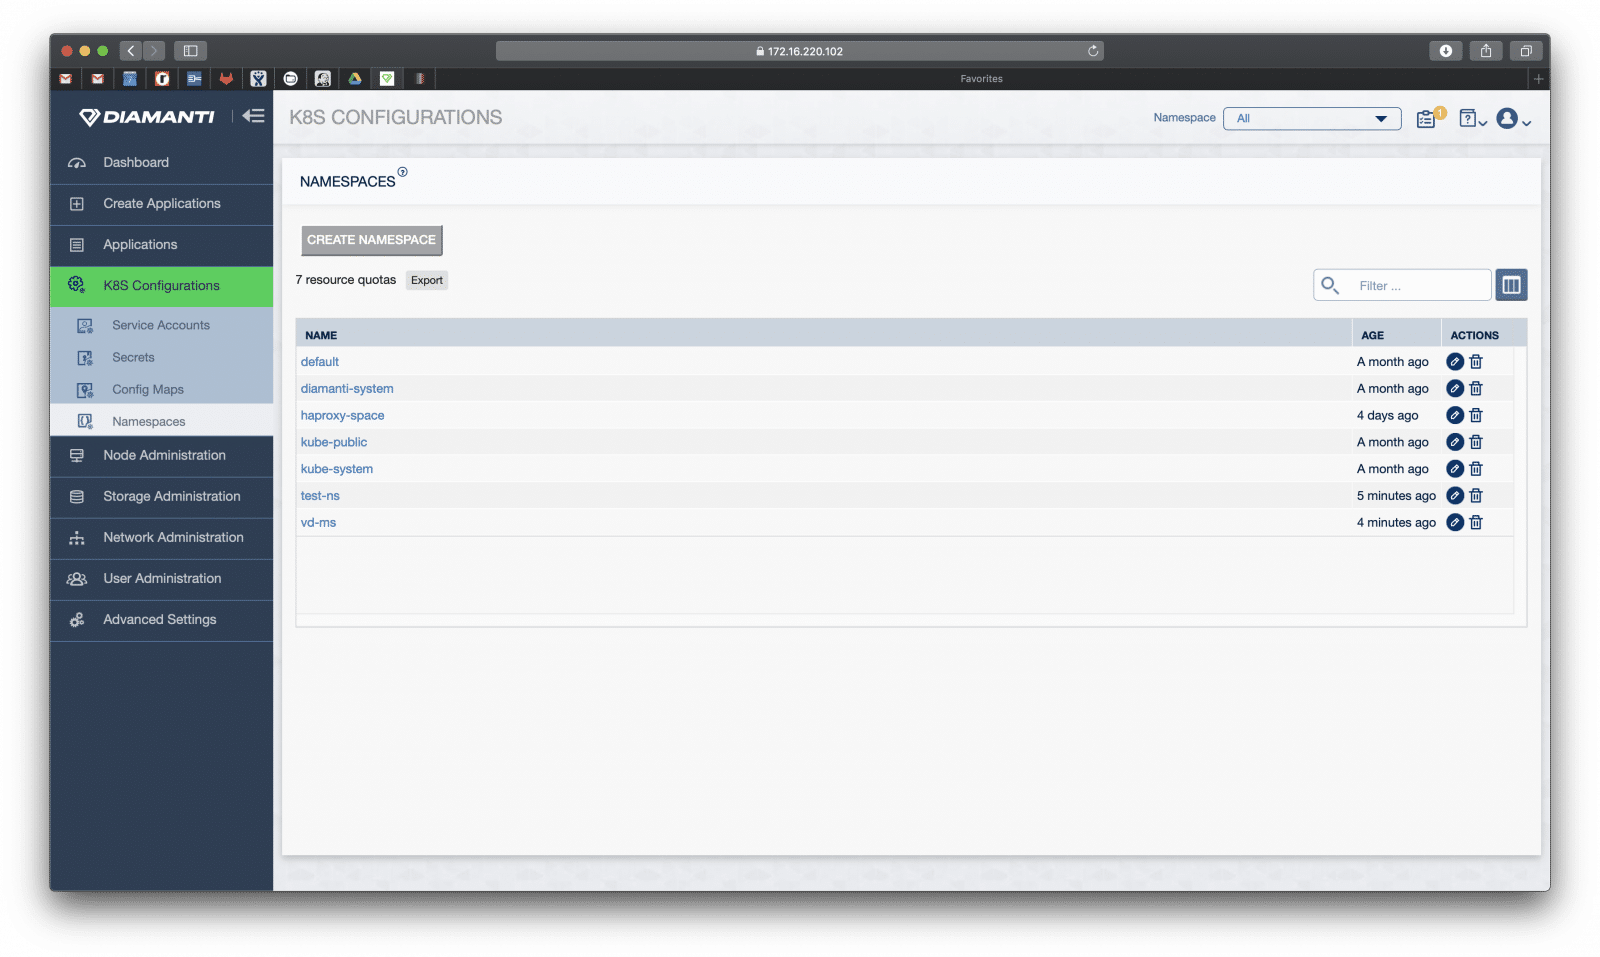
The next main tab down is K8S Configurations. Here users can manage Kubernetes related application configurations like Service Accounts, see Secrets, Config Maps, and create Namespaces.
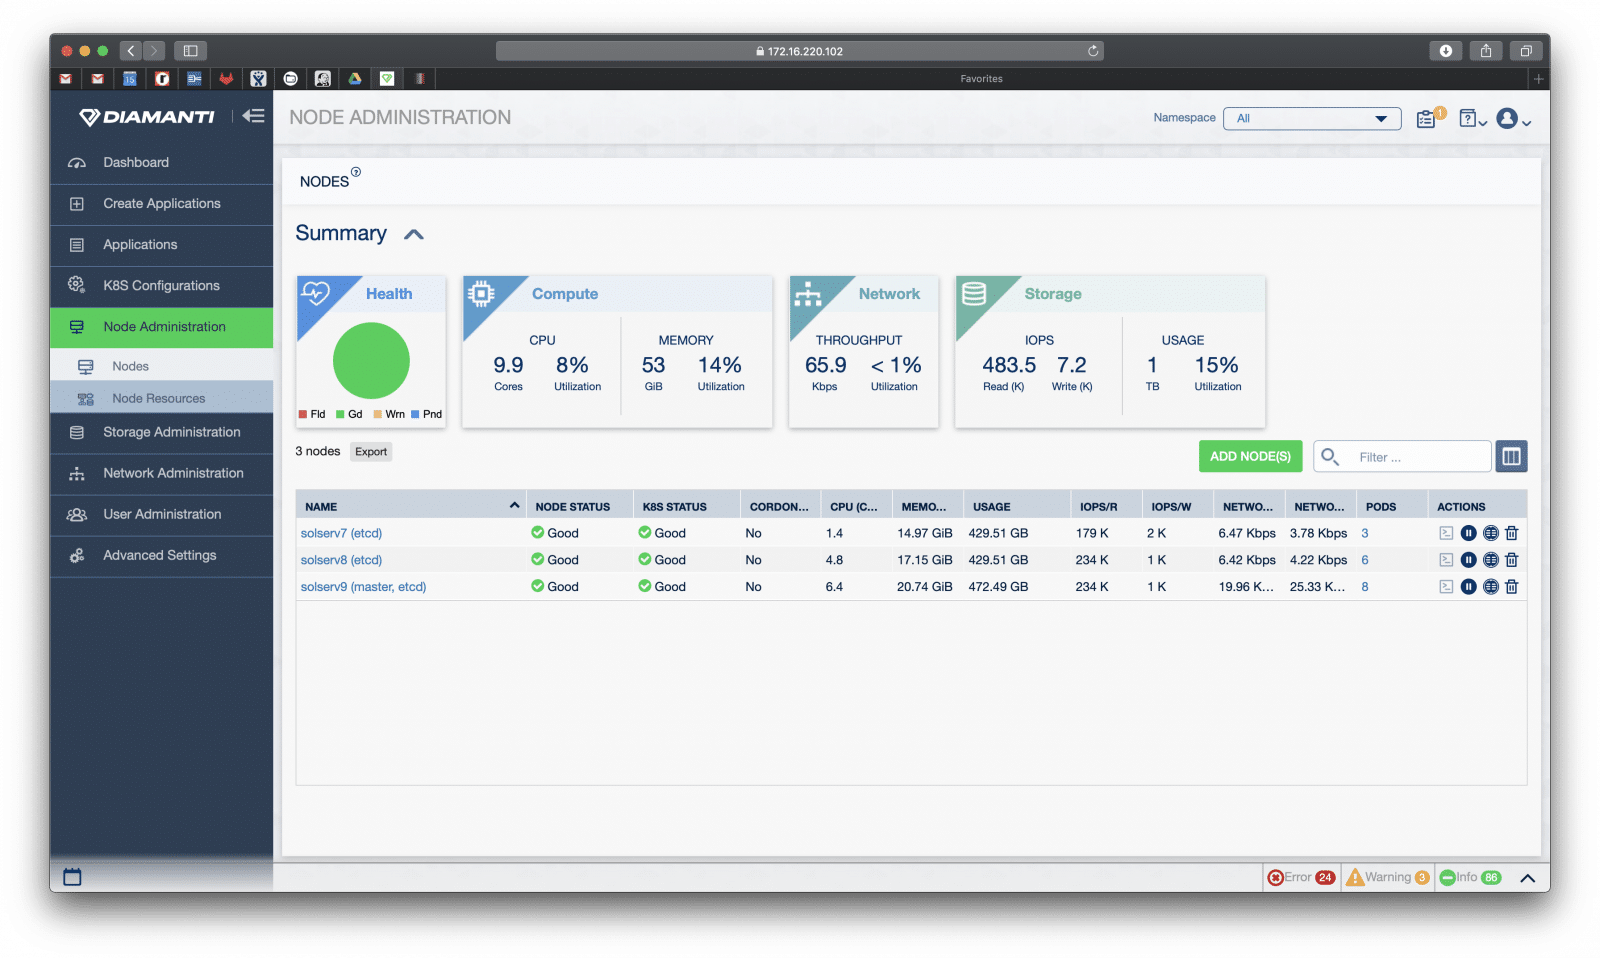
From the Node Administration tab users can view, add, or delete nodes as well as monitor Node Resources utilization. Again, here users can monitor the overall health of a given node and the resources: compute, network, and storage.
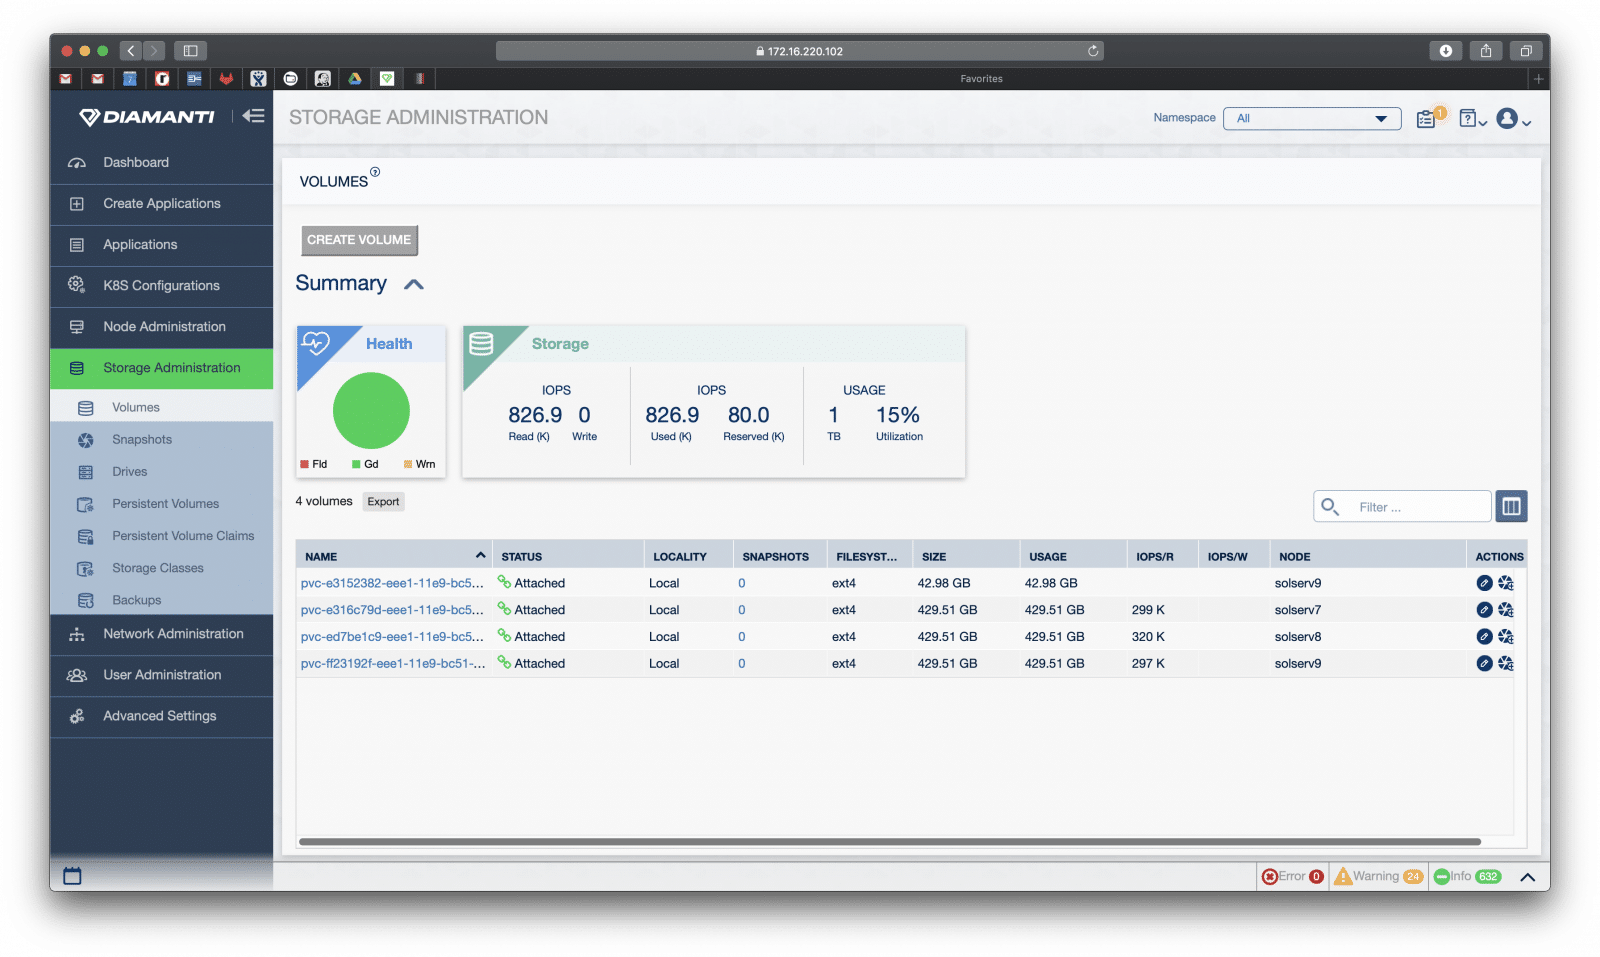
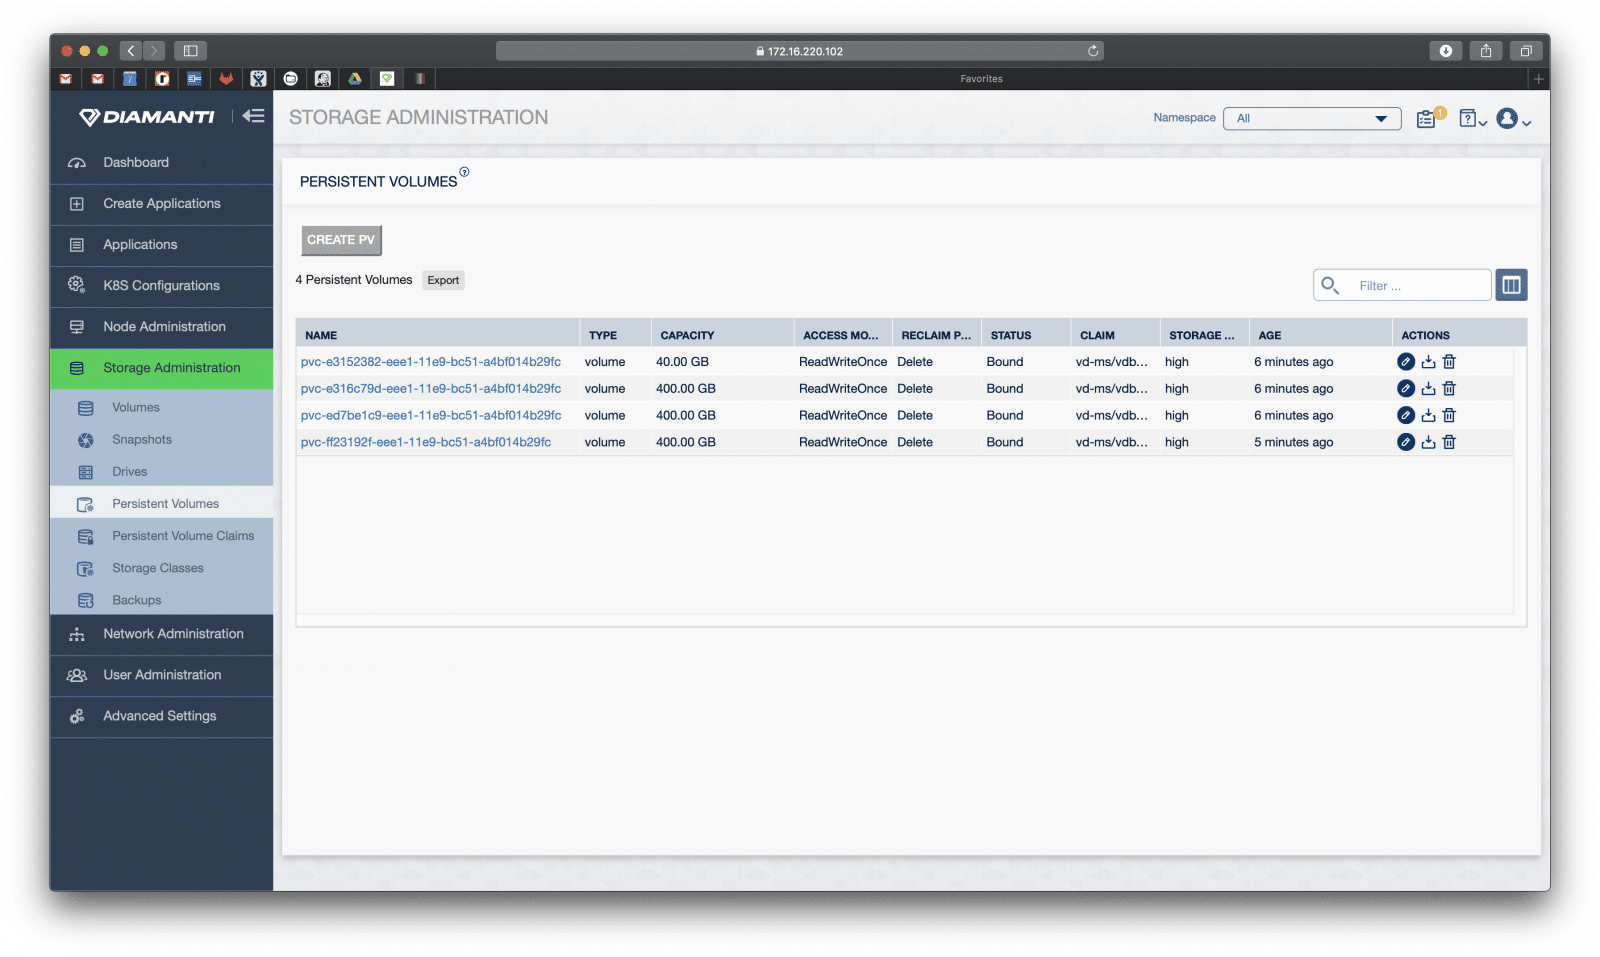
As the name of the tab implies, Storage Administration enables users to see all things storage including Volumes, Snapshots, Drives, Persistent Volumes, Persistent Volume Claims, Storage Classes, and Backups. Under the Volumes sub-tab, we are given the ability to create a new volume or see a summary of an existing one including its health, storage throughput, and usage.
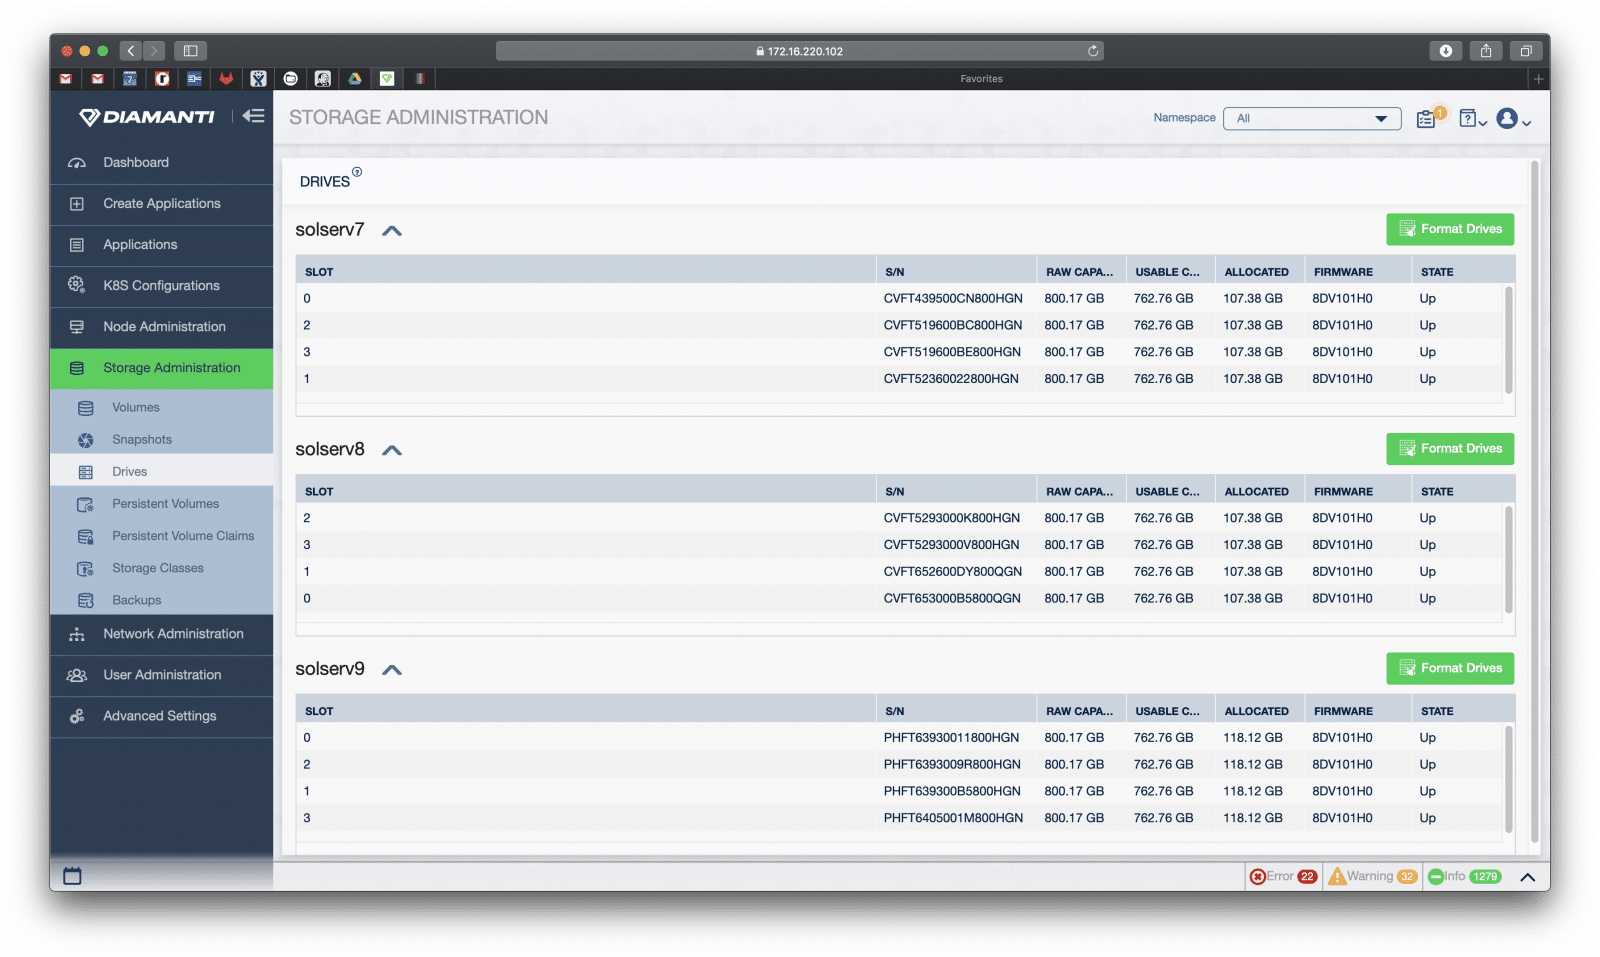
The Drives sub-tab allows users to see the physical drives leverages with information such as what slot the drive is in, its S/N, raw capacity, usable capacity, allocated capacity, its firmware, and what state it is in. The drives can be formatted from this sub-tab.
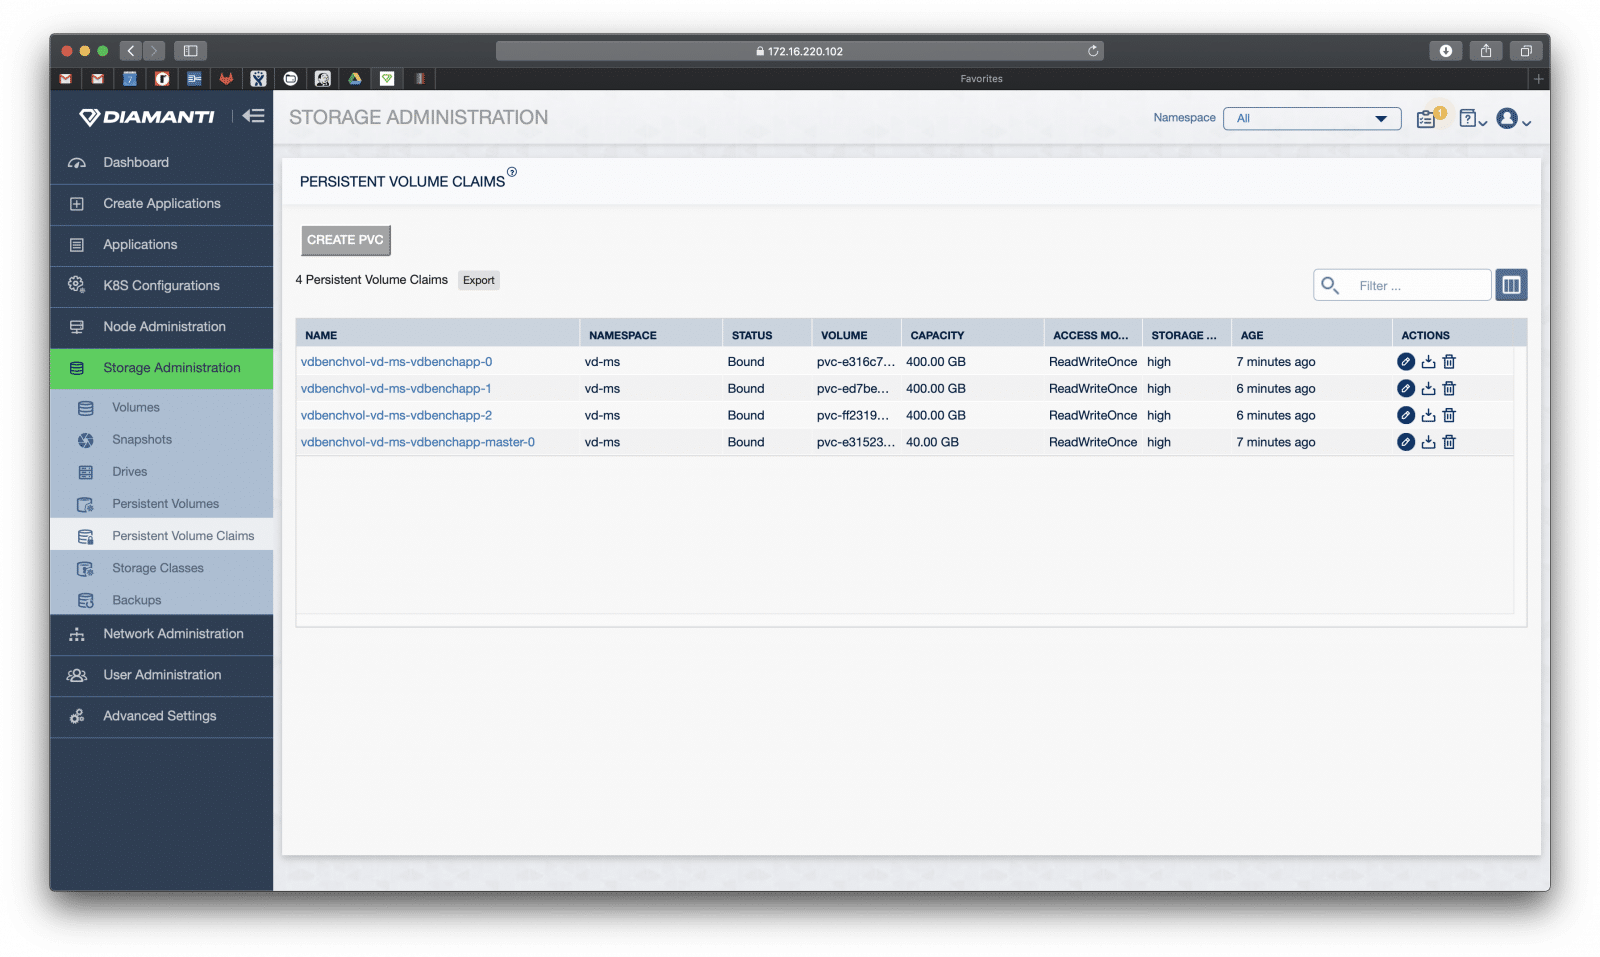
The Persistent Volumes sub-tab lets users create or export persistent volumes as well as giving information such as its name, type capacity, access, reclaim, status, claim, storage availability, age, and a list of actions including edit, export, and delete.
Persistent Volume Claims does the same as above for PVCs.
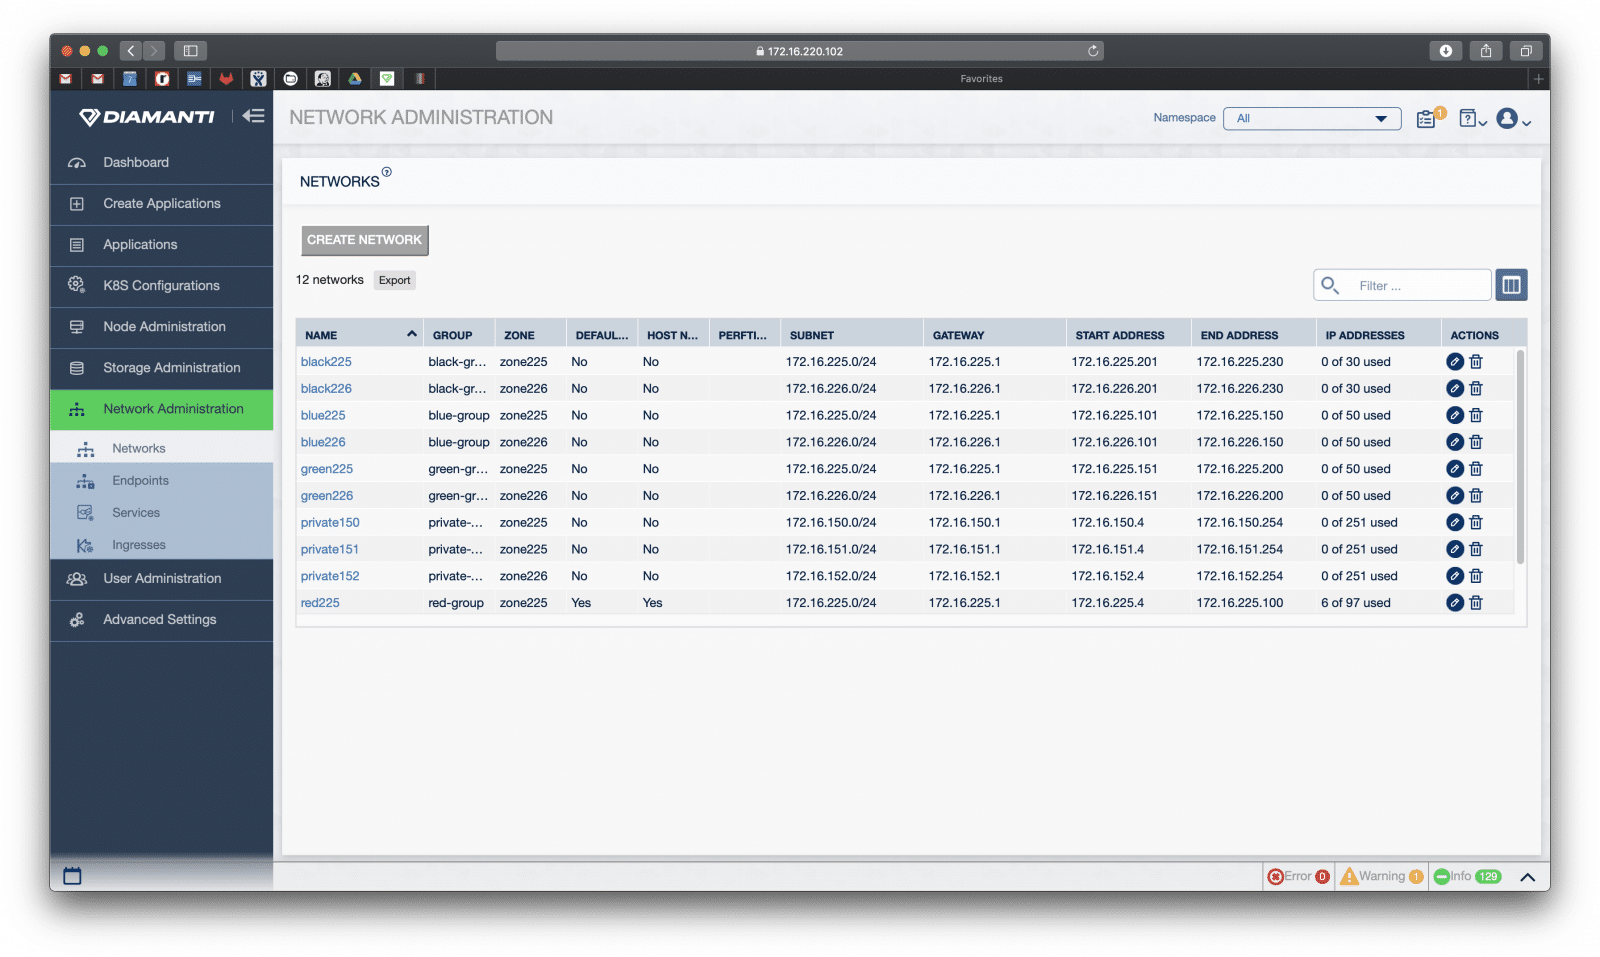
Our next main Tab is the Network Administration tab. Here users can create, delete, edit, or export networks. Here we are given information such as name, group, whether it is the default network, host network, its subnet, gateway, start address, end address, and IP address.
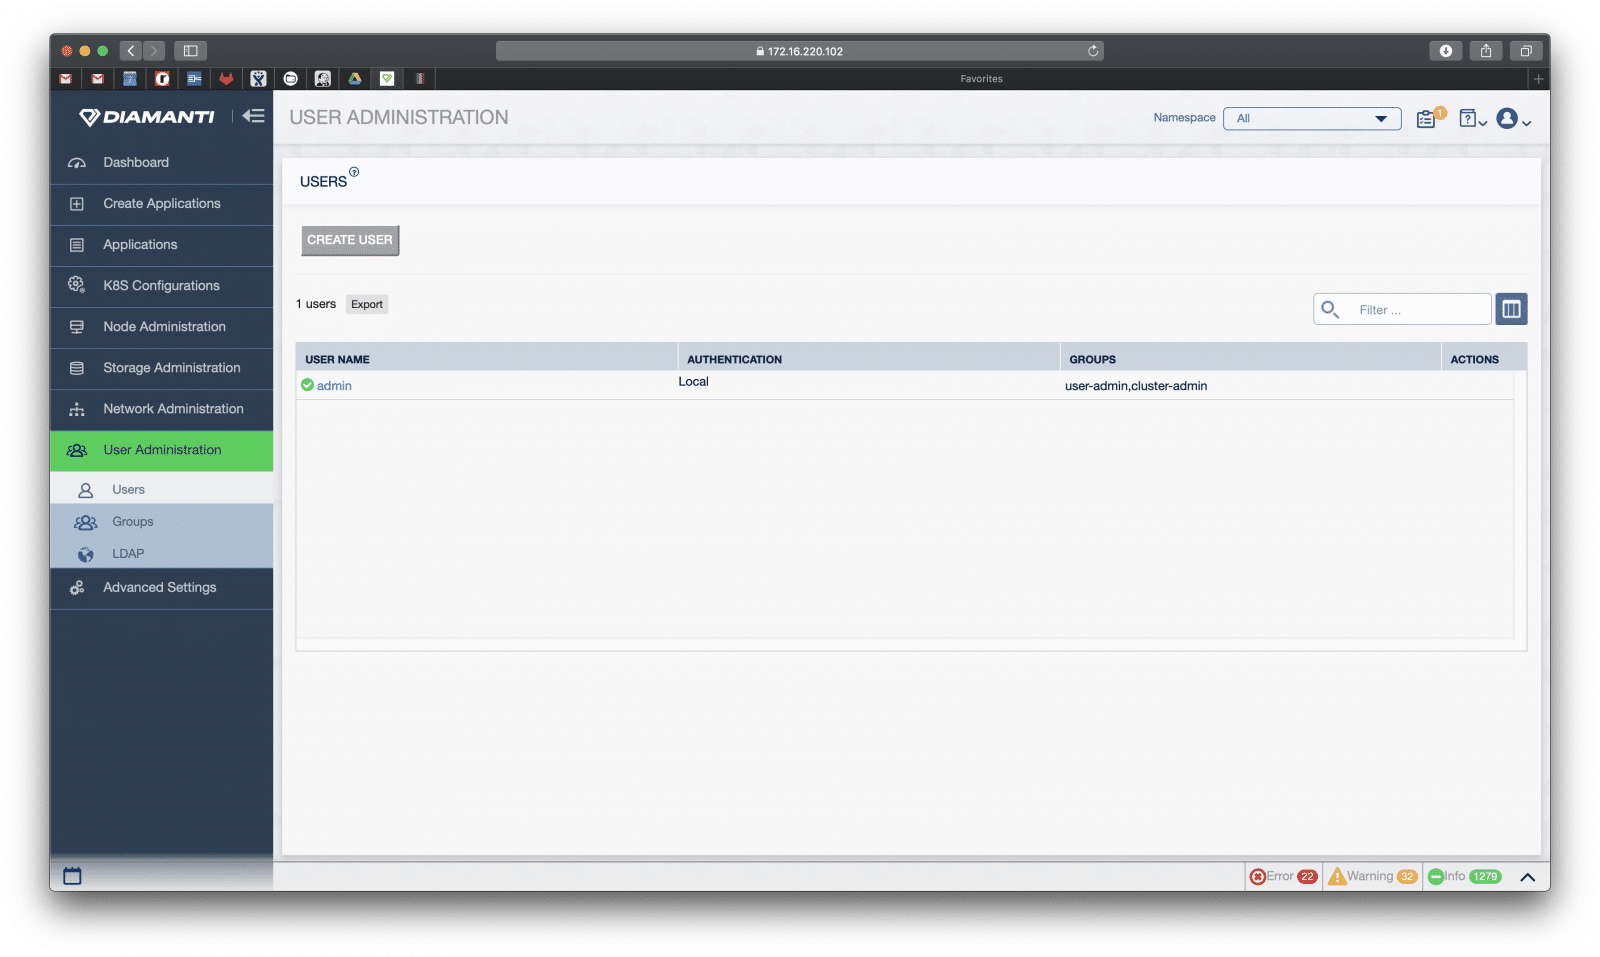
User Administration is fairly straightforward. Here admins can create users and groups and set up various policies for access control.
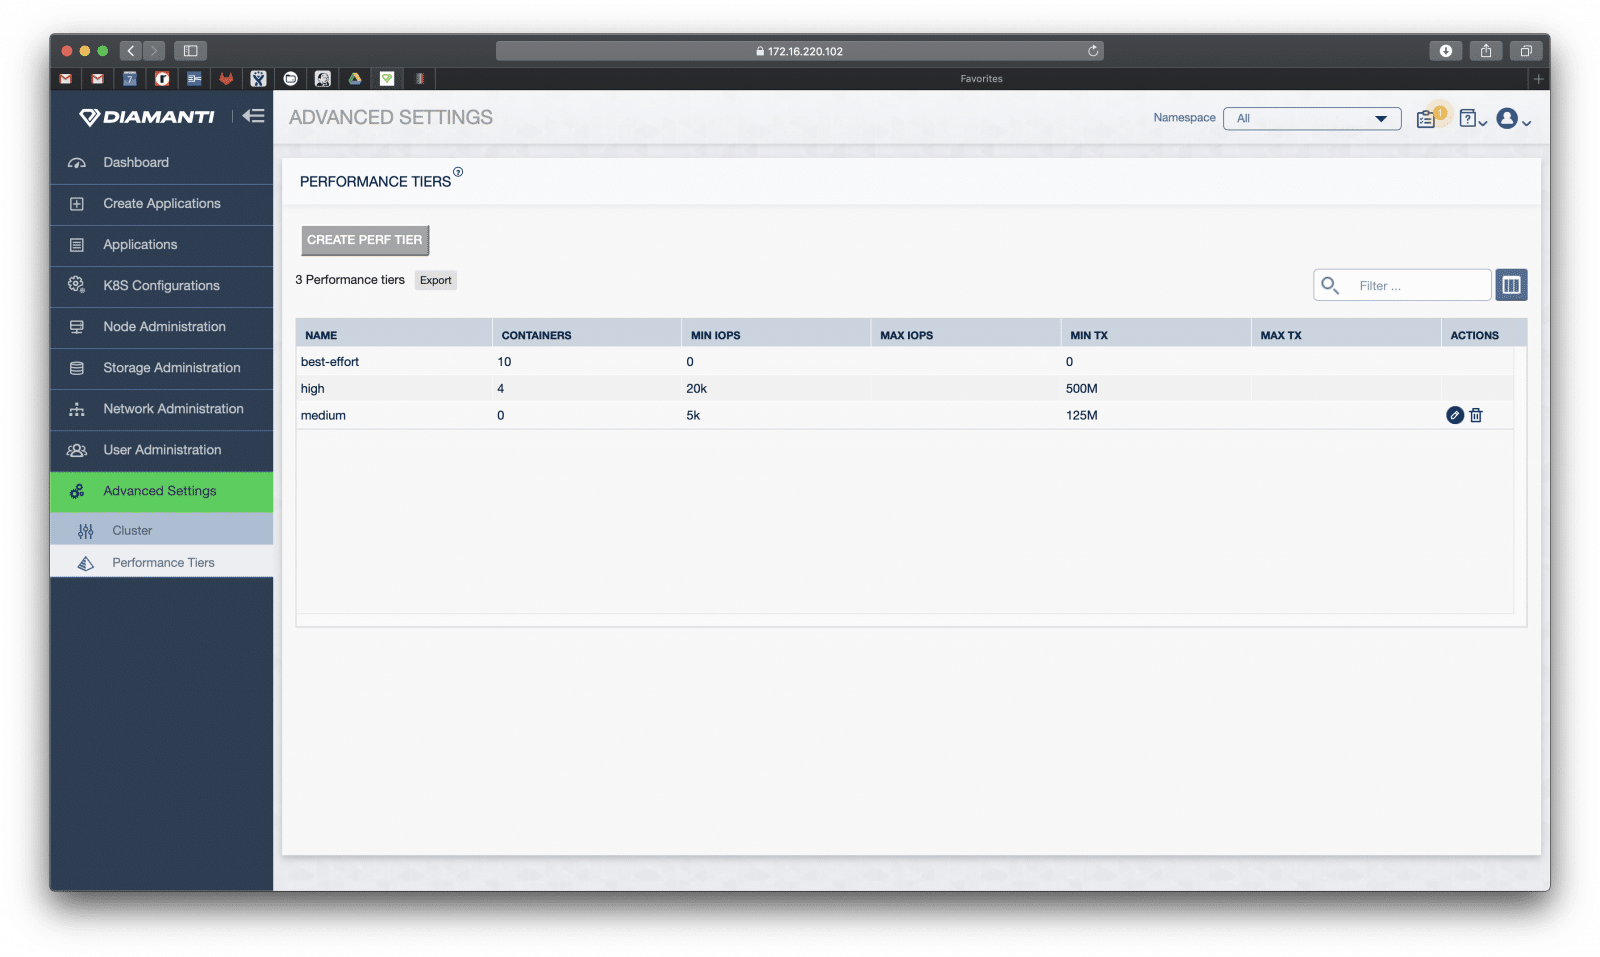
Advanced Settings allows admins to create and adjust the Cluster and Performance Tiers.
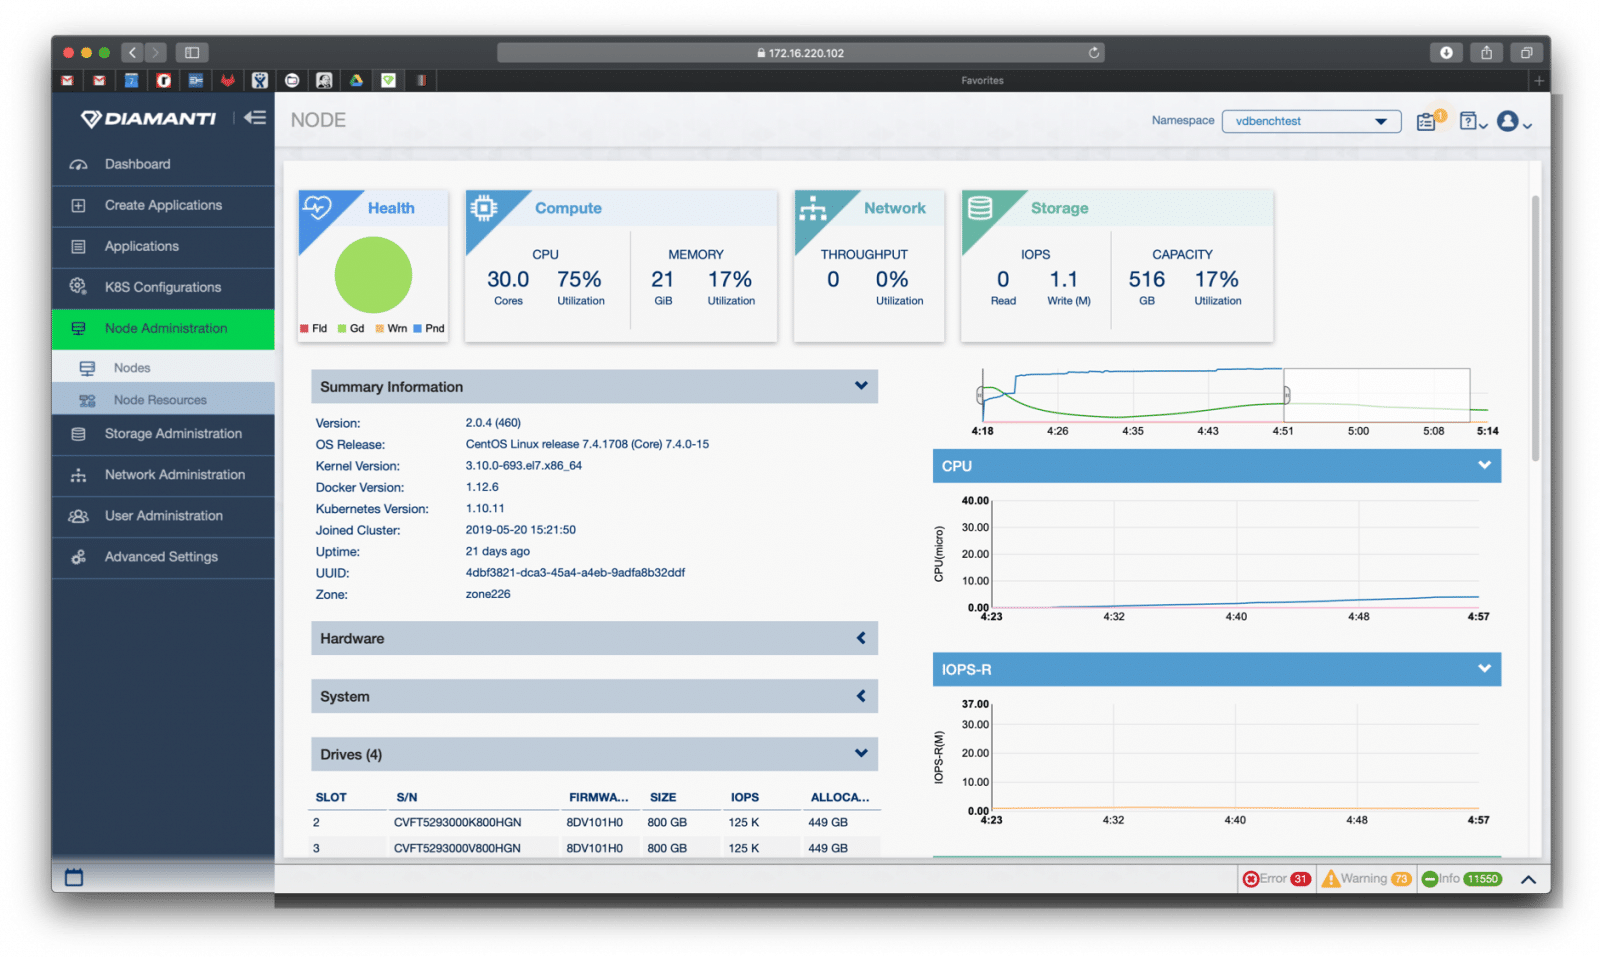
While we generally step through various management functions to give readers a generally idea of what to expect as they step through something, we are doing something a bit different this go round. We also ran our benchmarks so we can see what the GUI does with a heavier workload running on it. For each of these benchmarks we will be in the Node Administrations tab.
With our basic (random and sequential) tests one can easily see the draw on the compute as well as performance metrics out to the right.
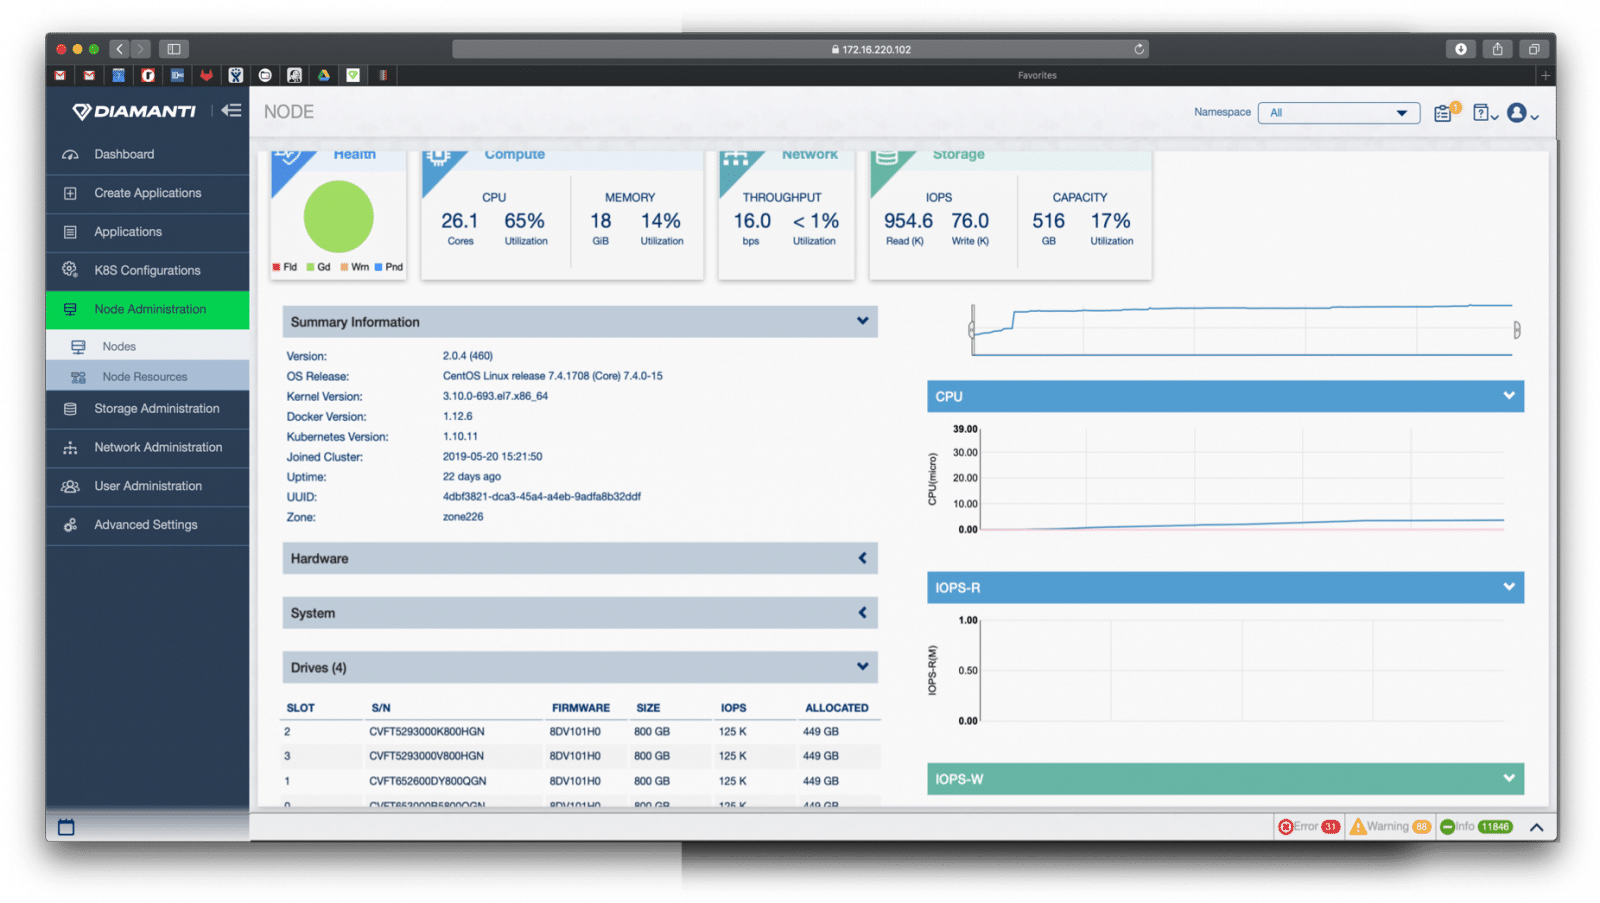
Our SQL test caused a fairly light toll on the compute and network while storage hit nearly 1 million IOPS.
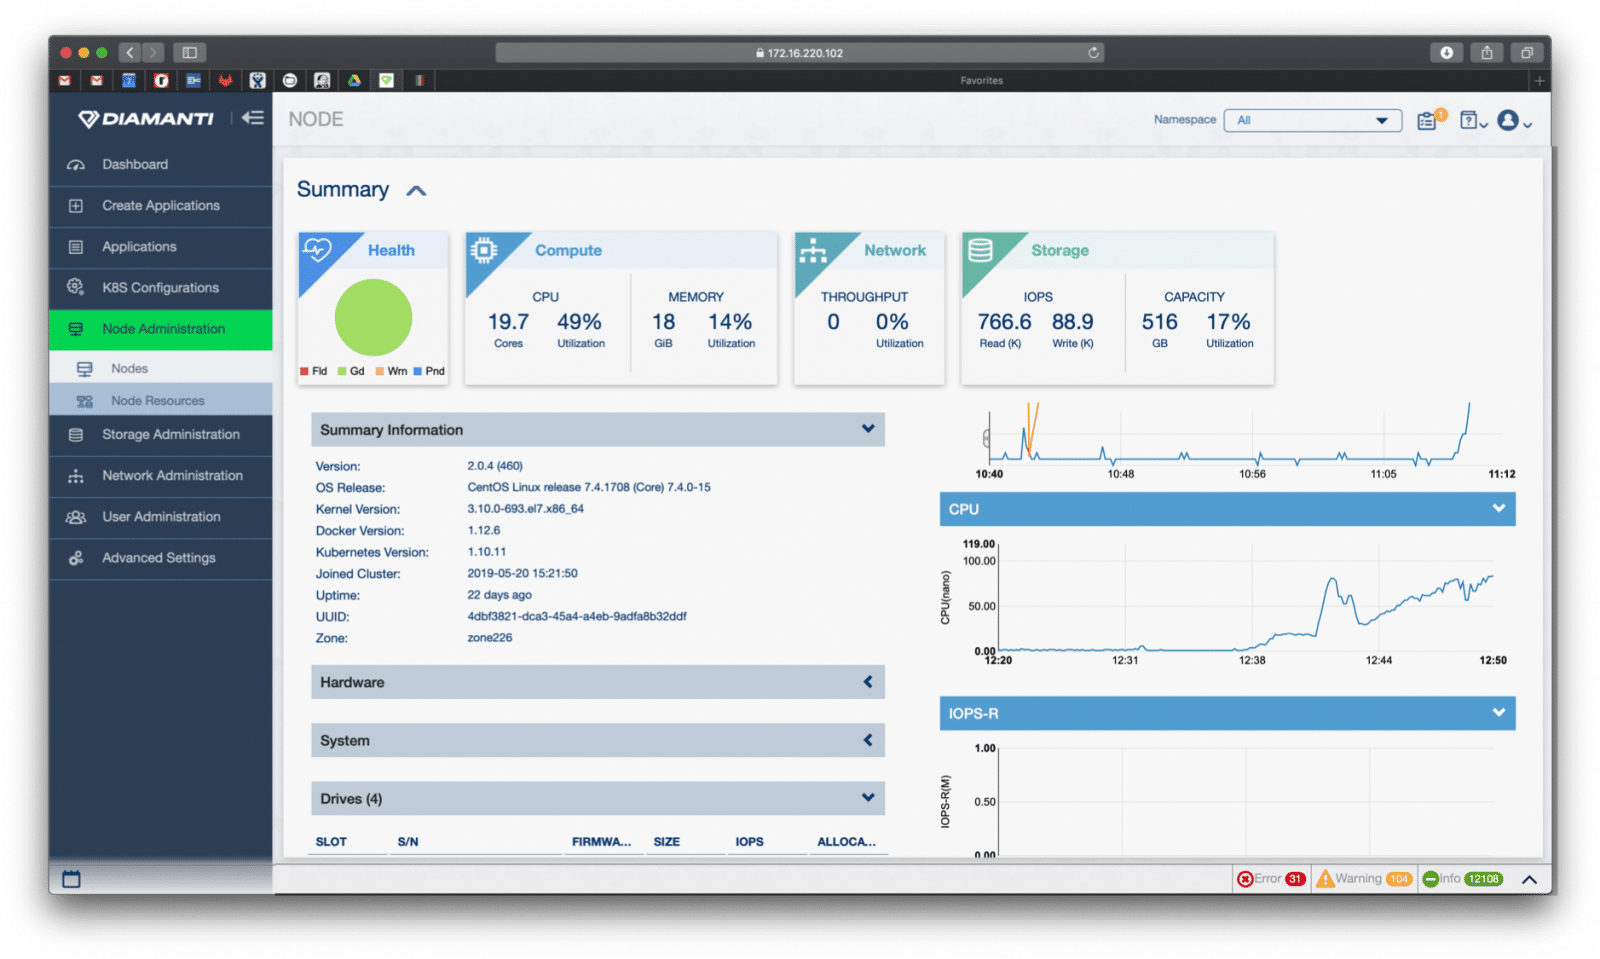
Finally, we give an example of what one expects while our Oracle test is running.
Performance
VDBench Workload Analysis
When it comes to benchmarking storage arrays, application testing is best and synthetic testing comes in second place. While not a perfect representation of actual workloads, synthetic tests do help to baseline storage devices with a repeatability factor that makes it easy to do apples-to-apples comparison between competing solutions. These workloads offer a range of different testing profiles ranging from “four corners” tests and common database transfer size tests, as well as trace captures from different VDI environments. All of these tests leverage the common Vdbench workload generator, with a scripting engine to automate and capture results over a large compute testing cluster. This allows us to repeat the same workloads across a wide range of storage devices, including flash arrays and individual storage devices.
Profiles:
- 4K Random Read: 100% Read, 128 threads, 0-120% iorate
- 4K Random Write: 100% Write, 64 threads, 0-120% iorate
- 64K Sequential Read: 100% Read, 16 threads, 0-120% iorate
- 64K Sequential Write: 100% Write, 8 threads, 0-120% iorate
- Synthetic Database: SQL and Oracle
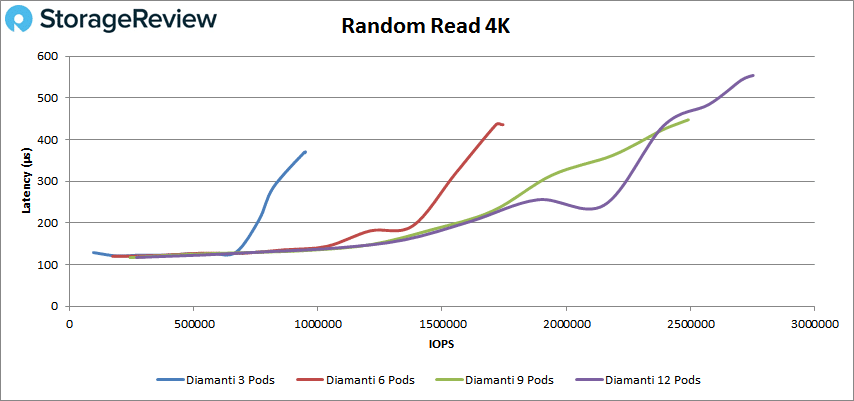
In all of our VDBench tests, we tested the Diamanti appliance based on different deployments running 3, 6, 9, or 12 Vdbench pods at a time to push the limit of appliance. Starting with random 4K read performance, all Vdbench pods started with a latency of 120μs; and IO performance ranging between the 3 pods at 95,863 IOPS and 12 pods at 269,208 IOPS. Looking at the peak performance, all configurations stayed under the 600μs latency. With 3 Vdbench pods, we saw a peak of 947,619 IOPS at a latency of 370μs; with 6 pods, a peak of 1,745,344 IOPS with a latency of 436μs; with 9 pods, a peak of 2,492019 IOPS at a latency of 447μs; and the last deployment, 12 pods, peaked at 2,753,170 IOPS with a latency of 554μs.
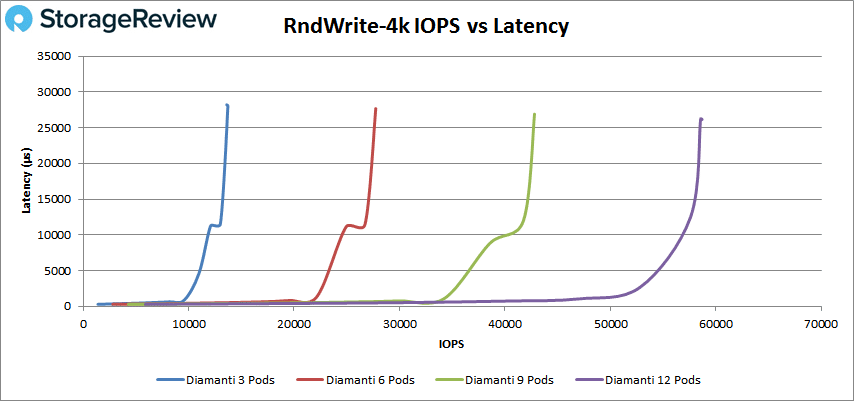
Looking at 4K write performance, all test deployments started under a latency of 300μs but quickly increased between 26ms and 28ms when reaching the maximum performance. The performance peaked with 3 pods at 13,719 IOPS; 6 pods at 27,747 IOPS; 9 pods at 42,805 IOPS; and with 12 pods at 58,559 IOPS. Showing a steady performance increase at more added pods.
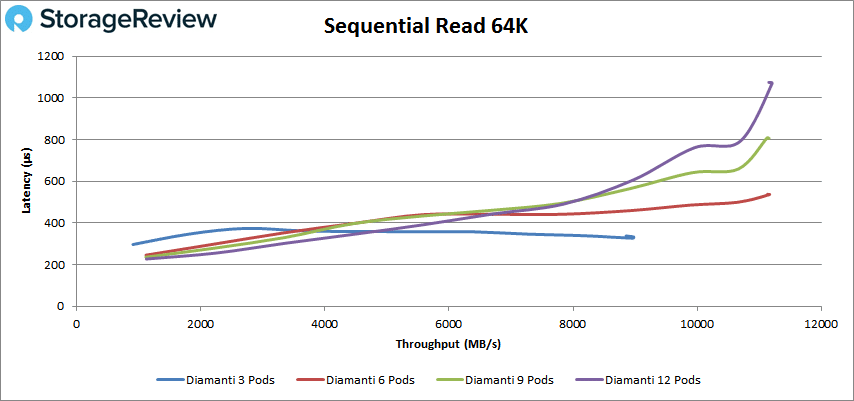
Switching over to sequential workloads, we look at 64K read performance of the appliance, and here the 3 pods deployment started at 14,560 IOPS or 910MB/s with a latency of 297μs. All other deployments started near the 18,000 IOPS or 1.1GB/s with a latency of 227μs. Regarding the peak performance of the deployments, the 3 pods deployment, went on to peak at 143,431 IOPS or 9GB/s at a latency of 327μs. All other deployments peaked at almost the same performance of 179,000 IOPS or 11.1GB/s, with the 12 pods deployment being the only one passing the mark 1ms latency.
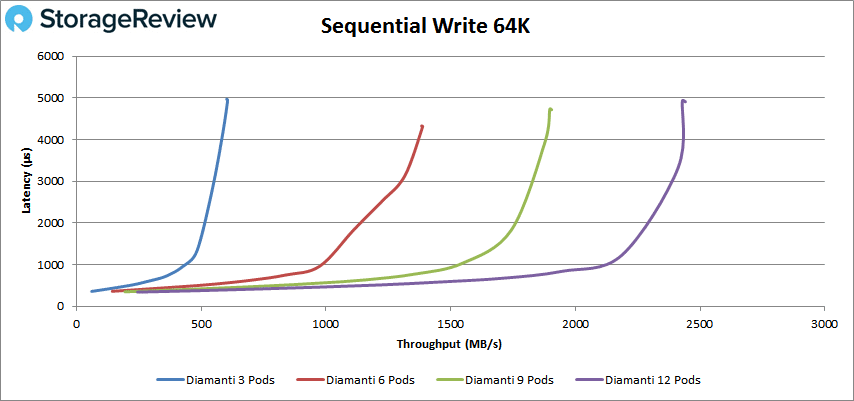
In 64K sequential write, all the deployments of the Vdbench started at a latency close to 350μs. The deployments peaked as follows: 3 pods, at 9,693 IOPS or 606MB/s with a latency of 4.9ms; the 6 pods, at 22,202 IOPS or 1.39GB/s with a latency of 4.3ms; the 9 pods, at 30,475 IOPS or 1.9GB/s with a latency of 4.7ms; and finally the 12 pods went on a peak at 32,052 IOPS or 2.4GB/s with a latency of 4.9ms.
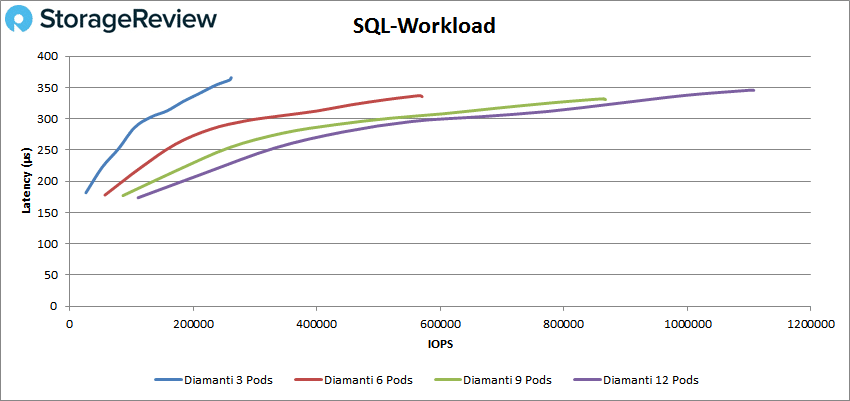
Our next set of tests are our SQL workloads: SQL, SQL 90-10, and SQL 80-20. For SQL, all the deployments started under the 180μs latency. The 3 pods started at 26,291 IOPS and went on a peak at 261,573 IOPS with a latency of 366μs. The 6 pods stared at 57,061 IOPS and peaked at 570,642 IOPS with a latency of 336μs. The 9 pods started at 86,197 IOPS and peaked at 885,269 IOPS with a latency of 332μs. And the 12 pods deployment started at 101,753 IOPS and went on a peak at 1,106,860 IOPS with a latency of 346μs.
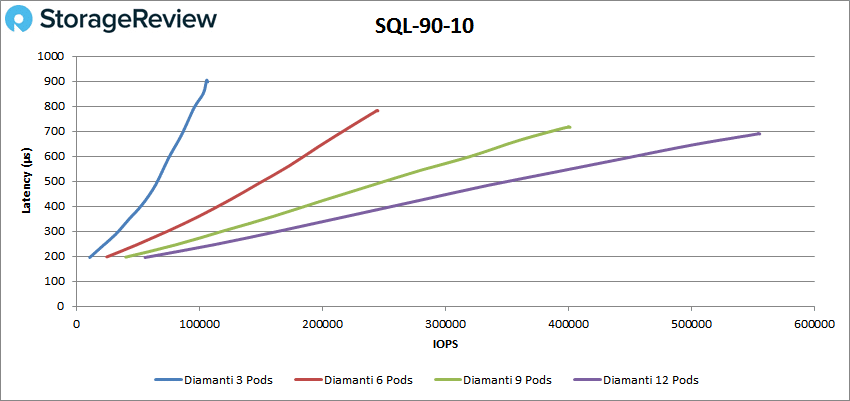
For SQL 90-10, all the deployments started close to the 200μs latency. The 3 pods deployment started at 10,753 IOPS and went on a peak at 105,877 IOPS with a latency of 904μs. The 6 pods stared at 49,361 IOPS and peaked at 245,158 IOPS with a latency of 782μs. The 9 pods started at 80,157 IOPS and peaked at 401,444 IOPS with a latency of 716μs. And the 12 pods deployment started at 55,748 IOPS and went on a peak at 554,685 IOPS with a latency of 690μs.
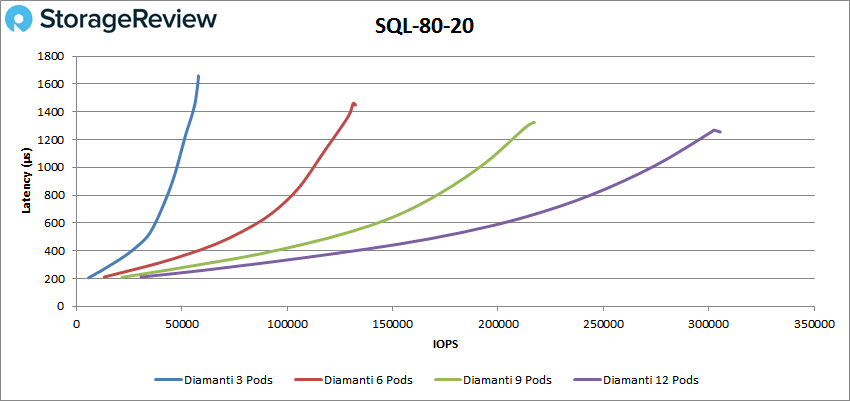
For our last SQL test, the 80-20, we saw the Vdbench deployments also started very near to the 200μs latency. The deployments went on a peak as follows: the 3 pods deployment at 57,944 IOPS with a latency of 1.6ms; the 6 pods peaked at 132,384 IOPS with a latency of 1.4ms; the 9 pods 217,273 IOPS with a latency of 1.3ms; and the 12 pods deployment went on a peak at 305,426 IOPS with a latency of 1.2ms.
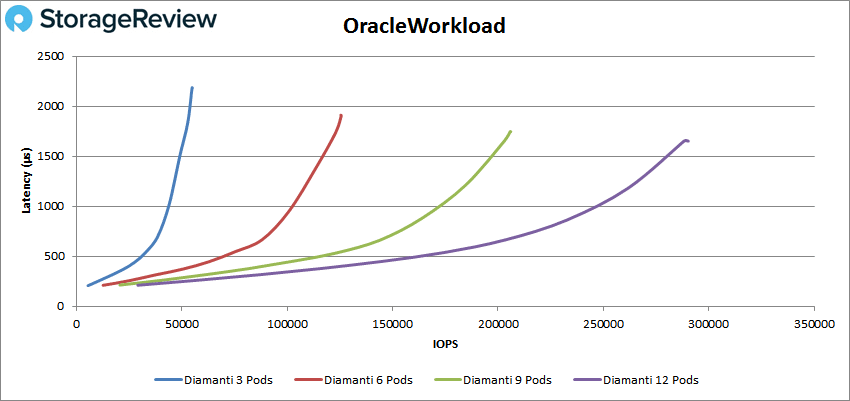
Next up are our Oracle workloads: Oracle, Oracle 90-10, and Oracle 80-20. With Oracle, all the deployments started under 210μs. Here we see the peak performance of the deployments. The 3 pods went on a peak at 54,844 IOPS with a latency of 2.2ms. The 6 pods peaked at 125,633 IOPS with a latency of 1.9ms. The 9 pods peaked at 206,024 IOPS with a latency of 1.7ms. And the 12 pods deployment went on a peak at 290,313 IOPS with a latency of 1.6ms.
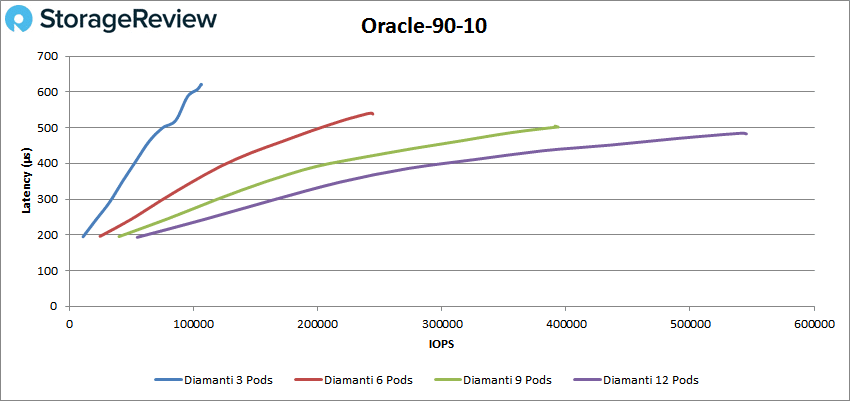
In Oracle 90-10, the deployments started under 200μs. The 3 pods deployment went on a peak at 106,182 IOPS with a latency of 620μs. The 6 pods peaked at 243,383 IOPS with a latency of 541μs. The 9 pods peaked at 393,727 IOPS with a latency of 502μs. And lastly, the 12 pods deployment went on a peak at 544,584 IOPS with a latency of 483μs.
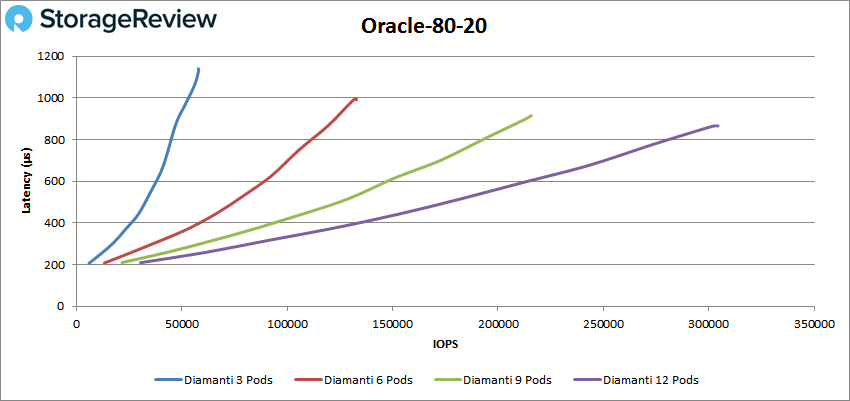
For Oracle 80-20, we saw one more time all the deployments starting at a latency of 210μs. Looking at the peak performance of the deployments, we see the 3 pods peaking at 58,037 IOPS with a latency of 1.1ms; the 6 pods peaking at 132,911 IOPS with a latency of 991μs; the 9 pods peaking at 215,817 IOPS with a latency of 915μs; and finally, the 12 pods deployment went on a peak at 304,391 IOPS with a latency of 865μs.
Conclusion
Kubernetes has seen acceptance by smaller companies and is now maturing into a technology that most, if not all Fortune 500 companies, are looking at and, some of the more forward-thinking ones, are starting to implement. Kubernetes has only been around for 5 years but has passed the innovators tranche on the technology adoption curve and is solidly in the early adopter’s camp. This positioning on the technology adoption curve matters as the Kubernetes community has figured out how to get Kubernetes to run and are now focusing on getting it to run well and we hope that tests such as these will help Kubernetes consumers in deciding what vendors to go with and help the vendors by giving them a standard to compare themselves against.
Diamanti has built a compelling Kubernetes solution with the D10 container appliance, offering an informative and simple to use management interface and a very fast backend storage platform for hosting containers. As this is still an emerging field, there isn’t a lot of fully fleshed out solutions in the market, but from what we’ve seen the D10 is able to hit on all the marks for what we’d traditionally look at from a storage or HCI solution. Performance is generally fantastic, offering well over 2.7 million IOPs 4K random read from our cluster testing 3 to 12 pods. From a latency perspective we started off at just over 100 microseconds, and topped out at 600 microseconds. In storage terms that is incredibly performant, and from an emerging technology platform that is pretty incredible. From a write perspective the appliance offered 50k IOPS 4K random, which seems to be the only weakness, but something the company should be able to address via software or perhaps even storage media. Sequential bandwidth offered reads speeds in excess 11GB/s, again very strong and usable performance, with write speeds coming in at 2.4GB/s at the peak.
Overall for customers deploying Kubernetes in their environment, the Diamanti D10 container appliance offers a great turn-key approach from the hosting and storage perspective for those looking to take a serious look at the fast and loose container market. To be fair, this isn’t for everyone, the cluster is pretty specific in its targeting. But if you fit that target Diamanti offers exactly what those customers want, it’s purpose-built for these types of emerging container workloads. While it’s entirely possible of course to leverage PKS for VMware or alternate solutions that are more enterprise focused, Diamanti offers a system that’s low on complexity and should have cost advantage over traditional enterprise stacks. Because of the completeness of the solution (it has a good GUI for a change) and the very good performance profile, we’ve determined the D10 to be a worthy winner of the StorageReview Editor’s Choice Award.


 Amazon