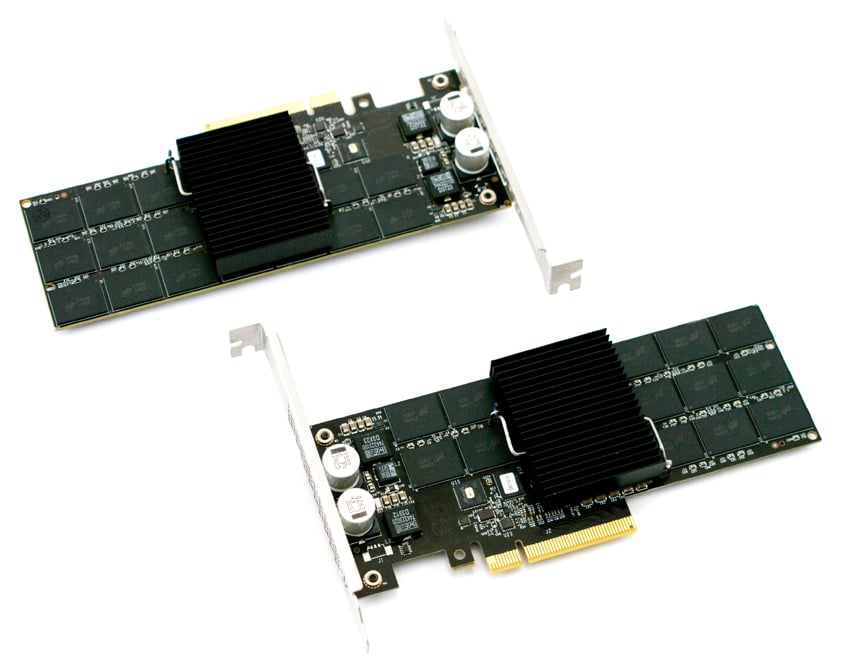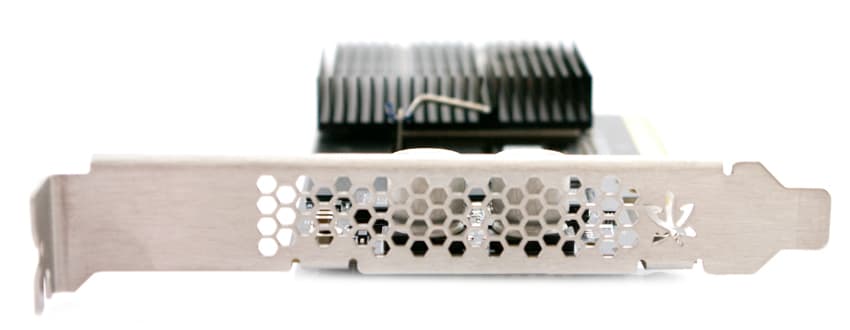
The Fusion ioMemory PX600 is a third-generation PCIe application accelerator with an emphasis on endurance and price-to-performance. The PX600 and its value-oriented SX300 sibling comprise Fusion's new "Atomic Series" which is essentially one hardware platform with two different NAND overprovisioning schemes that result in different performance and endurance profiles for the two drives. Therefore we will be publishing reviews of the two drives in tandem.
The Atomic Series takes a simplified approach to in-host flash; although previous generations of Fusion's application accelerators have been offered in a variety of MLC and SLC NAND flavors as well as single or multiple controllers, these offerings streamline the decision-making process with two branches that are MLC-only and each leverage a single controller. In other words, because the PX600 and SX300 are using the same controller platform and the same raw NAND, provisioning the same amount of raw storage in the same way would yield similar or identical performances between the two drives.
The Fusion ioMemory PX600 is the new workhorse, aimed at providing the highest transaction rate for high performance applications that lean toward mixed read/write workloads. The PX600 comes in 1TB, 1.3TB and 2.6TB capacities in HHHL form factors and a 5.2TB option in a FHHL form factor, all interfacing over PCIe 2.0 x8.
Though the overall product lineup has been simplified, the core Fusion architecture has not. Both designs feature a programmable FPGA, offering greater long-term flexibility and update support compared to an ASIC design. While all the drives in the new Atomic family use MLC, Fusion-io has migrated to a smaller 20nm lithography this time. However, smaller NAND die is a double-edged sword; the shrink allows for capacity gains (up to 5.2TB in the PX600), but it also presents new engineering challenges.
The PX600 can take advantage of Fusion's proprietary technologies including Adaptive Flashback, which increases NAND die failure tolerances by keeping the drive online and its data secure in the event of multiple NAND failures. In such an event, the ioMemory PX600 can remap and recover without going offline. The drive integrates with the host OS via Fusion-io's VSL (virtual storage layer) software, providing native access to data stored on the PX600.
The Fusion-io ioMemory PX600 comes with a five-year warranty up to the maximum endurace used for each card. Our review unit is the 2.6TB capacity card.
Fusion ioMemroy PX600 Specifications
- Capacity
- 1TB (PX600-1000)
- Read Bandwidth: 2.7GB/s
- Write Bandwidth: 1.5GB/s
- Random Read IOPS 4K: 196,000
- Random Write IOPS 4K: 320,000
- Read Access Latency: 92µs
- Write Access latency: 15µs
- Endurance: 12PBW
- 1.3TB (PX600-1300)
- 2.6TB (PX600-2600)
- 5.2TB (PX600-5200)
- 1TB (PX600-1000)
- 20nm MLC NAND
- PCIe 2.0 x8 Interface
- Weight: 5.2Oz (5.2TB 7.25Oz)
- Warranty: 5 years (or Max Endurance Used)
- Power Requirements: 25W
- Temperature
- Operational: 0°C – 55°C
- Non-operational: -40°C – 70°C
- Air Flow: 300 (LFM)2
- Humidity: Non-condensing 5 – 95%
- Altitude
- Operational: -1,000ft to 10,000ft
- Non-operational: -1,000ft to 30,000ft
- Operating Systems
- Microsoft: Windows Server 2012 R2, 2012, 2008 R2 SP1
- Linux: RHEL 5/6, SLES 11, OEL 5/6, CentOS 5/6, Debian Squeeze, Ubuntu 12/13
- Unix: Solaris 11.1/11 x64, Solaris 10 U11 x64
- Hypervisors: VMware ESXi 5.0/5.1/5.5, Windows Server 2012 Hyper-V, 2012 R2 Hyper-V
Design and Build
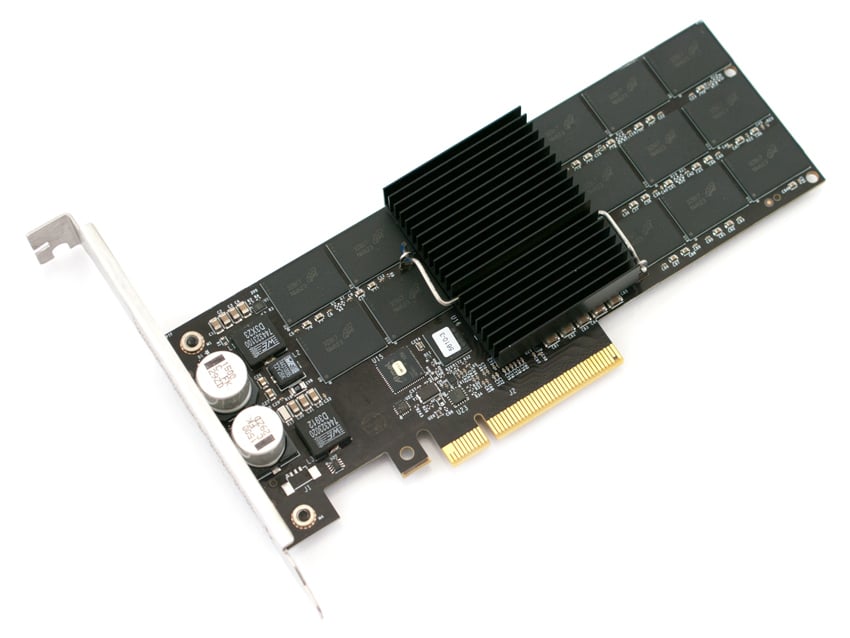
The Fusion-io Atomic Series PX600 is a single-controller PCIe Application Accelerator that comes in HHHL and FHHL form-factors. For 1-2.6TB versions, the card has the smaller HHHL form-factor, which provides a near universal fit in servers on the market. The larger capacity 5.2TB model (FHHL) needs a larger height for the additional NAND, although it still fits in most servers on the market, just not all slots.
The new Atomic Series PX600 cards are similar to the previous Application Accelerators from Fusion-io leveraging a FPGA controller, which is able to leverage host resources. Fusion-io claims that this offers lower latency performance being closer to the CPU. One small difference compared to the ioDrive2-series is that none of the newest models use two controllers (which were found in the Duo SLC and MLC products before). This helps save on power consumption, not to mention that it presents the user with a single pool of storage, versus two that they would need to stripe together.
Fusion-io has also done away with any external power connectivity on the PX600 cards, which was seen on the first- and second-generation models. The reason for this is that older models could draw more power in higher performance modes, and some servers couldn't function safely above minimum PCIe power spec. However, the current crop of servers on the market support much higher power demands, so Fusion-io included the ability to enable higher power modes through the slot itself.
Testing Background and Comparables
The Fusion-io ioMemory PX600 a single FPGA controller and Intel MLC NAND with a PCIe 2.0 x8 interface.
Comparables for this review:
- Fusion-io SX300 (3.2TB, 1x FPGA controller, MLC NAND, PCIe 2.0 x8)
- Fusion-io ioDrive2 (1.2TB, 1x FPGA controller, MLC NAND, PCIe 2.0 x4)
- Fusion-io ioDrive2 Duo (2.4TB, 2x FPGA controllers, MLC NAND, PCle 2.0 x8)
- Fusion-io ioDrive2 Duo (1.2TB, 2x FPGA controllers, SLC NAND, PCle 2.0 x8)
- Fusion-io ioScale (3.2TB, 1x FPGA controller, MLC NAND, PCIe 2.0 x4)
- Huawei Tecal ES3000 (2.4TB, 3x FPGA controllers, MLC NAND, PCIe 2.0 x8)
- Intel SSD 910 (800GB, 4x Intel EW29AA31AA1 controllers, MLC NAND, PCIe 2.0 x8)
- LSI Nytro WarpDrive (800GB, 4x LSI SandForce SF-2500 controllers, MLC NAND, PCle 2.0 x8)
- Memblaze PBlaze3H (2.4TB, 2x FPGA controllers, MLC NAND, PCIe 2.1 x8)
- Memblaze PBlaze3L (1.2TB, 1x FPGA controller, MLC NAND, PCIe 2.1 x8)
- Micron P320h (700GB, 1x IDT controller, SLC NAND, PCIe 2.0 x8)
- Micron P420m (1.6TB, 1x IDT controller, MLC NAND, PCIe 2.0 x8)
- OCZ ZD-XL Flash (1.6TB, 8x LSI SandForce SF-2500 controllers, MLC NAND, PCle 2.0 x8)
- Virident FlashMAX II (2.2TB, 2x FPGA controllers, MLC NAND, PCIe 2.0 x8)
All PCIe Application Accelerators are benchmarked on our second-generation enterprise testing platform based on a Lenovo ThinkServer RD630. For synthetic benchmarks, we utilize FIO version 2.0.10 for Linux and version 2.0.12.2 for Windows. In our synthetic testing environment, we use a mainstream server configuration with a clock speed of 2.0GHz, although server configurations with more powerful processors could yield even greater performance.
- 2x Intel Xeon E5-2620 (2.0GHz, 15MB Cache, 6-cores)
- Intel C602 Chipset
- Memory – 16GB (2x 8GB) 1333Mhz DDR3 Registered RDIMMs
- Windows Server 2008 R2 SP1 64-bit or CentOS 6.3 64-bit
- 100GB Micron P400e Boot SSD
- LSI 9211-4i SAS/SATA 6.0GB/s HBA (For boot SSDs)
- LSI 9207-8i SAS/SATA 6.0GB/s HBA (For benchmarking SSDs or HDDs)
Application Performance Analysis
In order to understand the performance characteristics of enterprise storage devices, it is essential to model the infrastructure and the application workloads found in live production environments. Our first three benchmarks of the ioMemory SX300 are therefore the MarkLogic NoSQL Database Storage Benchmark, MySQL OLTP performance via SysBench and Microsoft SQL Server OLTP performance with a simulated TCP-C workload.
Our MarkLogic NoSQL Database environment requires groups of four SSDs with a usable capacity of at least 200GB, since the NoSQL database requires roughly 650GB of space for its four database nodes. Our protocol uses an SCST host and presents each SSD in JBOD, with one allocated per database node. The test repeats itself over 24 intervals, requiring 30-36h total. MarkLogic records total average latency as well as interval latency for each SSD.
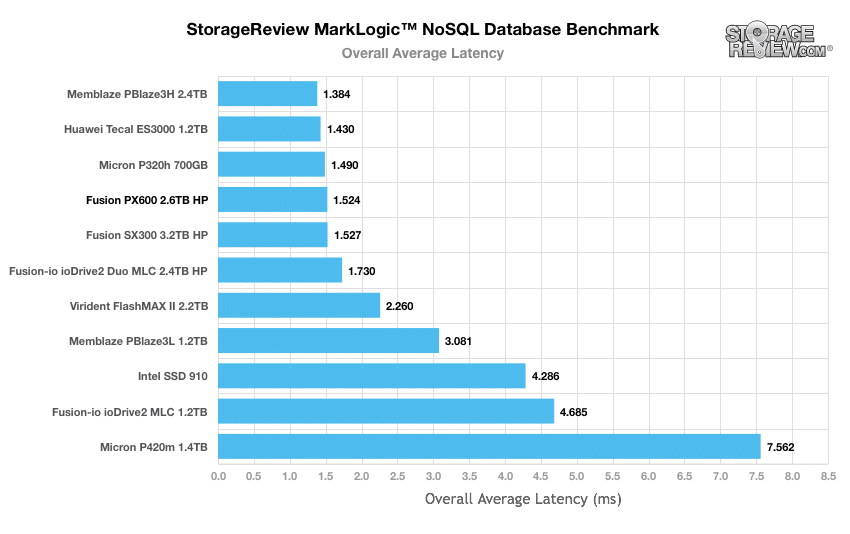
The ioMemory PX600 scored an average latency of 1.527ms when overprovisioned for best performance during the NoSQL benchmark. Results were very similar when compared to the SX300, with both drives boasting numbers among the best accelerators in this large dataset.
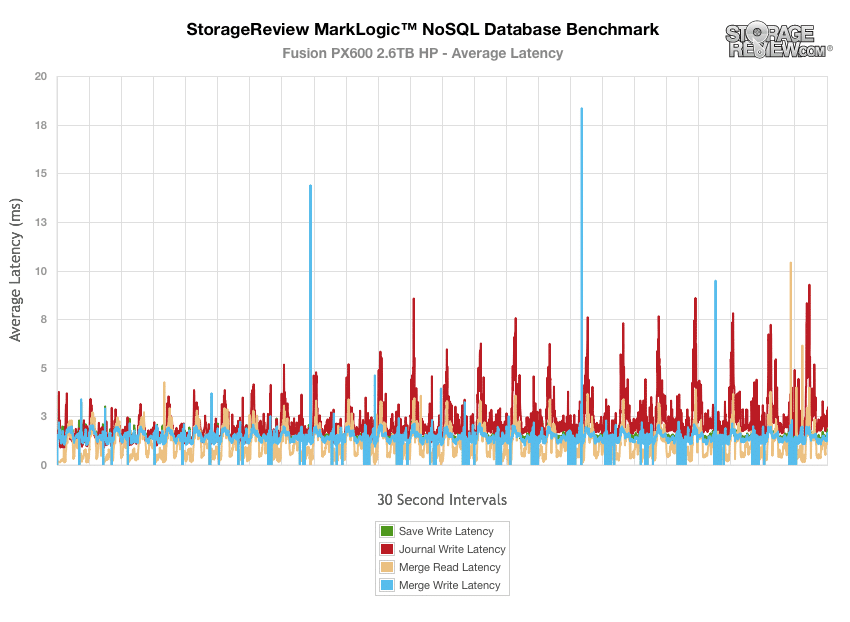
During the NoSQL benchmark, the PX600's maintained very low latency transactions, with only a handful of spikes over 10ms.
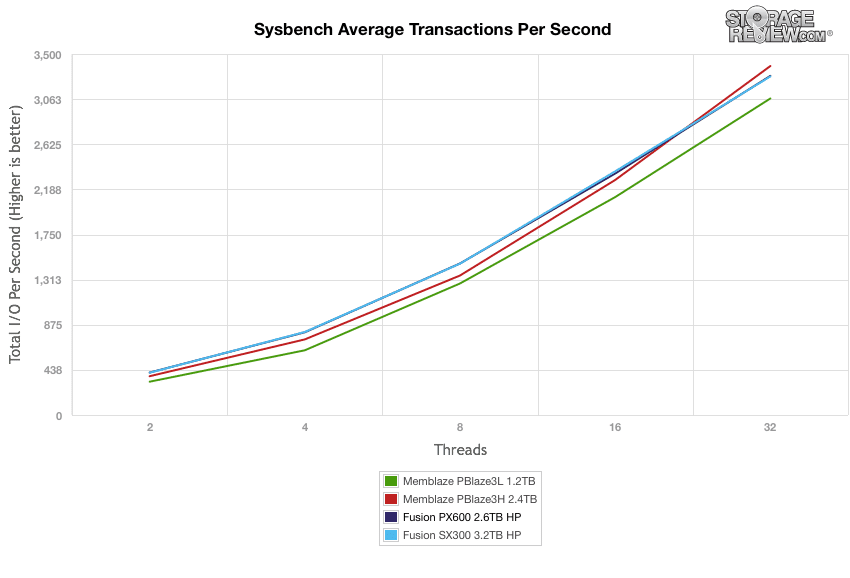
Our Percona MySQL database test via SysBench measures the performance of OLTP activity. In this testing configuration, we use a group of Lenovo ThinkServer RD630s and load a database environment onto a single SATA, SAS or PCIe drive. This test measures average TPS (Transactions Per Second), average latency, as well as average 99th percentile latency over a range of 2 to 32 threads. Percona and MariaDB can make use of Fusion-io flash-aware application acceleration APIs in recent releases of their databases, although for the purposes of comparison we test each device in a "legacy" block-storage mode. The Fusion-io PX600 came in right at the top with the SX300, with the ioDrive2's average TPS scaling from around 435TPS at 2 threads to over 3,250TPS at 32 threads.
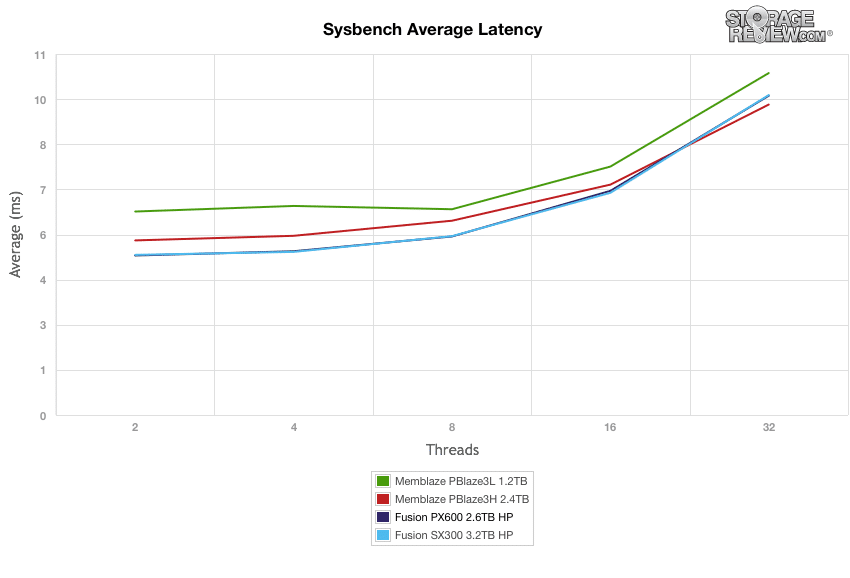
Average latency from the Fusion-io PX600 in SysBench told a similar story, which scaled from just over 5ms at 2 threads to roughly 10ms at 32 threads.
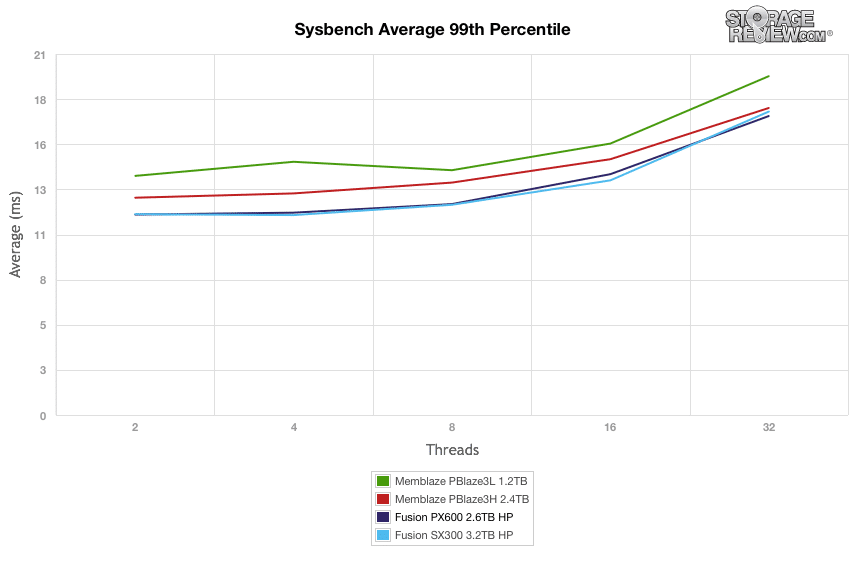
When comparing the 99th percentile latency in our SysBench test, the Fusion-io PX600 once again beat out the competition (along with its SX300 brethren, which scored slightly better), staying just under 18ms at 32 threads.
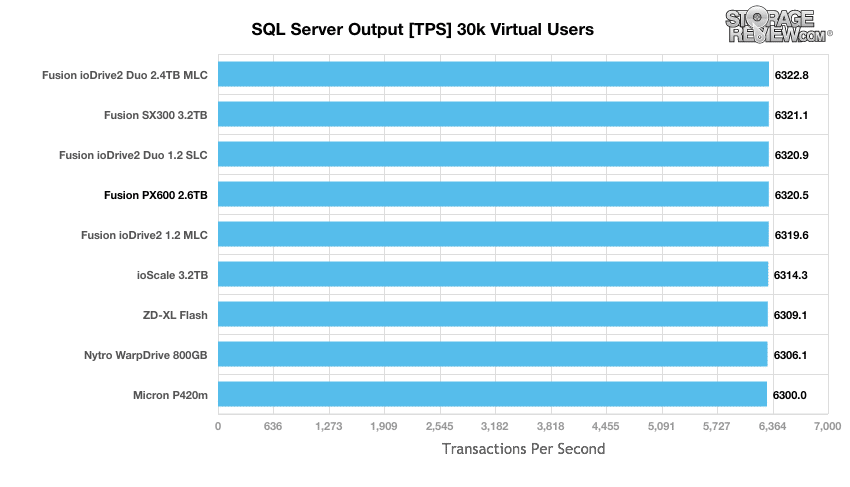
StorageReview’s Microsoft SQL Server OLTP testing protocol employs the current draft of the Transaction Processing Performance Council’s Benchmark C (TPC-C), an online transaction processing benchmark that simulates the activities found in complex application environments. The TPC-C benchmark comes closer than synthetic performance benchmarks to gauging the performance strengths and bottlenecks of storage infrastructure in database environments. Our SQL Server protocol uses a 685GB (3,000 scale) SQL Server database and measures the transactional performance and latency under a load of 30,000 virtual users.
The PX600 was able to keep pace with the rest of the pack with 6320.5TPS, but the ioDrive2 Duo MLC remained the top performer with 6322.8TPS.
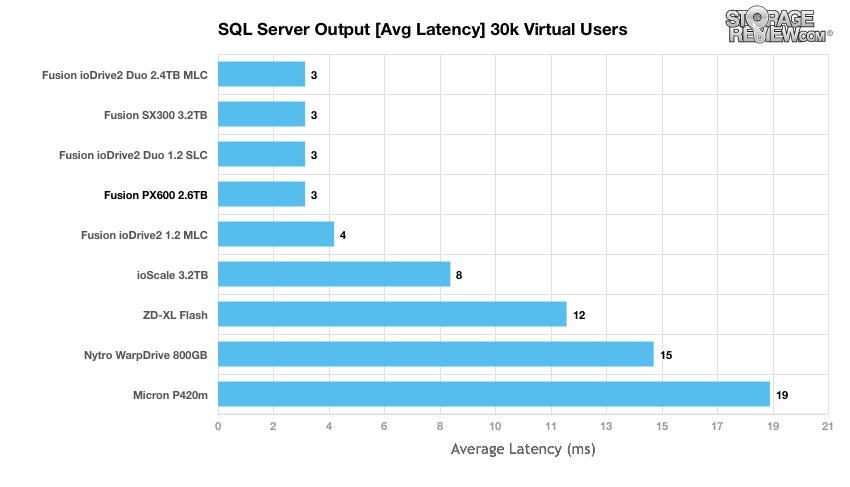
For our overall average latency ranking in our MarkLogic NoSQL database benchmark, the Fusion PX600 boasted great performance with a response time of 3.0ms, which was tied with the performance of the other Fusion-io solutions.
Enterprise Synthetic Workload Analysis
Flash performance varies throughout the preconditioning phase of each storage device. Our synthetic enterprise storage benchmark process begins with an analysis of the way the drive performs during a thorough preconditioning phase. Each of the comparable drives are secure erased using the vendor's tools, preconditioned into steady-state with the same workload the device will be tested with under a heavy load of 16 threads with an outstanding queue of 16 per thread, and then tested in set intervals in multiple thread/queue depth profiles to show performance under light and heavy usage.
- Preconditioning and Primary Steady-State Tests:
- Throughput (Read+Write IOPS Aggregate)
- Average Latency (Read+Write Latency Averaged Together)
- Max Latency (Peak Read or Write Latency)
- Latency Standard Deviation (Read+Write Standard Deviation Averaged Together)
Our Enterprise Synthetic Workload Analysis includes two profiles based on real-world tasks. These profiles have been developed to make it easier to compare to our past benchmarks as well as widely-published values such as max 4k read and write speed and 8k 70/30, which is commonly used for enterprise hardware.
- 4k
- 100% Read or 100% Write
- 100% 4k
- 8k 70/30
- 70% Read, 30% Write
- 100% 8k
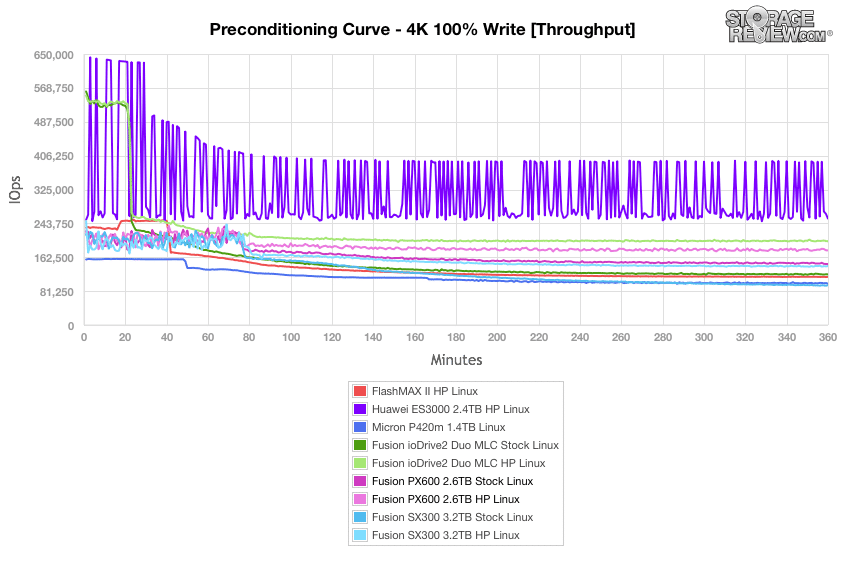
Our first test measures 100% 4k random write performance with a load of 16T/16Q. In this scenario, the Fusion-io PX600 was the slowest recorded solution in Stock Linux whereas the HP Linux environment showed a bit of improvement and surpassed the ioDrive2 MLC Stock Linux.
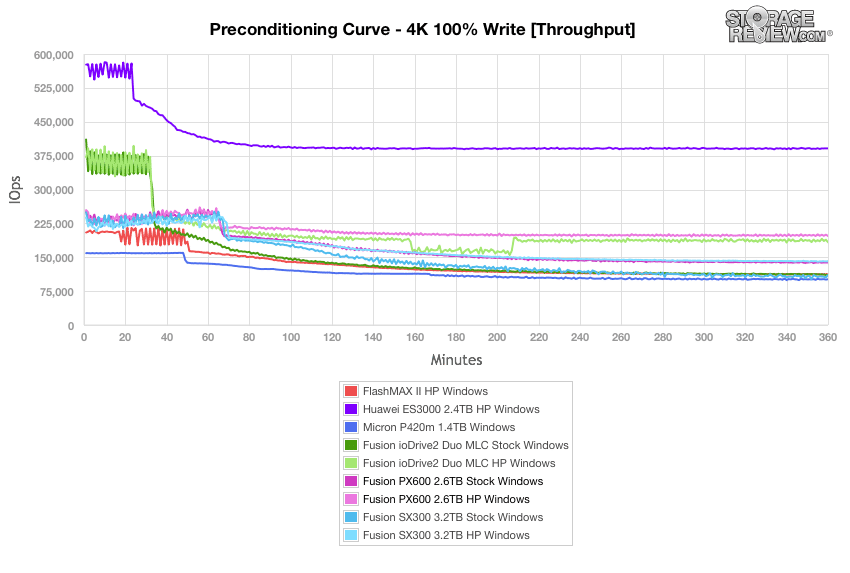
When using Windows in the same setting, results were fairly similar when the dust settled, with the PX600 in HP Windows taking the fourth spot. The ioDrive2 in HP Windows was again the best Fusion-io solution.
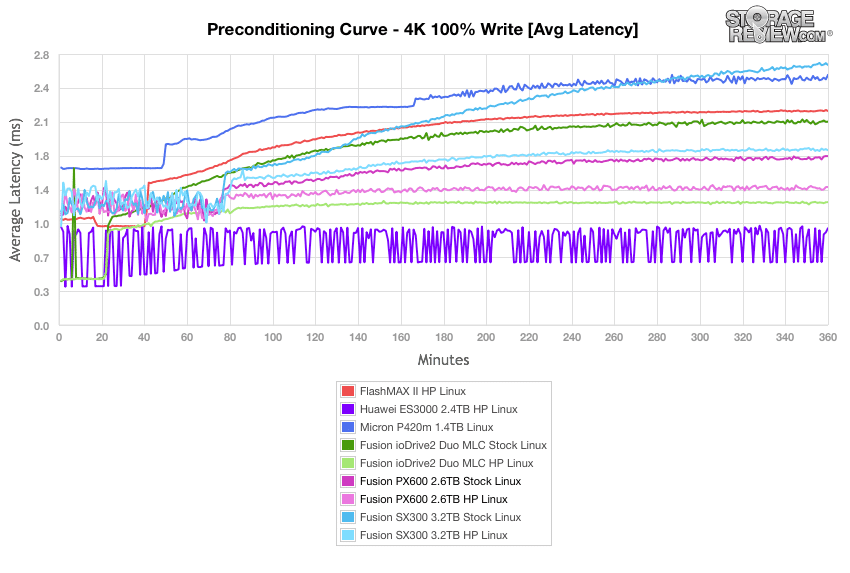
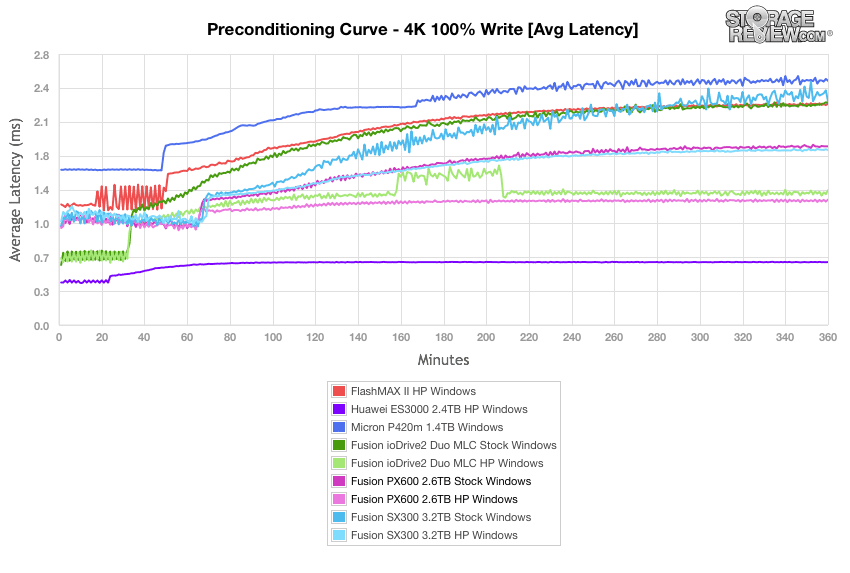
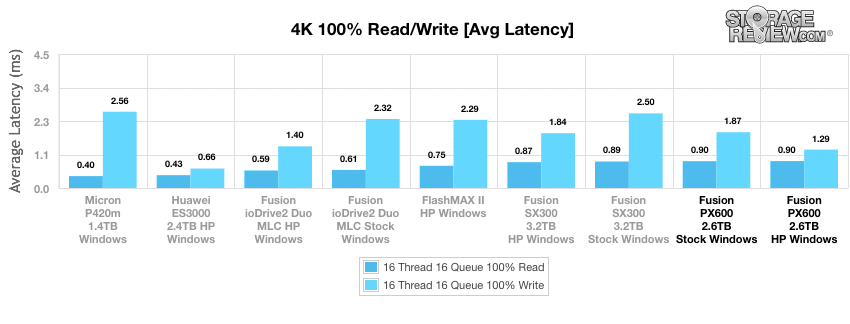
In our overall latency tests with a heavy 16T/16Q load, the Fusion-io PX600 showed the highest average latency. In HP Linux, performance was much better, boasting results around 1.8ms by the end. Huawei ES3000 showed the lowest average latency, although it was the least stable of the leaderboard.
In a Windows scenario of the same benchmark, the PX600 using HP Windows took third place, beating out the ioDrive2 Duo in Stock Windows. Additionally, the Huawei ES3000 went from being the least unstable (in Linux) to the most stable (in Windows).
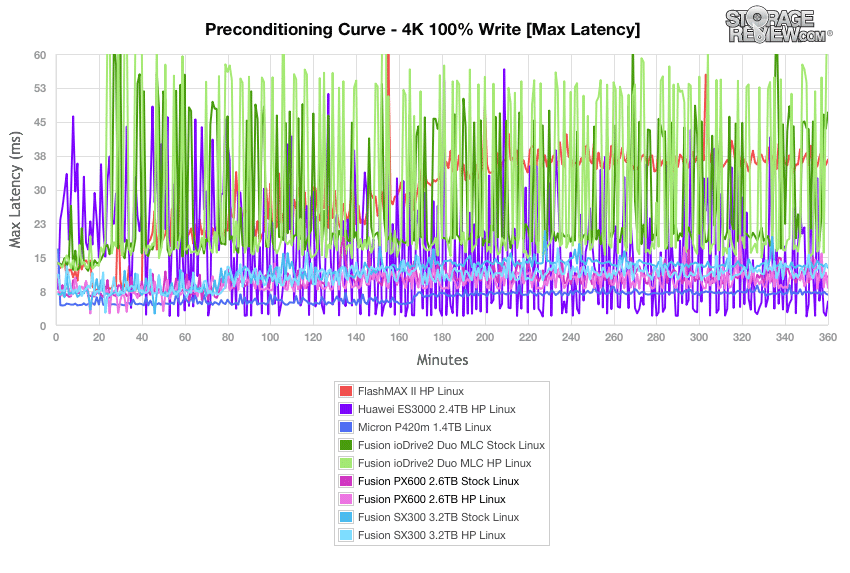
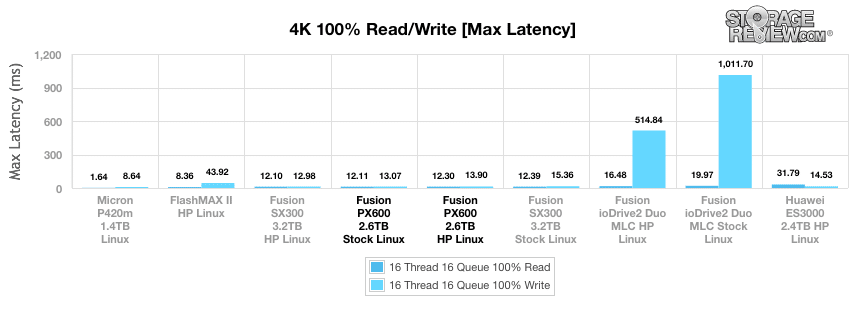
The PX600 had very similar max response times in both Stock and HP Linux environments. Additionally, it was by far one of the most stable solutions on the leaderboard, particularly compared to their last gen Fusion-io brethren, which had huge spikes throughout.
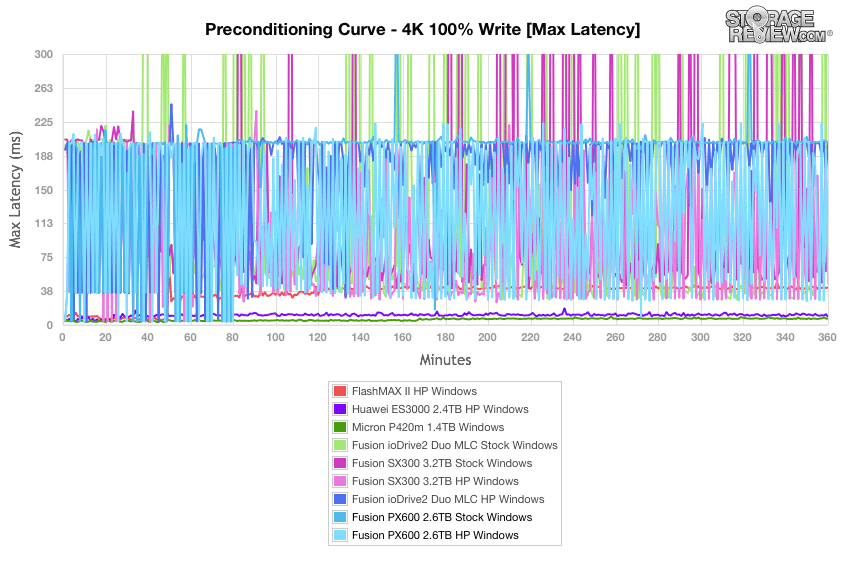
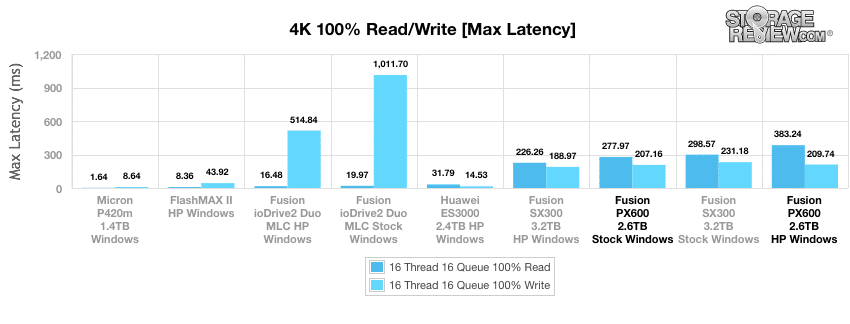
In a Windows environment of the same benchmark, the PX600 showed a lot more inconsistency in both Stock and HP configurations, though its was still much better than the prior-generation Fusion-io solutions.
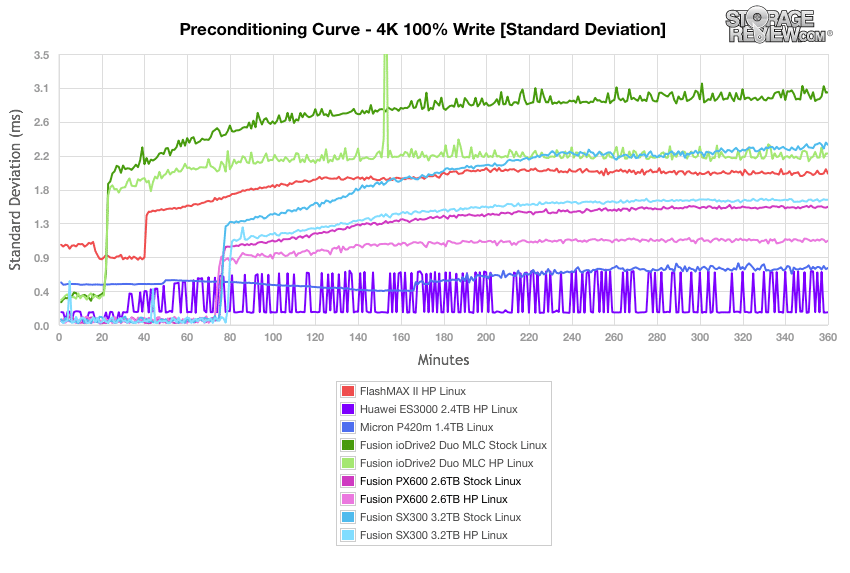
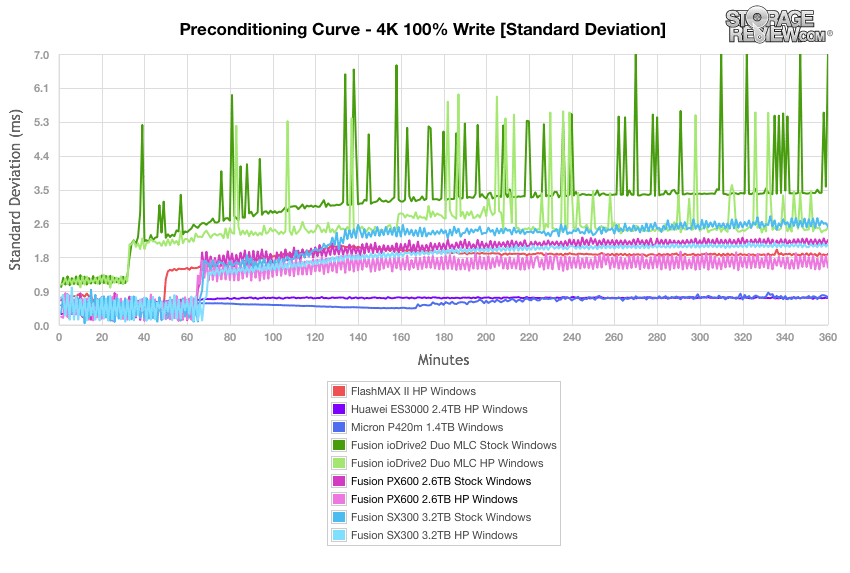
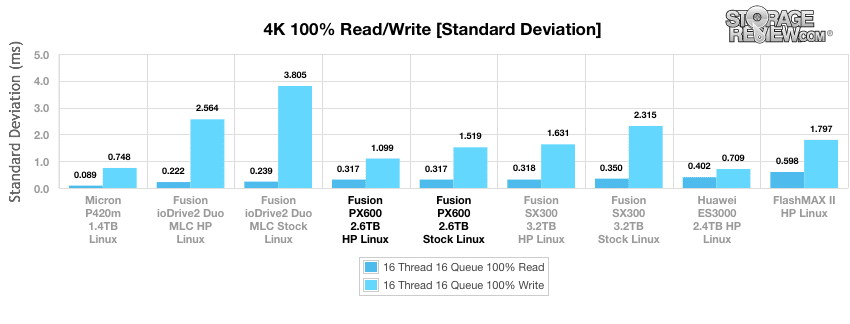
Moving to our standard deviation benchmark, which takes a closer look at latency consistency in our 4k random write workload, our HP Linux configuration showed the best results for the PX600. Although both stock and HP configurations showed significant spikes at the 80-minute mark, they stabilized for the rest of the test.
The Windows environment tests told a similar story, with the PX600 results showing much more consistent behavior than the ioDrive2 solution.
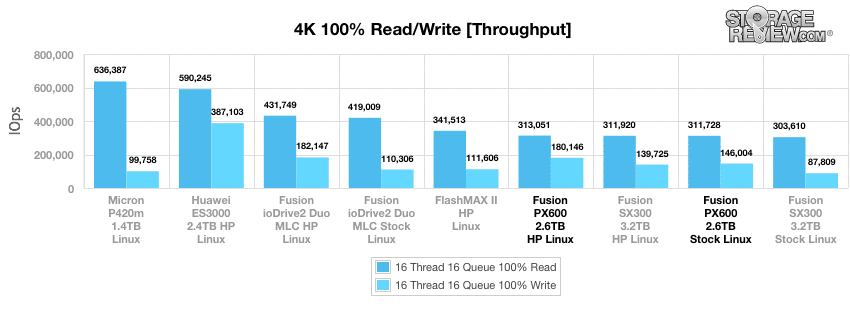
After 12h of preconditioning, the Fusion-io PX600 offered good 4k random read performances of 313,051IOPS and 311,728IOPS (HP and Stock, respectively), with write speed of 180,146IOPS and 146,004IOPS (HP and Stock, respectively). The Micron P420m boasted the best read throughput.
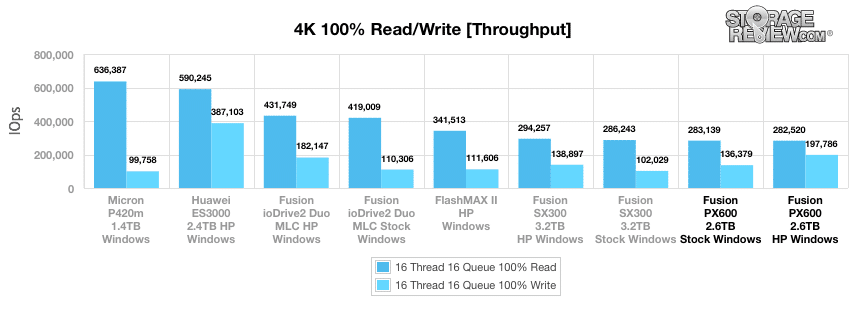
In a Windows environment, the PX600 slowed down a bit, showing Stock read and write throughputs of 283,139IOPS and 136,379IOPS, respectively. In HP, it posted a read performance of 292,520IOPS and a write performance of 283,139IOPS. These numbers were lower than the ioDrive2 Duo.
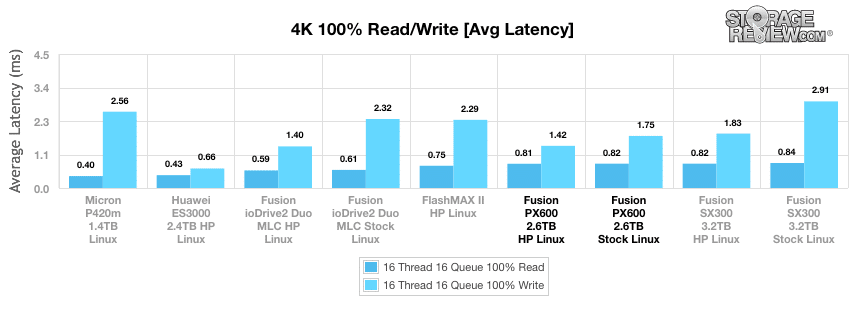
Moving on to overall latency in a Linux environment, the PX600 HP showed decent average latency in read functions (0.81ms), though it was one of the better solutions in the write column (1.75ms). In Stock Linux, the PX600 showed slightly higher latency with 0.82ms read and 1.75ms write.
When using Windows to test average latency, results showed 0.9ms read and 1.29ms write in HP and 0.9ms read and 1.87ms write for HP.
The PX600 Stock Linux posted an impressive max latency of just 12.11ms read and 13.07ms write, while showing 12.30ms read and 13.90ms write in HP Linux. These results were quite a bit better than the last gen ioDrive2 Duo (particularly in write).
When tested in Windows, results were much higher with 277.97ms read and 207.16ms write (Stock) and 383.24ms read and 209.74ms write (HP).
When looking at its standard deviation in Linux, the PX600 posted 0.317ms read and 1.099ms write (HP) and 0.317ms read and 1.631ms write (Stock). This was good enough to place it in the middle of the pack, but it was still behind the ioDrive2 Duo.
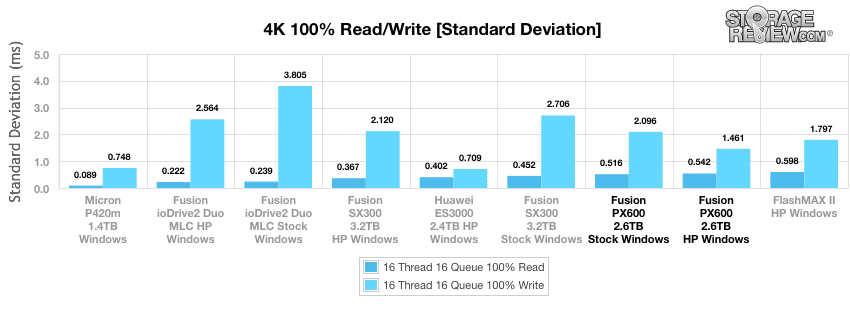
In a Windows environment, we recorded standard deviation from the PX600 with 0.516ms read and 2.096ms write (Stock) and 0.542ms read and 1.461ms write (HP), placing it near the bottom of the pack and behind the ioDrive2 Duo in the read column.
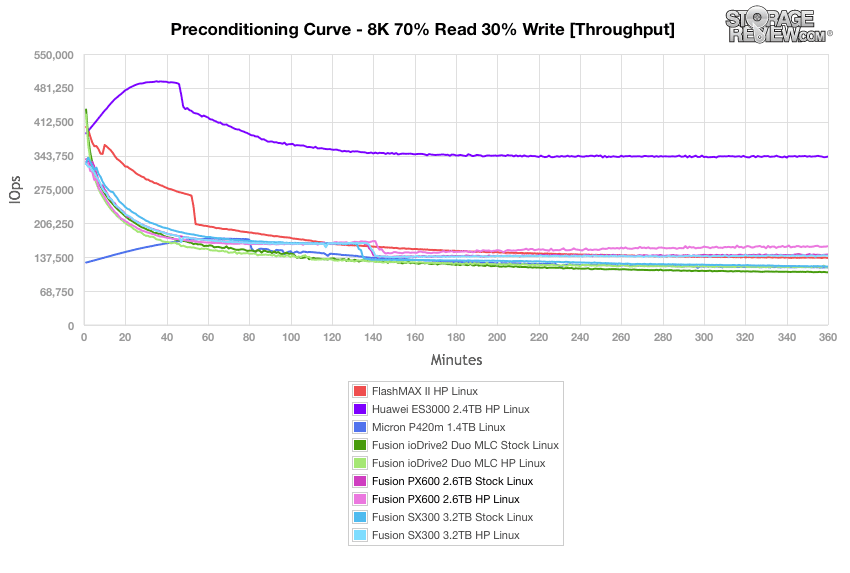
In our next workload, we look at an 8k profile with a 70/30 read/write mixed ratio. In this scenario, the Fusion-io PX600 (Stock) started off with a 340,000+IOPS burst, which slowed to a speed of around 137,000IOPS. The HP Linux performances virtually mirrored the Stock throughout for the majority of the benchmark but ended up with a higher throughput at the end. Both Stock and HP Linux readings were better than the ioDrive2 Duo readings.
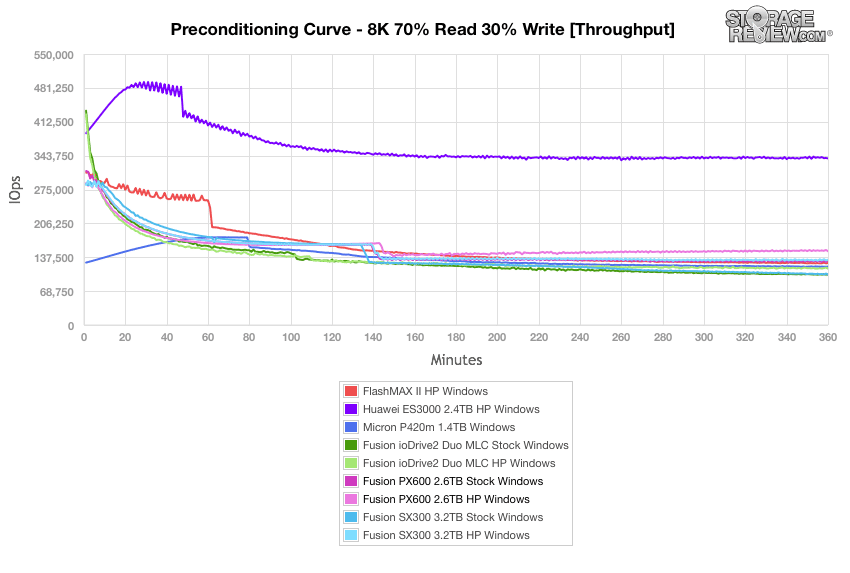
In a Windows environment of the same test, results were virtually identical (though slightly slower), with the Huawei ES3000 taking the top spot again.
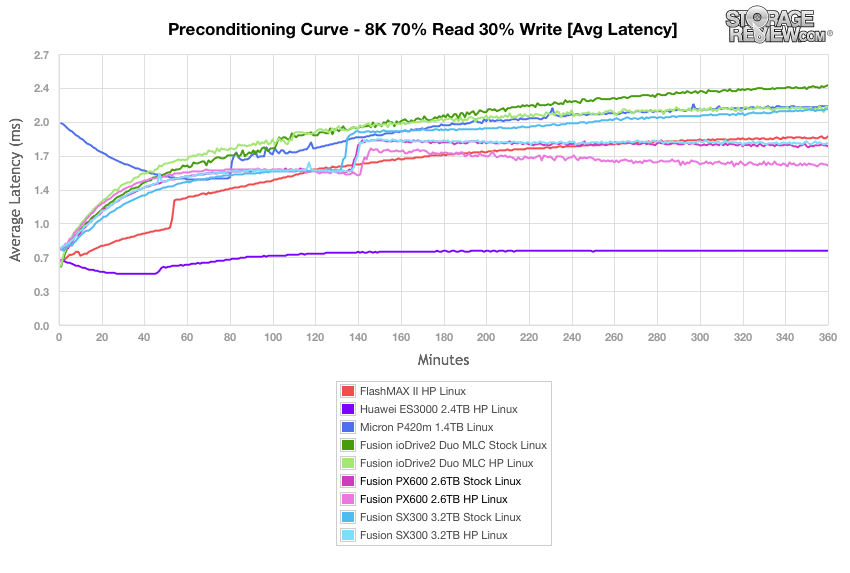
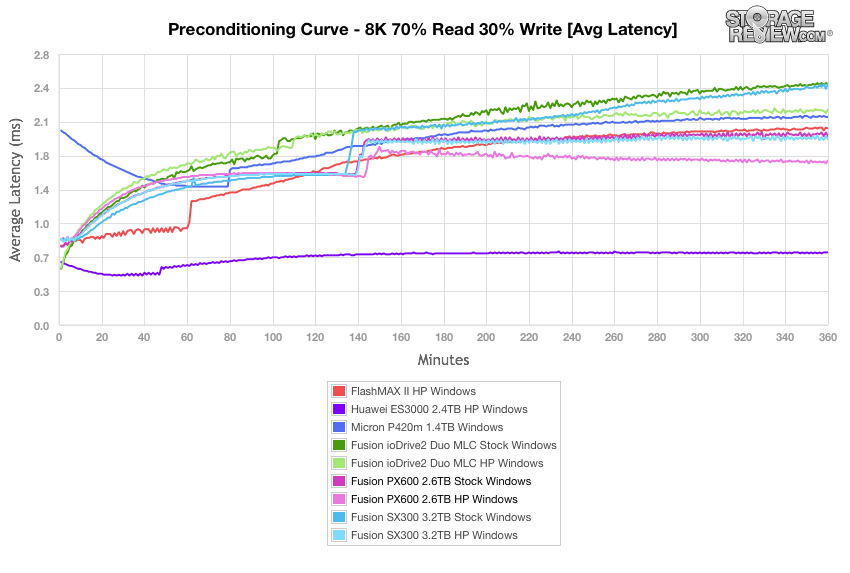
Average latency of the Fusion-io PX600 in both modes measured below 1.0ms at the beginning of our 8K 70/30 preconditioning test and both hovered around 1.7ms at their peak. The ioDrive2 Duo (Stock Linux) had the highest overall latency.
Overall latency results were fairly similar in a Windows environment, with the PX600 HP taking second place at just under 1.8ms by the end of our tests. The ioDrive2 Duo in Stock was the slowest card here.
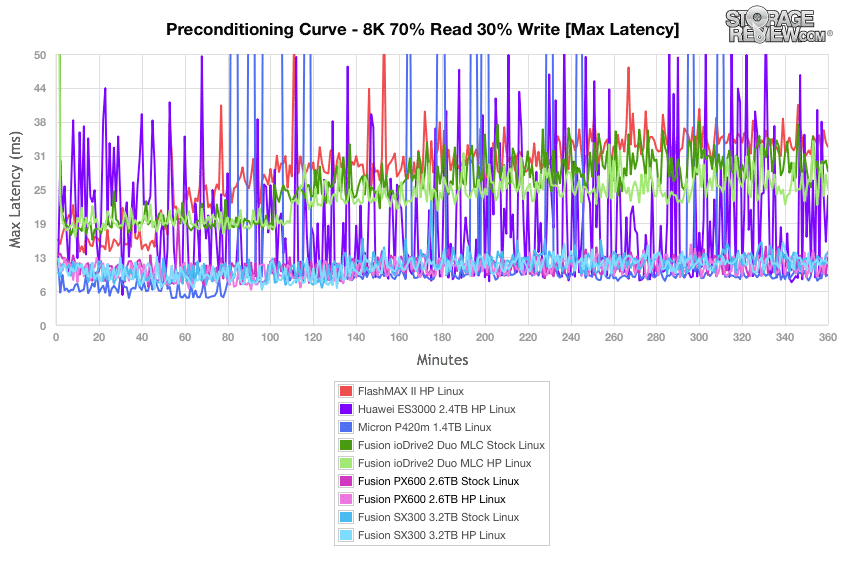
Over the duration of our 8k 70/30 test, the Micron P420m Linux offered the best peak response times. Again, the PX600 drive (both Stock and HP) showed very good peak latency performance, whereas the ioDrive2 Duo posted fairly high peaks throughout.
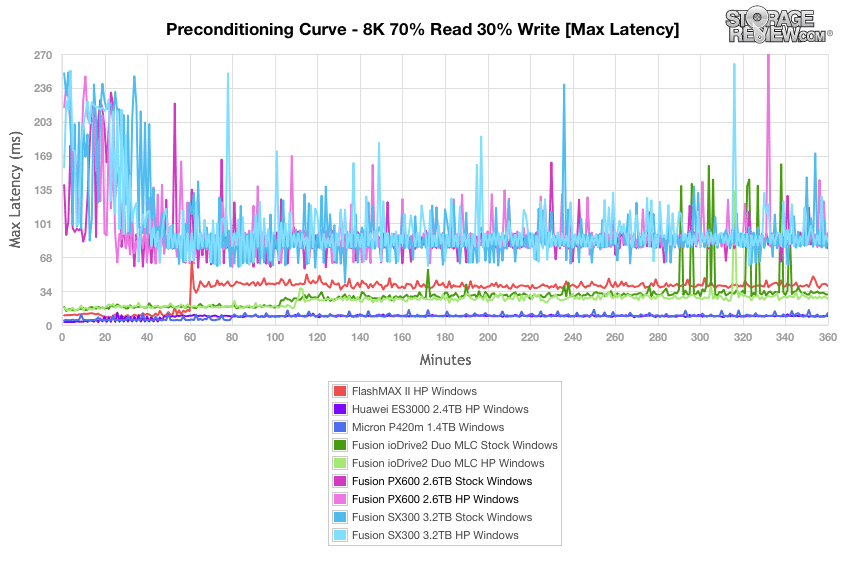
However, in our Windows environment the PX600 solution showed the highest peak latency, whereas the ioDrive2 Duo showed one of the more consistent results, save for several spikes at the end.
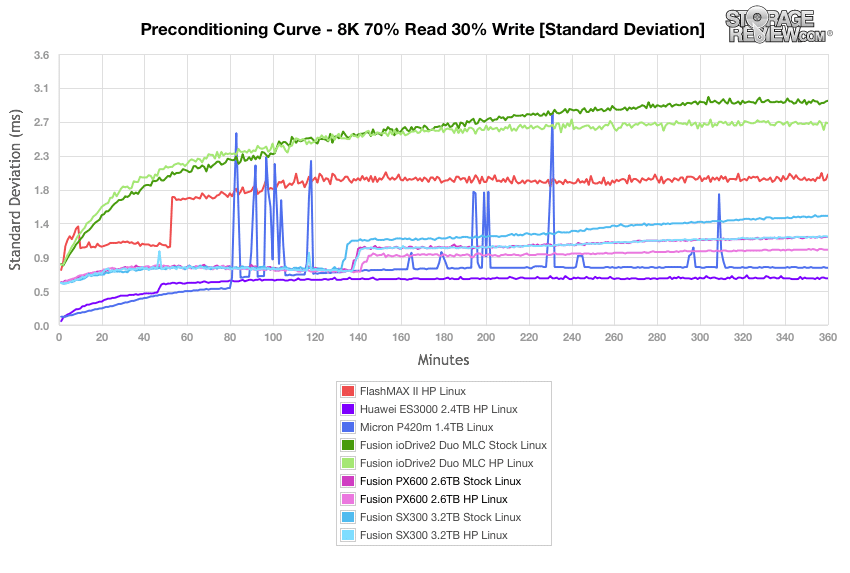
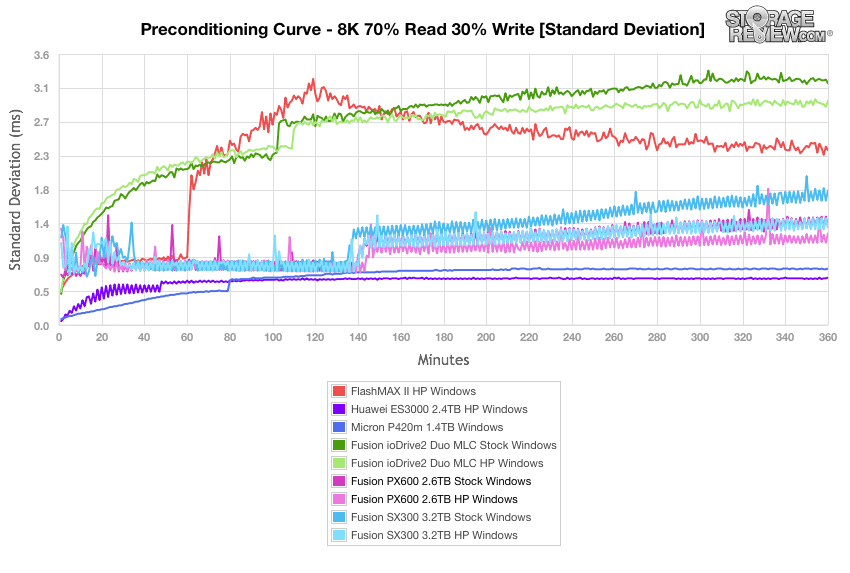
The Fusion-io PX600 HP/Stock Linux had better latency consistency than the prior-generation model throughout (with no major spikes), hovering around the 1.0ms at the end of our tests.
In a Windows environment, the PX600 configurations again posted good numbers, whereas the ioDrive2 Duo had inconsistent latency throughout.
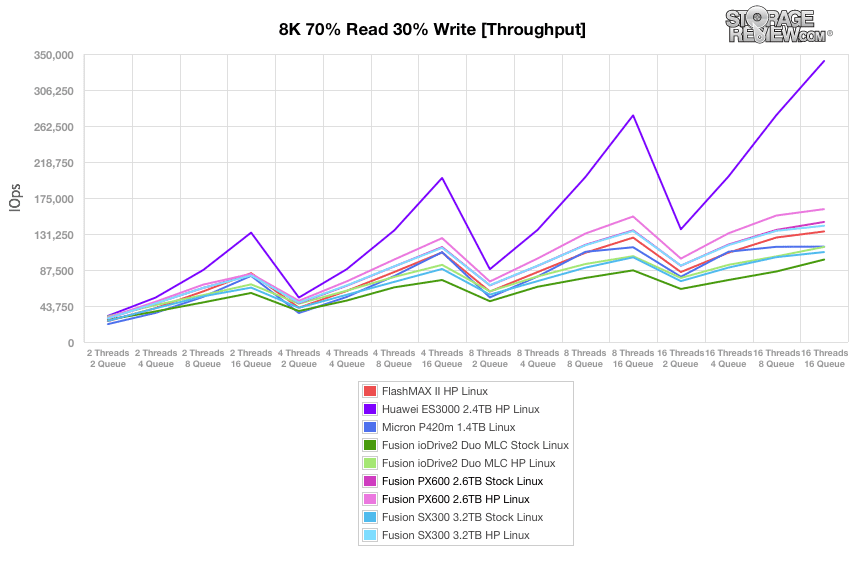
Compared to the fixed 16 thread, 16 queue max workload we performed in the 100% 4k write test, our mixed workload profiles scale the performance across a wide range of thread/queue combinations. In these tests, we span workload intensity from 2 threads and 2 queue up to 16 threads and 16 queue. In the expanded 8k 70/30 test, the Fusion-io PX600 HP Linux boasted great numbers, peaking at the top of the leaderboard around 170,000IOPS with the stock very close behind (though still well behind the impressive Huawei ES3000). The ioDrive2 performed near the bottom of the pack.
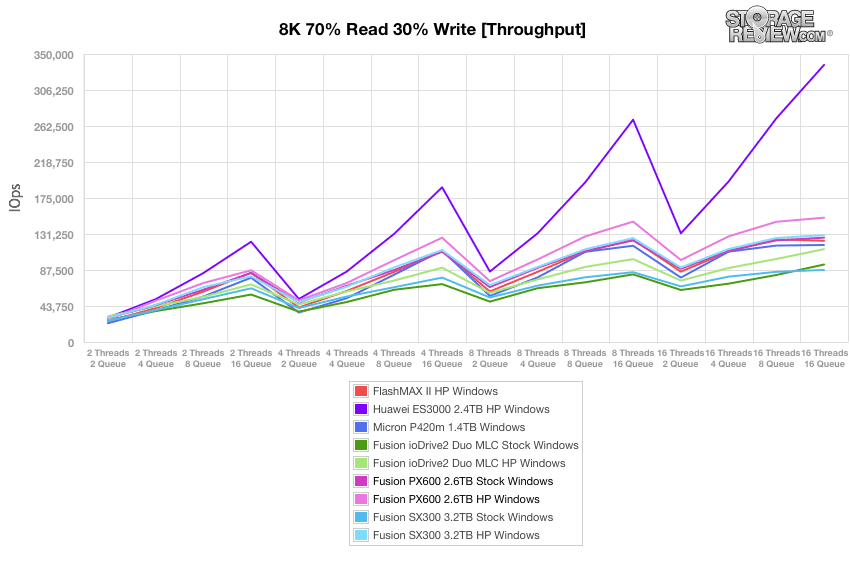
Our Windows environment told a similar story with the Fusion-io PX600 (HP) taking second place among the comparables.
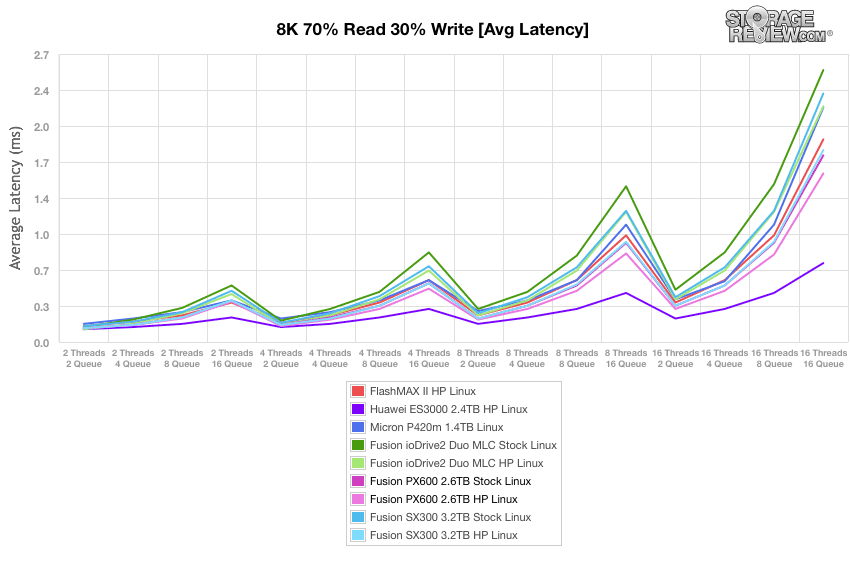
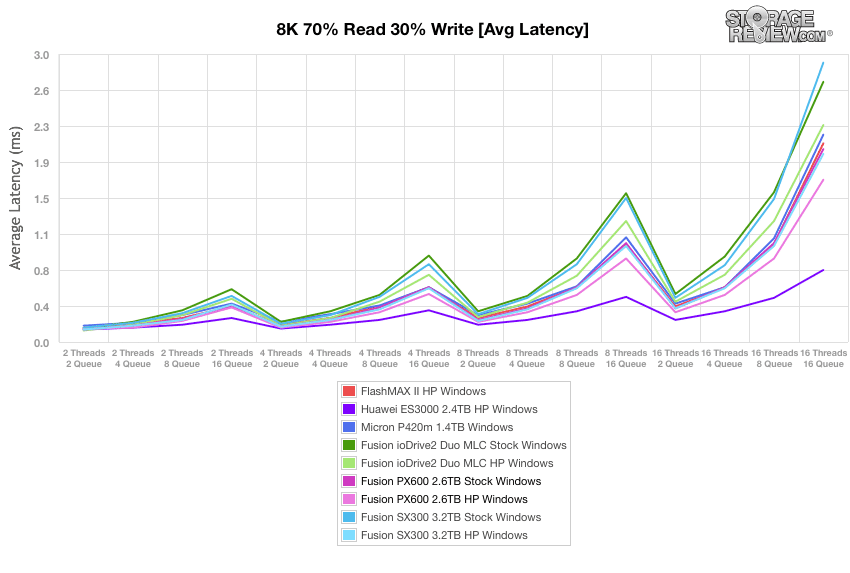
Results were basically mirrored when testing average latency, with the PX600 HP Linux taking second place (performance in Stock Linux was fairly close behind). The Huawei was once again the top performer.
Average latency for the Fusion-io PX600 in Windows was again impressive, with the HP environment coming in at just under 1.8ms. The PX600 using Stock Windows hovered around 2.0ms by the end of the tests.
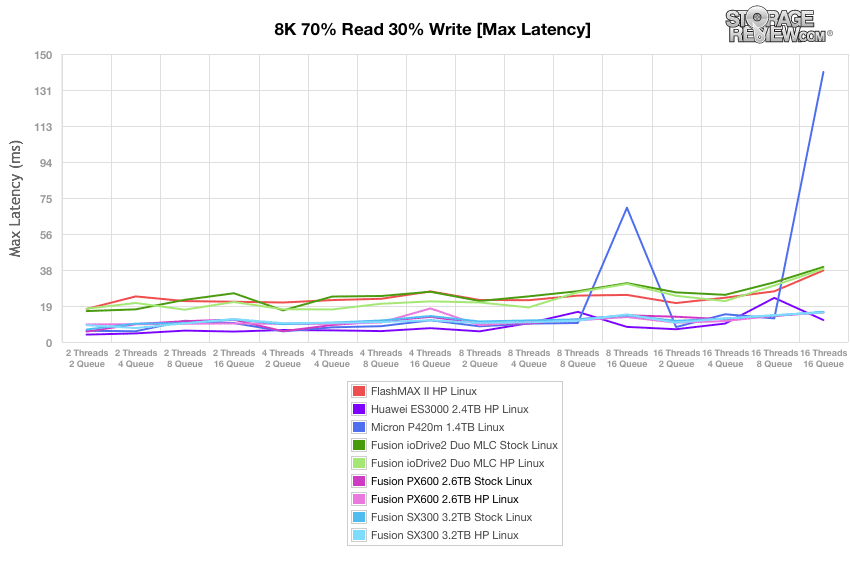
Neither configuration of the Fusion-io PX600 showed any major max latency spikes, and both peaks remained under 19ms through the duration of the test.
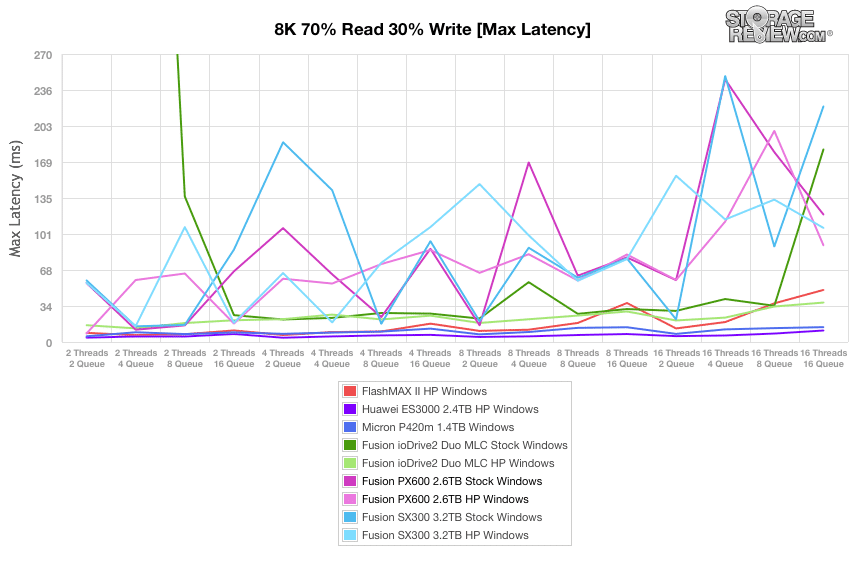
Max latency in a Windows environment was considerably less consistent for the PX600, with some major spikes throughout the benchmark.
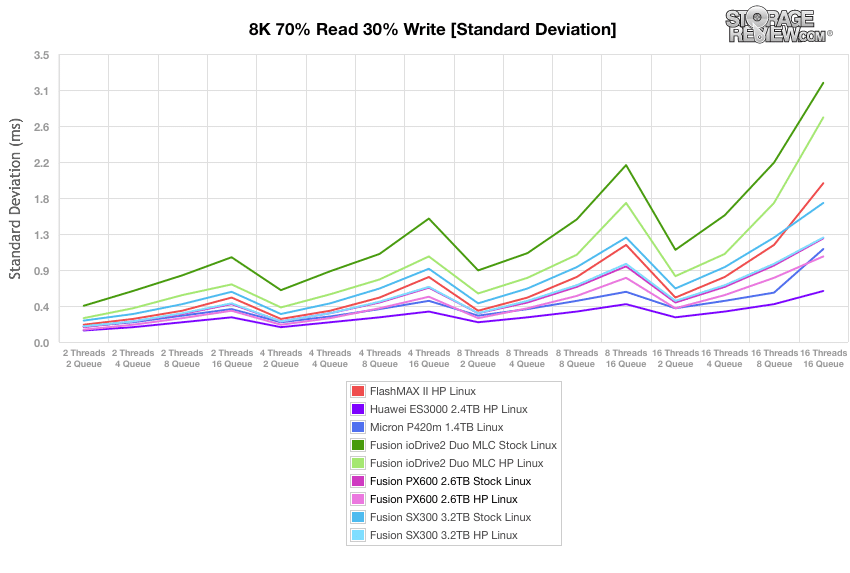
The standard deviation of the Fusion-io PX600 HP Linux was very impressive (with Stock close behind) both generally and when compared to the ioDrive2 Duo results.
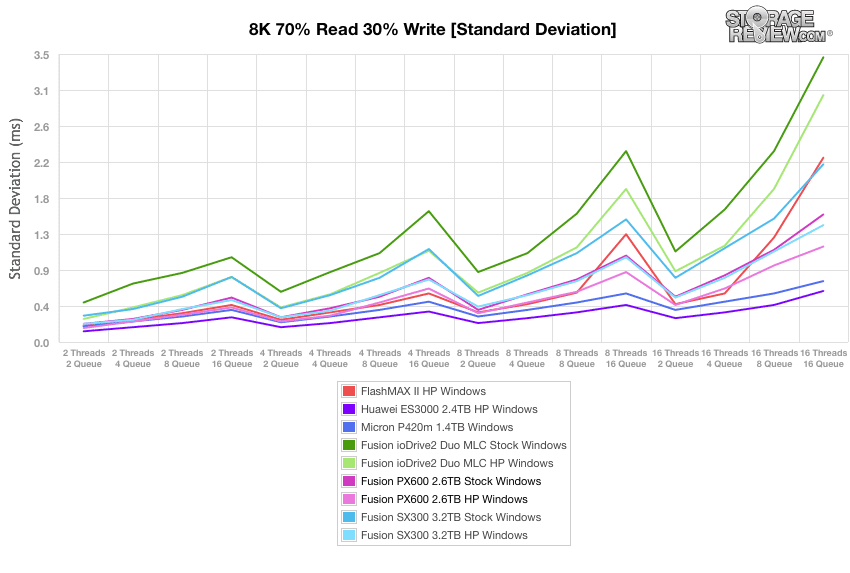
The overall standard deviation results were virtually identical in a Windows environment (the PX600 performed exceptionally well), although there were a few higher spikes from some of the solutions near the end.
Conclusion
The Fusion-io Atomic Series PX600 is the third-generation PCIe Application Accelerator from Fusion-io (SanDisk). It is designed to significantly improve mission critical applications by offering incredibly low latencies and plenty of endurance. The PX600 offers a PCIe 2.0 x8 interface and is available in capacities of 1TB, 1.3TB, 2.6TB (all HHHL), and 5.2TB (FHHL). The PX600 follows the footsteps of past Fusion-io models, with a field-programmable gate array (FPGA) to manage its NAND. As a result, the PX600 is very adaptable, and Fusio-io can do (and improve) many different things through software updates (including the ability to fix bugs through re-programming, reducing non-recurring engineering costs).
One of the core changes from the prior Gen2 cards is the move to a smaller NAND package. This migration can be problematic, as the smaller lithography NAND tends to be more difficult to work with, impacting performance. However, the increased density yields higher-capacity cards. When we look at the performance of the PX600, the card gave up a little bit in synthetic testing but the value of such tests is minor. In the application tests, which matter more on the enterprise front, the card did well.
In our Microsoft SQL Server TPC-T test, average latency was nearly identical to the prior version, just slightly lower than the top results. In our MarkLogic NoSQL benchmark, the overall average latency improved beyond what the ioDrive2 Duo was capable of. We also noted storage performance in our MySQL Sysbench test, where the PX600 played leapfrog with the dual-controller Memblaze application accelerator, even though the PX600 used a single-controller design. The main area where the PX600 showed weakness was in our synthetic test lineup, which is proving to be less relevant as each newer-generation products are released. We are seeing more devices that show weaknesses in our traditional 4k or 8k 70/30 tests, but prove very competitive in our application tests.
Pros
- Performance is on par with prior gen, despite NAND die shrink challenges
- Excellent drive management software
- Tuned for application performance and endurance
Cons
- Still some peak latency issues in Windows vs. Linux
Bottom Line
The Fusion ioMemory PX600 offers up to 5.2TB of PCIe storage that's tuned for latency sensitive enterprise applications. The PX600 offers class-leading SQL Server latency while providing hefty endurance for enterprises that want a blend of performance, capacity, and longevity without compromise.
Fusion ioMemory PX600 Product Page

