
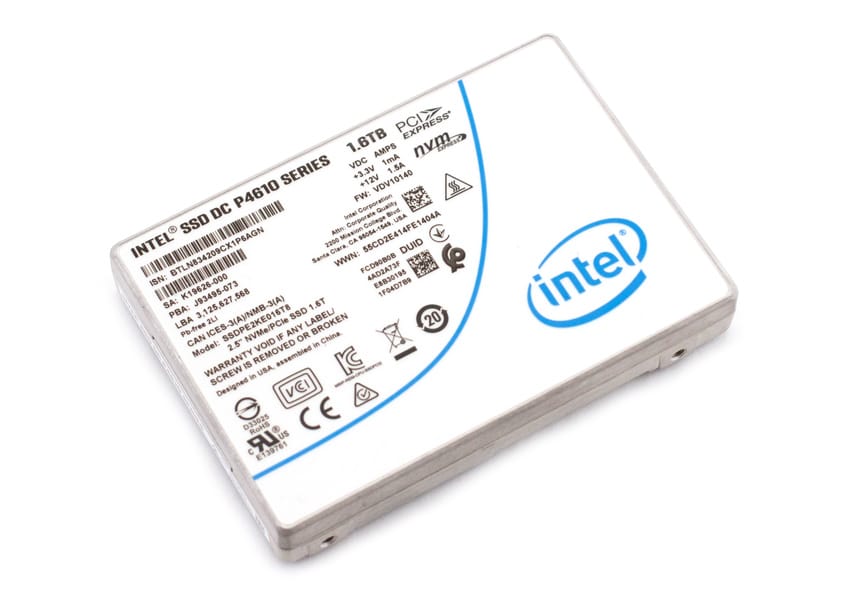
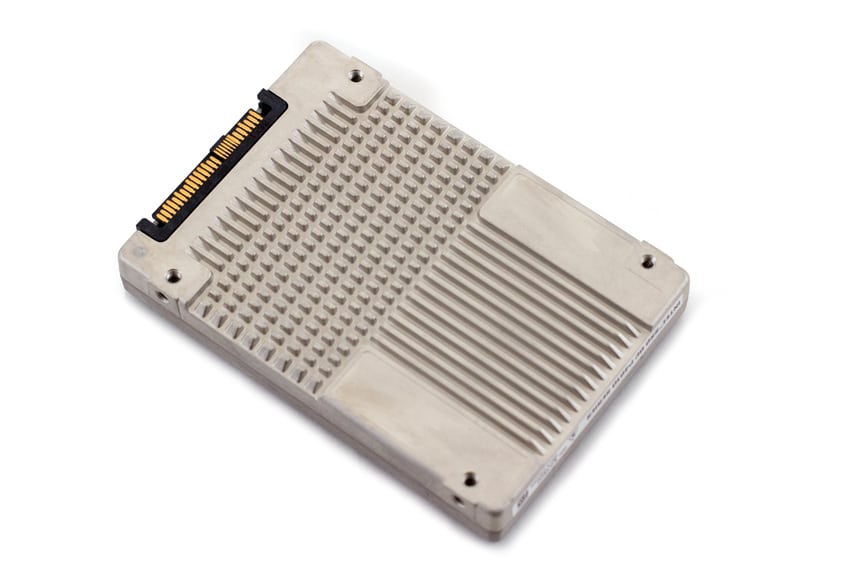
 The Intel SSD DC P4610 Series is the company's newest line of data center drives specifically built for performance, QoS, and capacity. Leveraging the NVMe specification 1.2 inside a U.2 2.5” form factor, this focus on storage efficiency allows organizations to minimize service outages and to effectively manage their data centers "at scale". The new Intel line also helps improve server agility and utilization and accelerates applications in a variety of different cloud workloads.
The Intel SSD DC P4610 Series is the company's newest line of data center drives specifically built for performance, QoS, and capacity. Leveraging the NVMe specification 1.2 inside a U.2 2.5” form factor, this focus on storage efficiency allows organizations to minimize service outages and to effectively manage their data centers "at scale". The new Intel line also helps improve server agility and utilization and accelerates applications in a variety of different cloud workloads.
This time around, Intel uses 64-layer TLC 3D NAND technology, which allowed them to increase the maximum capacity of the P4610 Series by up to 20% compared to the previous line (P4600). Intel indicates that this will add further workload applications, including more users for cloud and enterprise service providers and improved data service levels.
As far as performance goes, the DC P4610 Series is expected to reach sequential read and write speeds up to 3,200MB/s and 2,100 MB/s, respectively, while random read and writes are quoted at 620,000 IOPS and 200,000 IOPS. Intel claims this will translate to 35% faster writes rate, improved endurance of up to 35% per drive, and up to four times the reduction of service time at a QoS metric of 99.99% availability for random access workload
The Intel SSD DC P4610 Series comes in capacities of 1.6TB, 3.2TB, 6.4TB, and 7.68TB. We will be looking at the smallest capacity SSD in this review.
Intel SSD DC P4610 Series Specifications
| Form factor | U.2 | ||||
| Capacity | 1.6TB | 3.2TB | 6.4TB | 7.68TB | |
| NAND | 64-Layer 3D TLC NAND | ||||
| Interface | PCIe NVMe 3.1 x4 | ||||
| Protocol | NVMe 1.2 | ||||
| Performance | |||||
| Sequential Read (128KB) | 3,200MB/s | 3,200MB/s | 3,000MB/s | 3,200MB/s | |
| Sequential Write (128KB) | 3,200 MB/s | 3,000MB/s | 2,900MB/s | 3,200MB/s | |
| Sustained Random Read (4KB) | 640000 IOPS | 640000 IOPS | 640000 IOPS | 640000 IOPS | |
| Sustained Random Write (4KB) | 220000 IOPS | 200000 IOPS | 220000 IOPS | 220000 IOPS | |
| Latency Read | 77 µs | ||||
| Mean Time Between Failures (MTBF) | 2 Millions | ||||
| Weight | 139g | ||||
| Warranty | 5 years | ||||
| Power consumption (active/idle) | 5W/13.3W | 5W/13.8W | 5W/14.6W | 5W/14.8W | |
Performance
Testbed
Our Enterprise SSD reviews leverage a Lenovo ThinkSystem SR850 for application tests and a Dell PowerEdge R740xd for synthetic benchmarks. The ThinkSystem SR850 is a well-equipped quad-CPU platform, offering CPU power well in excess of what's needed to stress high-performance local storage. Synthetic tests that don't require a lot of CPU resources use the more traditional dual-processor server. In both cases, the intent is to showcase local storage in the best light possible that aligns with storage vendor maximum drive specs.
Lenovo ThinkSystem SR850
- 4 x Intel Platinum 8160 CPU (2.1GHz x 24 Cores)
- 16 x 32GB DDR4-2666Mhz ECC DRAM
- 2 x RAID 930-8i 12Gb/s RAID Cards
- 8 NVMe Bays
- VMware ESXI 6.5
Dell PowerEdge R740xd
- 2 x Intel Gold 6130 CPU (2.1GHz x 16 Cores)
- 16 x 16GB DDR4-2666MHz ECC DRAM
- 1x PERC 730 2GB 12Gb/s RAID Card
- Add-in NVMe Adapter
- Ubuntu-16.04.3-desktop-amd64
Testing Background and Comparables
The StorageReview Enterprise Test Lab provides a flexible architecture for conducting benchmarks of enterprise storage devices in an environment comparable to what administrators encounter in real deployments. The Enterprise Test Lab incorporates a variety of servers, networking, power conditioning, and other network infrastructure that allows our staff to establish real-world conditions to accurately gauge performance during our reviews.
We incorporate these details about the lab environment and protocols into reviews so that IT professionals and those responsible for storage acquisition can understand the conditions under which we have achieved the following results. None of our reviews are paid for or overseen by the manufacturer of equipment we are testing. Additional details about the StorageReview Enterprise Test Lab and an overview of its networking capabilities are available on those respective pages.
Main comparables for this review:
- Memblaze PBlaze5 910 3.84TB
- Memblaze PBlaze5 910 7.86TB AIC
- Intel P4510 2TB
- Intel P4510 8TB
- Huawei ES3000 v5 3.2TB
- Liqid Element AIC
- Memblaze PBlaze5 916 3.2TB
Application Workload Analysis
In order to understand the performance characteristics of enterprise storage devices, it is essential to model the infrastructure and the application workloads found in live-production environments. Our benchmarks for the Intel P4610 are therefore the MySQL OLTP performance via SysBench. For our application workloads, each drive will be running 2-4 identically configured VMs. Note: The 1.6TB model wasn't big enough for our SQL application workload, so it wasn't included in this review.
Sysbench Performance
The next application benchmark consists of a Percona MySQL OLTP database measured via SysBench. This test measures average TPS (Transactions Per Second), average latency, and average 99th percentile latency as well.
Each Sysbench VM is configured with three vDisks: one for boot (~92GB), one with the pre-built database (~447GB), and the third for the database under test (270GB). From a system resource perspective, we configured each VM with 16 vCPUs, 60GB of DRAM and leveraged the LSI Logic SAS SCSI controller.
Sysbench Testing Configuration (per VM)
- CentOS 6.3 64-bit
- Percona XtraDB 5.5.30-rel30.1
- Database Tables: 100
- Database Size: 10,000,000
- Database Threads: 32
- RAM Buffer: 24GB
- Test Length: 3 hours
- 2 hours preconditioning 32 threads
- 1 hour 32 threads
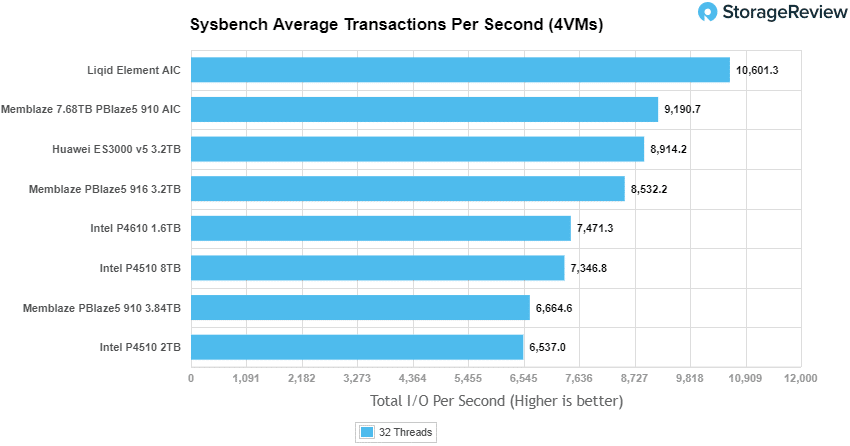
With the Sysbench transactional benchmark, the Intel 4610 hit a solid 7,471.3 TPS landing in fifth place.
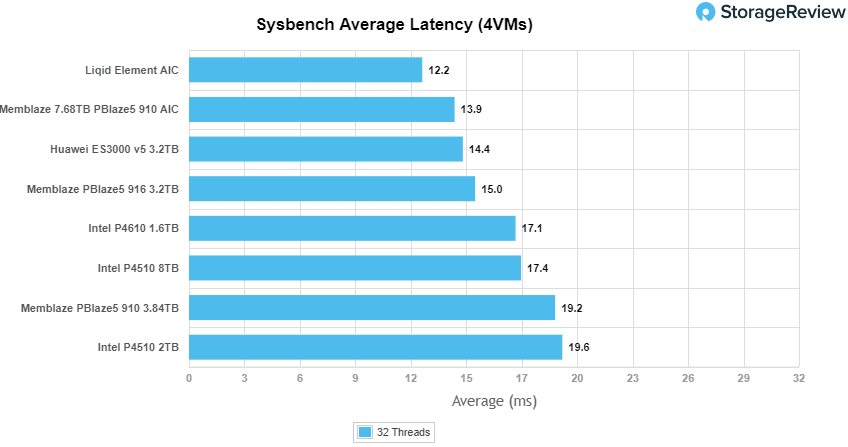
With Sysbench average latency the Intel 4610 again placed fifth among the comparables with a latency of 17.1ms.
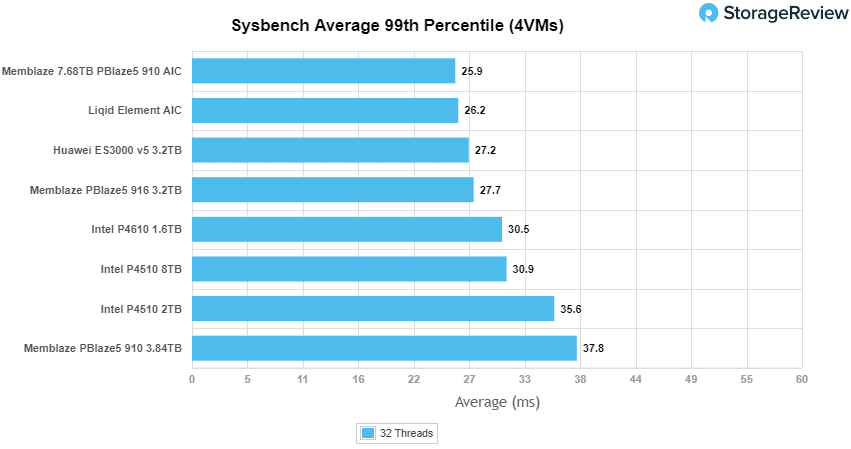
Our worst-case scenario latency benchmark saw the Intel 4610 land again in fifth place with 30.5ms.
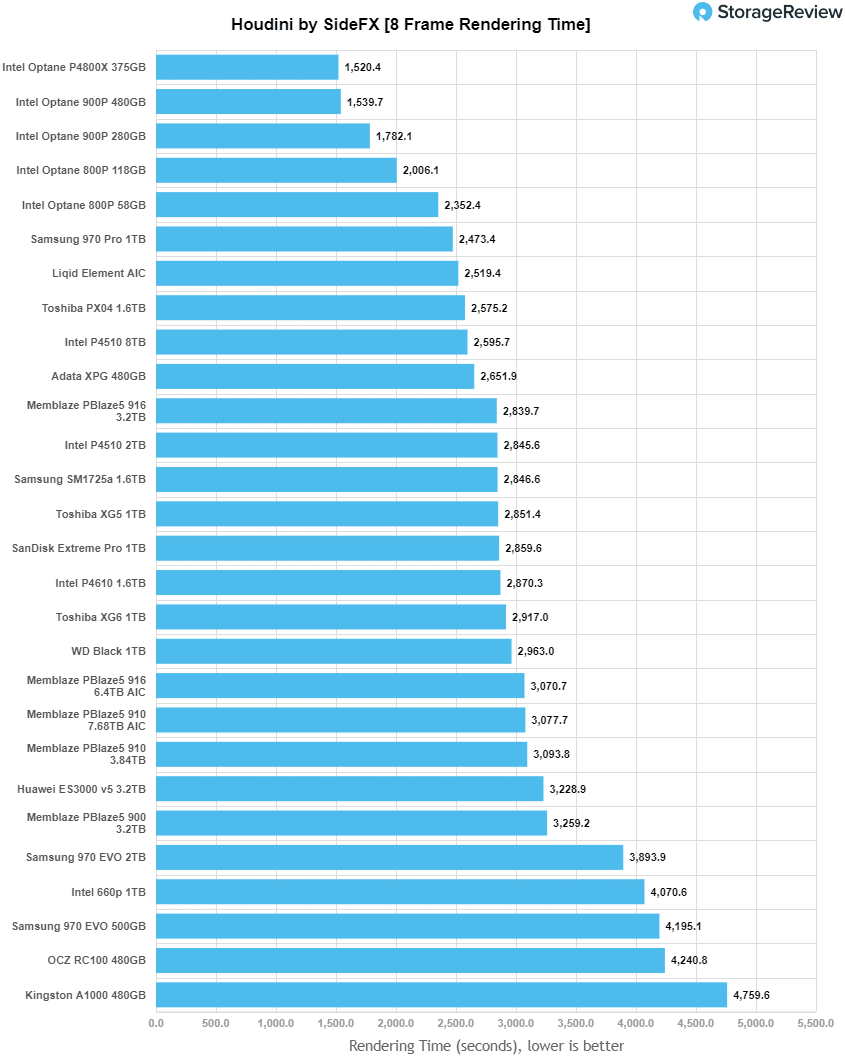
Houdini by SideFX
The Houdini test is specifically designed to evaluate storage performance as it relates to CGI rendering. The test bed for this application is a variant of the core Dell PowerEdge R740xd server type we use in the lab with dual Intel 6130 CPUs and 64GB DRAM. In this case, we installed Ubuntu Desktop (ubuntu-16.04.3-desktop-amd64) running bare metal. Output of the benchmark is measured in seconds to complete, with fewer being better.
The Maelstrom demo represents a section of the rendering pipeline that highlights the performance capabilities of storage by demonstrating its ability to effectively use the swap file as a form of extended memory. The test does not write out the result data or process the points in order to isolate the wall-time effect of the latency impact to the underlying storage component. The test itself is composed of five phases, three of which we run as part of the benchmark, which are as follows:
- Loads packed points from disk. This is the time to read from disk. This is single threaded, which may limit overall throughput.
- Unpacks the points into a single flat array in order to allow them to be processed. If the points do not have dependency on other points, the working set could be adjusted to stay in-core. This step is multi-threaded.
- (Not Run) Process the points.
- Repacks them into bucketed blocks suitable for storing back to disk. This step is multi-threaded.
- (Not Run) Write the bucketed blocks back out to disk.
With the Houdini test, the Intel P4610 placed in the upper middle part of the pack.
VDBench Workload Analysis
When it comes to benchmarking storage devices, application testing is best, and synthetic testing comes in second place. While not a perfect representation of actual workloads, synthetic tests do help to baseline storage devices with a repeatability factor that makes it easy to do apples-to-apples comparison between competing solutions. These workloads offer a range of different testing profiles ranging from "four corners" tests, common database transfer size tests, to trace captures from different VDI environments. All of these tests leverage the common vdBench workload generator, with a scripting engine to automate and capture results over a large compute testing cluster. This allows us to repeat the same workloads across a wide range of storage devices, including flash arrays and individual storage devices. Our testing process for these benchmarks fills the entire drive surface with data, then partitions a drive section equal to 25% of the drive capacity to simulate how the drive might respond to application workloads. This is different than full entropy tests which use 100% of the drive and take them into steady state. As a result, these figures will reflect higher-sustained write speeds.
Profiles:
- 4K Random Read: 100% Read, 128 threads, 0-120% iorate
- 4K Random Write: 100% Write, 64 threads, 0-120% iorate
- 64K Sequential Read: 100% Read, 16 threads, 0-120% iorate
- 64K Sequential Write: 100% Write, 8 threads, 0-120% iorate
- Synthetic Database: SQL and Oracle
- VDI Full Clone and Linked Clone Traces
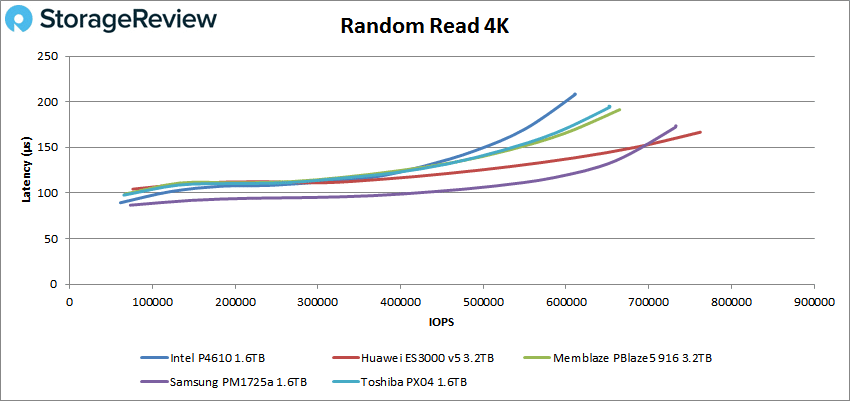
In our first VDBench Workload Analysis, Random 4K Read, the Intel P4610 was stayed under 1ms throughout with a peak of 610,532 IOPS and a latency of 208.3μs placing in the bottom of the pack.
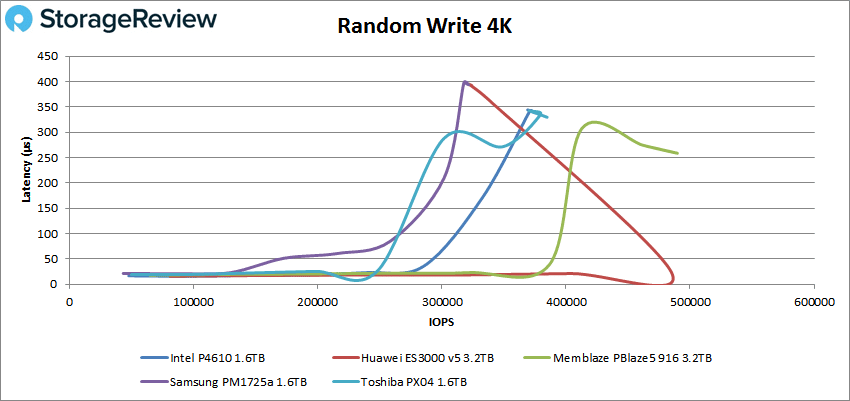
In 4K random writes, the P4610 again saw sub-millisecond latency throughout placing third. Specifically, it had a peak performance of 375,251 IOPS and a latency of 338.3μs.
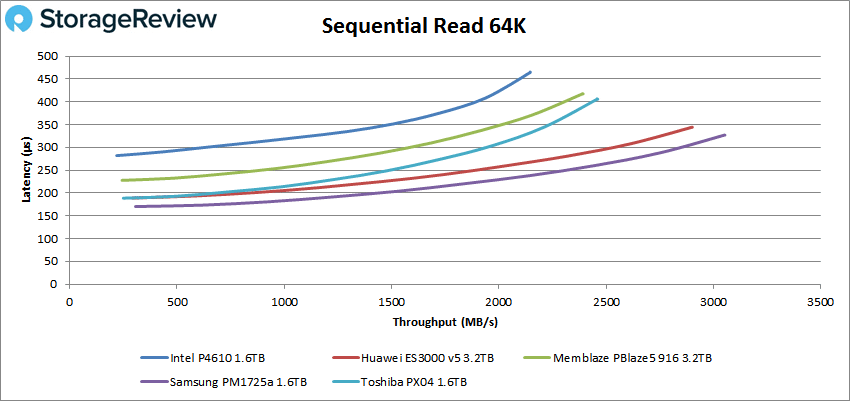
Switching over to sequential workloads, the P4610 fell to last again in 64K reads with a peak score of 34,336 IOPS (or 2.15GB/s) with a latency of 464.6μs.
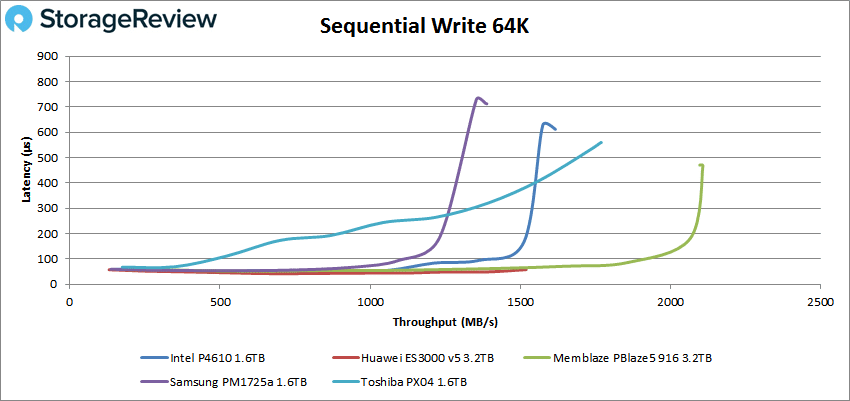
The P4610 once again came in third in write performance in our 64K sequential test with 25,661 IOPS (or 1.6GB/s) with 611.6μs.
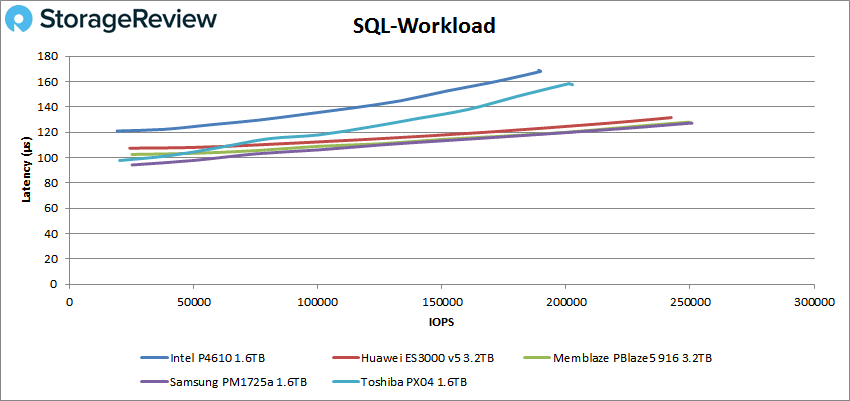
Moving on to SQL workloads the P4610 peaked at 188,997 IOPS with 168.9μs latency, falling to the bottom of the pack.
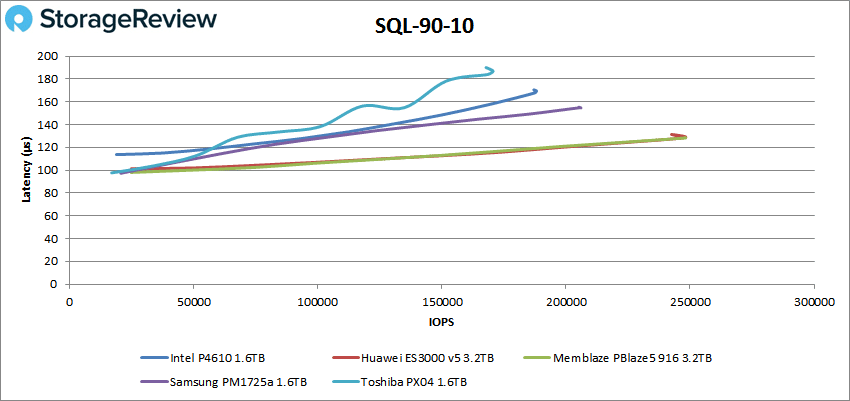
SQL 90-10 saw the P4610 retain fourth place with a peak score of 187,357 IOPS and a latency of 169.5μs, placing it right in the middle of the pack.
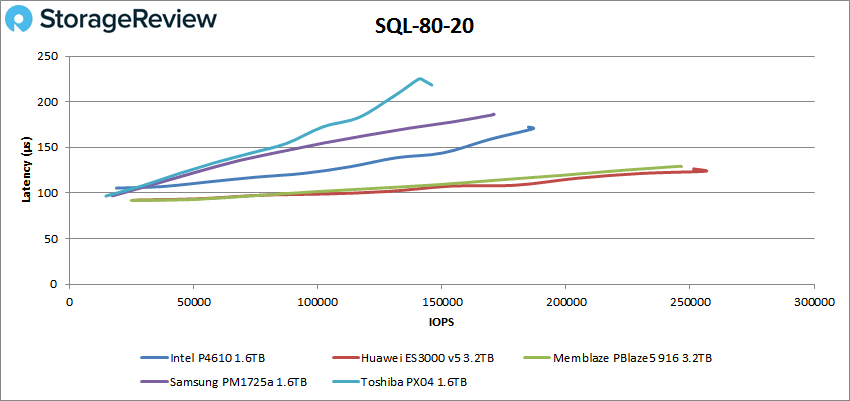
The P4610 peaked at 186,197 IOPS with a latency of 170.6μs in the SQL 80-20 benchmark.
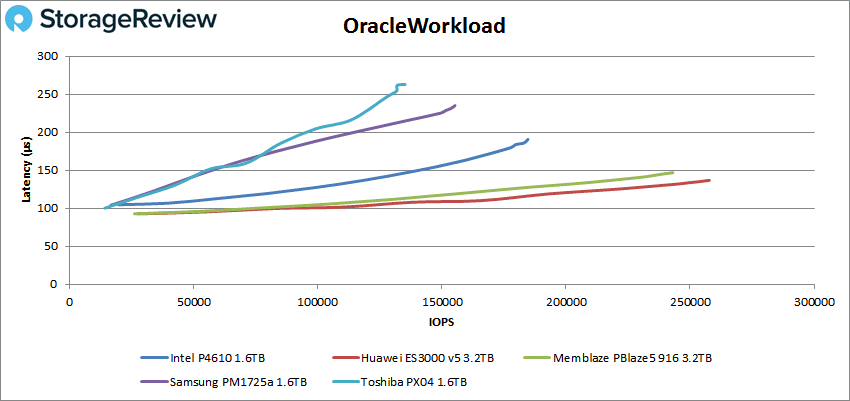
With our Oracle workload the P4610 continued trailing the Memblaze and the Huawei with 184,659 OPS and a latency of 190.7μs.
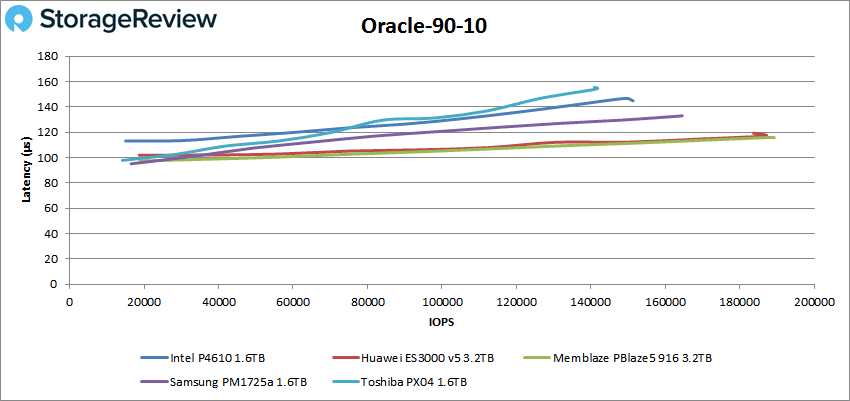
For Oracle 90-10, the P4610 had a peak of 151,174 IOPS and a latency of 145μs, placing it second to last.
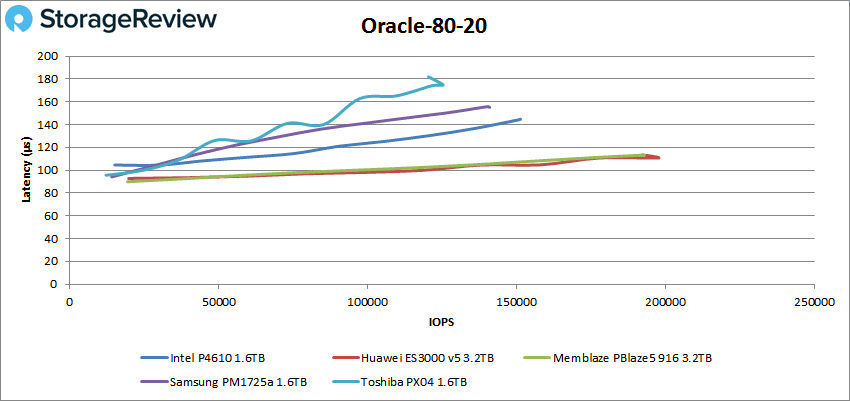
In the middle of the pack, the P4610 had peak performance of 150,698 IOPS and a latency of 144.2μs in our Oracle 80-20.
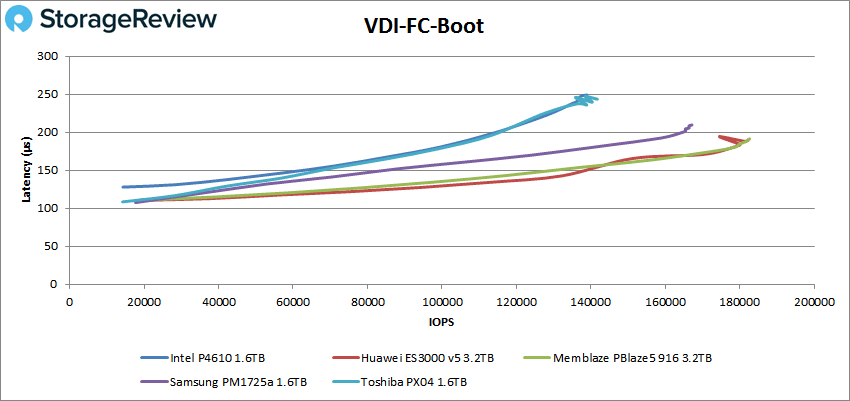
Next, we move on to our Full and Linked VDI clone tests. For VDI Full Clone Boot, the P4610 had a peak performance of 137,610 IOPS and a latency of 248μs.
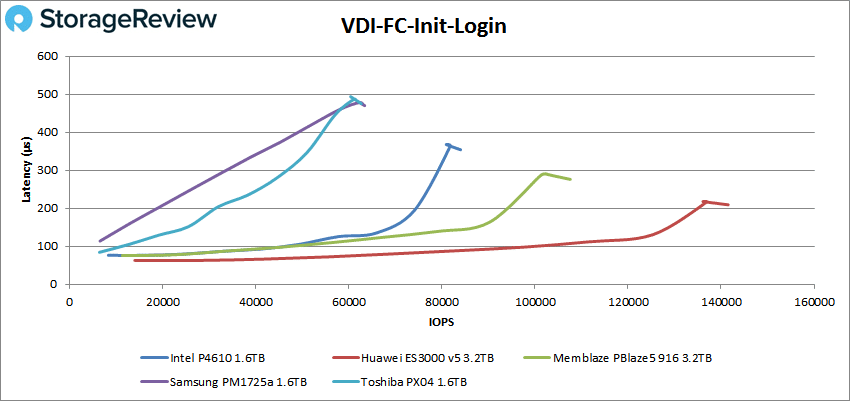
In VDI FC Initial Login, the P4610 had a peak performance of 84,026 IOPS and a latency of 353.9μs, placing third.
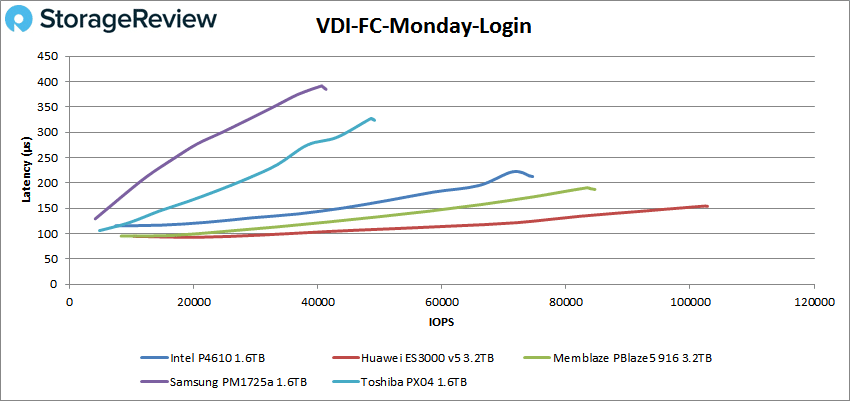
With VDI FC Monday Login the P4610 peaked at 74,635 IOPS and a latency of 212.5μs.
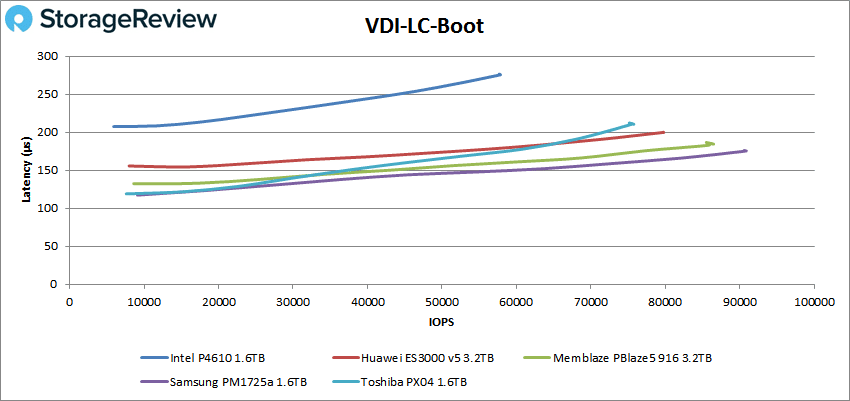
Switching over to Linked Clone (LC), we first look at the boot test where the P4610 placed last 74,635 IOPS and a latency of 275.7μs.
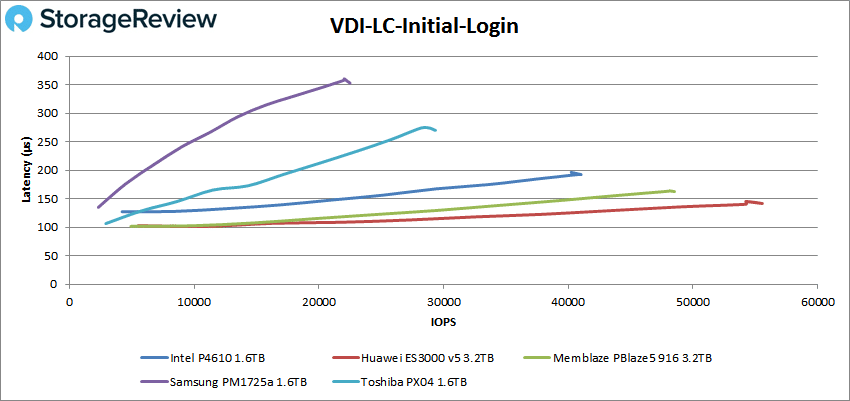
VDI LC Initial Login had the P4610 had peak performance of 40,236 IOPS and a latency of 196.3μs.
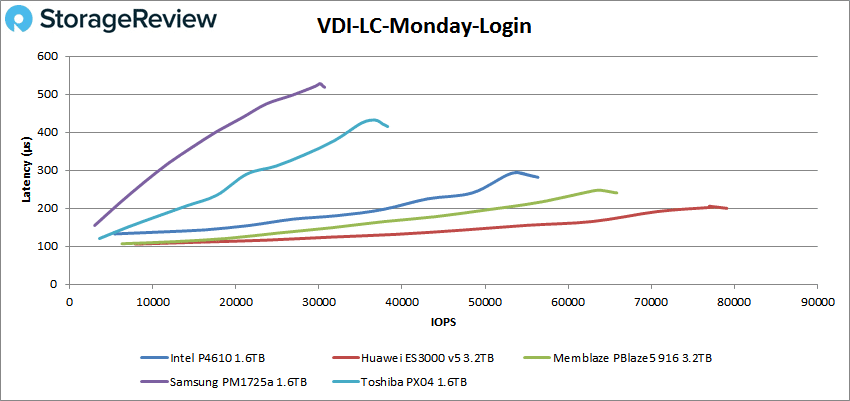
Lastly, the VDI LC Monday Login had the P4610 peak at 56,350 IOPS and a latency of 281.4μs for third place.
Conclusion
The Intel SSD DC P4610 Series offers a new and improved model to the performance-driven line of NVMe data center drives. The new P4610 features 64-Layer 3D NAND, comes in the U.2 form factor and is available in capacities of 1.6TB, 3.2TB, 6.4TB, and 7.68TB, the former which we tested for this review. Intel claims improved performance over the last-gen line with quoted read and write speeds up to 3,200MB/s and 2,100 MB/s, respectively, and random read and writes of 620,000 IOPS and 200,000 IOPS. Intel has built the P4610 SSD line to excel specifically in demanding service levels while supporting larger cloud workloads to drive down costs.
Looking at our sysbench application performance, the P4610 showed a solid 7,471.3 TPS, an average latency of 17.1ms and worst-case scenario latency of 30.5ms, behind several other drives. In our Houdini by SideFX benchmark, the new Intel drive had 2,870.3 seconds placing it in the middle of the field. The 1.6TB sample size wasn't large enough for our SQL Server test so it was not performed for this review.
For VDBench, the P4610 showed sub-millisecond latency throughout all tests. Key results include 610,532 IOPS on 4K read, 375,251 IOPS on 4K write, 2.15GB/s on 64K read, and 1.6GB/s on 64K write. The Oracle showed 184,659 IOPS, 151,174 IOPS and 150,698 IOPS for workload, 90-10 and 8020, respectively, while the SQL tests ran between 186K IOPS and 189K IOPS.
Overall the Intel P4610 showed average to underwhelming performance depending on the application you focused on. In our Houdini rendering benchmark, it came up slower than the read-centric P4510. In our workloads that focused on read performance, it came up short compared to other mixed workload drives in this category. In benchmarks with some concentration of write behavior, performance picked up, but to more middle-ground levels. Depending on cost though, the P4610 may still turn out to be a good investment for applications that aren't terribly latency sensitive.
Sign up for the StorageReview newsletter