
 In August of 2017, we posted our review of the NetApp A200 all flash array. We really enjoyed the performance and feature set; ultimately it earned one of only five Editor’s Choice Awards we gave out in 2017. It was with much excitement then that we obtained the next system from NetApp for review. The A300 was launched in the fall of 2016, and firmly targets the midrange storage customer. This isn’t entirely different than the A200’s target; the A300 just adds more performance and scalability oomph over its smaller cousin. The A300 of course runs the latest version of ONTAP and supports SSDs up to 30TB and is just as easy as the A200 to set up.
In August of 2017, we posted our review of the NetApp A200 all flash array. We really enjoyed the performance and feature set; ultimately it earned one of only five Editor’s Choice Awards we gave out in 2017. It was with much excitement then that we obtained the next system from NetApp for review. The A300 was launched in the fall of 2016, and firmly targets the midrange storage customer. This isn’t entirely different than the A200’s target; the A300 just adds more performance and scalability oomph over its smaller cousin. The A300 of course runs the latest version of ONTAP and supports SSDs up to 30TB and is just as easy as the A200 to set up.
Architecturally the units are a little different. While the A200 chassis combines drives and controllers in one 2U package, the A300 has a dedicated set of controllers in a 3U chassis and the drives are added as shelves (12Gb/s SAS). The A300 requires just 12 SSDs to start but scales to over 140PB raw (560PB effective) in NAS config and 70PB raw (280PB effective) as SAN. NetApp supports 10GbE, 40GbE as well as Fibre Channel up to 32Gb and NVMe/FC with the 32Gb FC adapter.
Our unit under review is configured with one DS224C shelf loaded with 24 960GB SSDs. Primary connectivity is eight 32Gb FC ports, through 2 dual-port cards in each controller. The A300 was running ONTAP version 9.4 at the time of the review.
NetApp AFF A300 Specifications
| Per HA Pair (active-active controller) | |
| Form Factor | 3U |
| Memory | 256GB |
| NVRAM | 16GB |
| Storage | |
| Maximum SSD | 384 |
| Maximum Raw Capacity | 11.7PB |
| Effective Capacity | 46.9PB (base10) |
| SSDs Supported | 30.2TB, 15.3TB, 7.6TB, 3.8TB, and 960GB. 3.8TB, and 800GB self-encrypting |
| Supported Storage Shelves | DS224C, DS2246 |
| SAN Scale-Out | 2-12 nodes |
| RAID supported | RAID6, RAID4, RAID 6 + RAID 1 or RAID 4 + RAID 1 (SyncMirror) |
| OS supported |
|
| Ports |
|
| OS version | ONTAP 9.1 RC2 or later |
| Max number of LUNs | 4,096 |
| Number of supported SAN hosts | 512 |
Design and Build
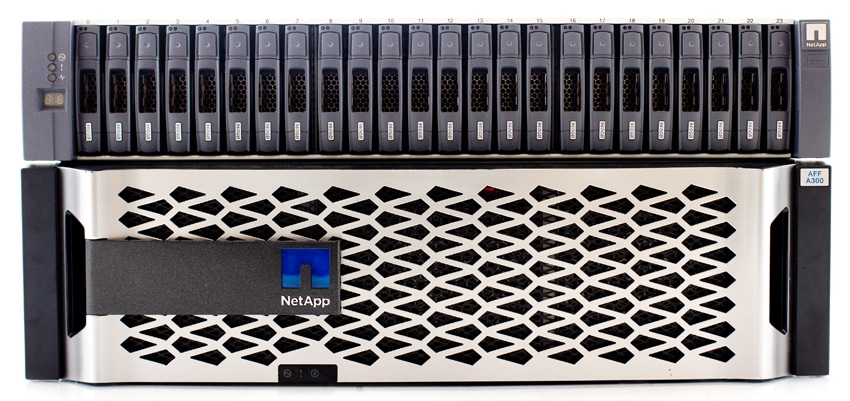
The NetApp AFF A300 looks more or less like a slightly taller version of the A200. The bezel is silver and mainly designed for ventilation. NetApp branding is on the left side. Also on the left are the status LED lights. Across the front, we see the storage shelfs for inserting 2.5″ drives.
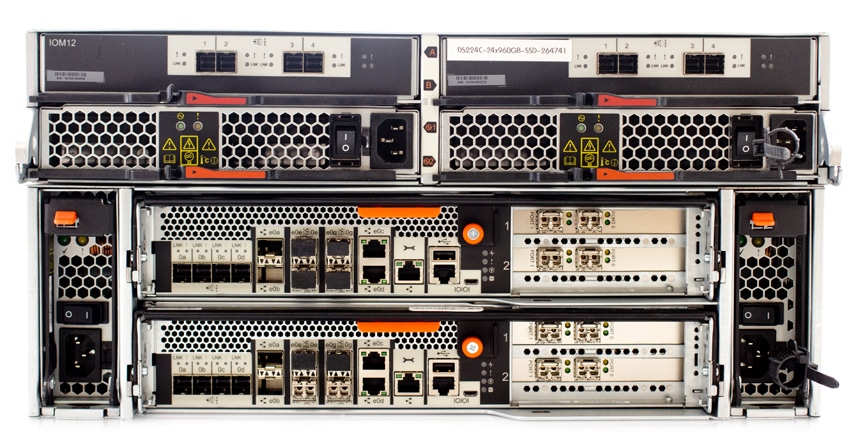
The rear of the device has redundant hot-swappable PSUs on either end, with hot-swappable fans as well. On the right side, next to the PSU, are four PCIe slots that allow for connections such as 40GbE and 32Gb FC, our model is loaded with four 32Gb FC cards. On the left, it is easy to see both controllers (one on top of the other). Here is where the SAS ports, as well as networking, and management ports are located.
Performance
For performance we will be comparing the A300 to the A200. Again this isn’t necessarily which one will perform better (the more powerful array, the A300, will win out). This is to show potential user what to expect given their performance and storage needs. In comparison of both NetApp models, we have full data reduction capabilities enabled, showing real-world performance. As we’ve noted in our previous A200 review, NetApp data reduction services have had a minimal impact towards performance.
The configuration of our NetApp AFF A300 included 8 32Gb FC ports as well as one 24-bay disk shelf. Out of the 24 960GB SSDs deployed in our A300, we split that up into two RAID-DP Aggregates consisting of each SSDs partitioned in half. While the drive count is the same as the previously reviewed A200, the A200 was completely topped out with CPU utilization. The A300 and subsequently higher models in the NetApp portfolio are each geared for deployments requiring more and more I/O and bandwidth.
The environment used to test the NetApp AFF A300 in our synthetic benchmarks consists of eight Dell EMC R740xd PowerEdge servers, each with a dual-port 16Gb FC HBA and a dual-switch FC fabric running on Brocade G620 switches.
Application Workload Analysis
The application workload benchmarks for the NetApp AFF A300 consist of the MySQL OLTP performance via SysBench and Microsoft SQL Server OLTP performance with a simulated TPC-C workload.
Testing was performed over FC using four 16Gb links, with two connections per controller.
SQL Server Performance
Each SQL Server VM is configured with two vDisks: 100GB volume for boot and a 500GB volume for the database and log files. From a system resource perspective, we configured each VM with 16 vCPUs, 64GB of DRAM and leveraged the LSI Logic SAS SCSI controller. While our Sysbench workloads tested previously saturated the platform in both storage I/O and capacity, the SQL test is looking for latency performance.
This test uses SQL Server 2014 running on Windows Server 2012 R2 guest VMs, and is stressed by Quest’s Benchmark Factory for Databases. While our traditional usage of this benchmark has been to test large 3,000-scale databases on local or shared storage, in this iteration we focus on spreading out four 1,500-scale databases evenly across the A300 (two VMs per controller).
SQL Server Testing Configuration (per VM)
- Windows Server 2012 R2
- Storage Footprint: 600GB allocated, 500GB used
- SQL Server 2014
- Database Size: 1,500 scale
- Virtual Client Load: 15,000
- RAM Buffer: 48GB
- Test Length: 3 hours
- 2.5 hours preconditioning
- 30 minutes sample period
SQL Server OLTP Benchmark Factory LoadGen Equipment
- Dell PowerEdge R730 Virtualized SQL 4-node Cluster
- Eight Intel E5-2690 v3 CPUs for 249GHz in cluster (Two per node, 2.6GHz, 12-cores, 30MB Cache)
- 1TB RAM (256GB per node, 16GB x 16 DDR4, 128GB per CPU)
- 4 x Emulex 16GB dual-port FC HBA
- 4 x Emulex 10GbE dual-port NIC
- VMware ESXi vSphere 6.5 / Enterprise Plus 8-CPU
Looking at transactional performance of the NetApp A300 had an aggregate score of 12,628.7 TPS with individual VMs ranging from 3,155.751 TPS to 3,158.52 TPS. This gives it fairly similar performance to the A200 that had an aggregate score of 12,583.8 TPS as both are running to a set limit. A better understanding of performance, and performance improvement, come from latency.
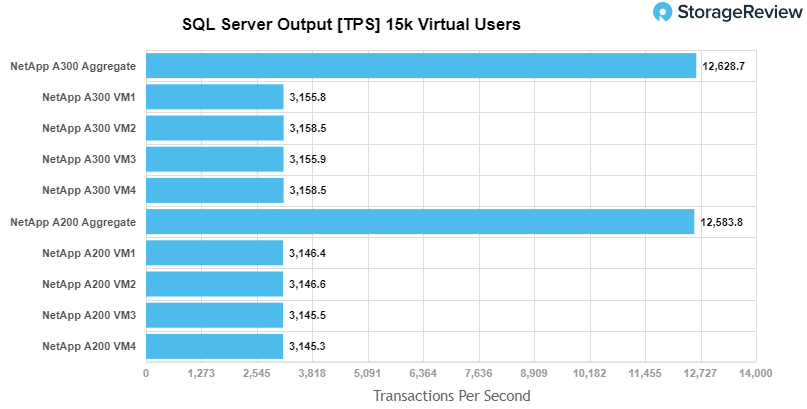
For average latency, the A300 had an aggregate score of 8ms, much faster than the A200’s 25ms. Individual VMs ranged from 6ms to 10ms.

Sysbench Performance
Each Sysbench VM is configured with three vDisks, one for boot (~92GB), one with the pre-built database (~447GB), and the third for the database under test (270GB). From a system resource perspective, we configured each VM with 16 vCPUs, 60GB of DRAM and leveraged the LSI Logic SAS SCSI controller. Load gen systems are Dell R730 servers; we range from four to eight in this review, scaling servers per 4VM group.
Dell PowerEdge R730 Virtualized MySQL 4-5 node Cluster
- 8-10 Intel E5-2690 v3 CPUs for 249GHz in cluster (Two per node, 2.6GHz, 12-cores, 30MB Cache)
- 1-1.25TB RAM (256GB per node, 16GB x 16 DDR4, 128GB per CPU)
- 4-5 x Emulex 16GB dual-port FC HBA
- 4-5 x Emulex 10GbE dual-port NIC
- VMware ESXi vSphere 6.5 / Enterprise Plus 8-CPU
Sysbench Testing Configuration (per VM)
- CentOS 6.3 64-bit
- Storage Footprint: 1TB, 800GB used
- Percona XtraDB 5.5.30-rel30.1
- Database Tables: 100
- Database Size: 10,000,000
- Database Threads: 32
- RAM Buffer: 24GB
- Test Length: 3 hours
- 2 hours preconditioning 32 threads
- 1 hour 32 threads
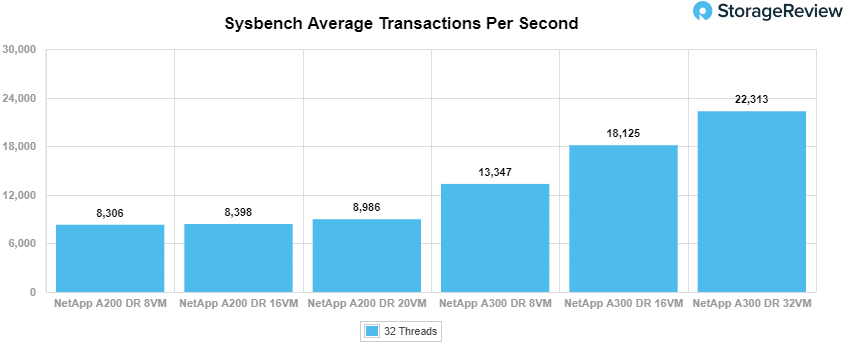
For Sysbench, we tested several sets of VMs including 8, 16, and 32, and we ran Sysbench with both the data reduction “On” and in the “Raw” form. For transactional performance, the NetApp A300 was able to hit 13,347 TPS for 8VM, 18,125 TPS for 16VM, and 22313 TPS for 32VM marking a 5,041 TPS and a 9,727 TPS improvement over the A200.
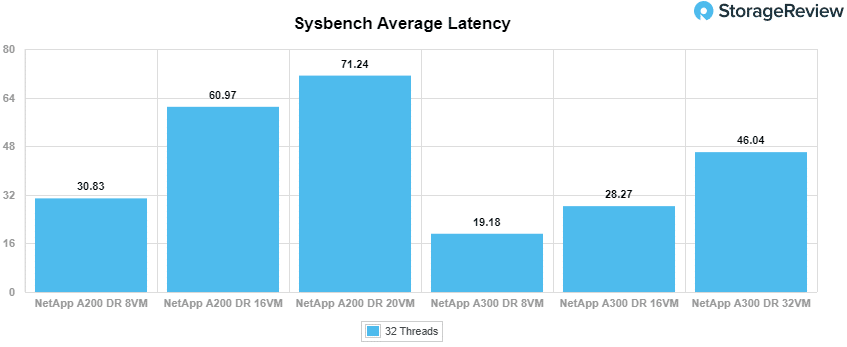
Sysbench average latency saw the A300 hit 19.18ms, 28.27ms, and 46.04ms for 8VM, 16VM, and 32VM, again a dramatic improvement over the A200.
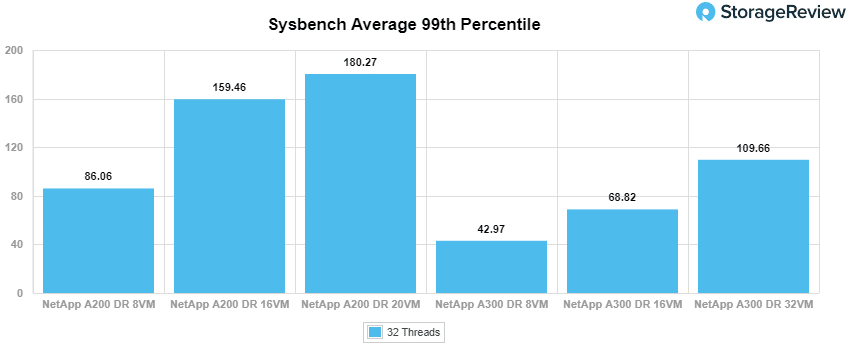
For our worst-case scenario latency the A300 was able to hit just 42.97ms for 8VM, 68.82ms for 16VM, and 109.66ms for 32VM, a marked improvement over the A200’s 8VM and 16VM scores.
VDBench Workload Analysis
When it comes to benchmarking storage arrays, application testing is best, and synthetic testing comes in second place. While not a perfect representation of actual workloads, synthetic tests do help to baseline storage devices with a repeatability factor that makes it easy to do apples-to-apples comparison between competing solutions. These workloads offer a range of different testing profiles ranging from “four corners” tests, common database transfer size tests, as well as trace captures from different VDI environments. All of these tests leverage the common vdBench workload generator, with a scripting engine to automate and capture results over a large compute testing cluster. This allows us to repeat the same workloads across a wide range of storage devices, including flash arrays and individual storage devices. On the array side, we use our cluster of Dell PowerEdge R740xd servers:
Profiles:
- 4K Random Read: 100% Read, 128 threads, 0-120% iorate
- 4K Random Write: 100% Write, 64 threads, 0-120% iorate
- 64K Sequential Read: 100% Read, 16 threads, 0-120% iorate
- 64K Sequential Write: 100% Write, 8 threads, 0-120% iorate
- Synthetic Database: SQL and Oracle
- VDI Full Clone and Linked Clone Traces
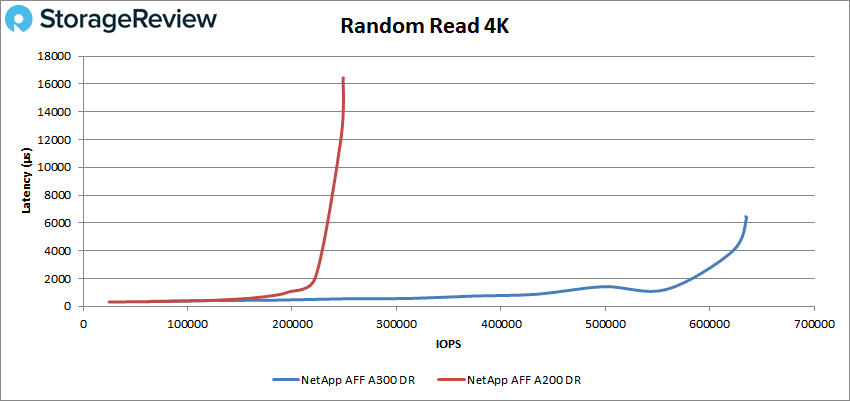
Starting with peak random 4K read performance, the A300 had a much stronger showing going to 450K IOPS before popping over 1ms and peaking at 635,342 IOPS with a latency of 6.4ms. Compared to the A200’s sub-millisecond latency up to about 195K IOPS and a peak score of about 249K IOPS with a latency of 14ms.
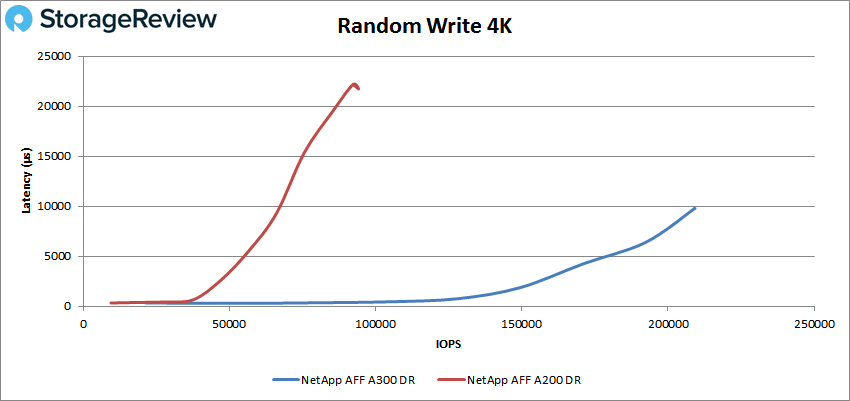
For peak 4K random write performance, the A300 made it to roughly 140K IOPS at sub-millisecond latency and went on to peak at 208,820 IOPS with a latency 9.72ms. This was a marked improvement over the A200 that had sub-millisecond latency performance until about 45K IOPS and a peak of roughly 85K IOPS at 19.6ms.
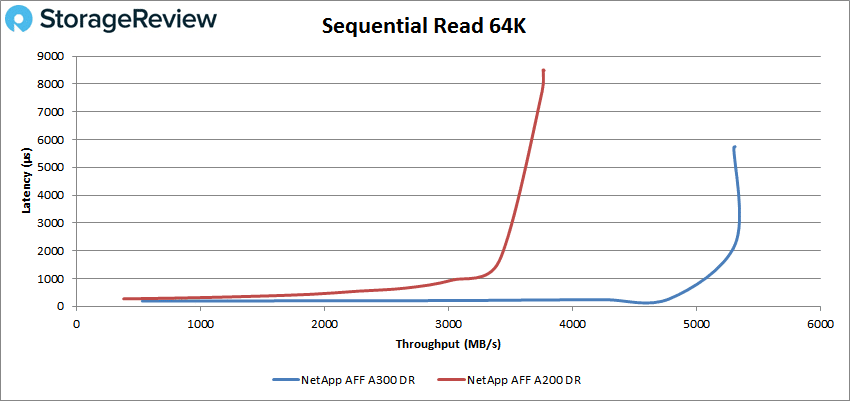
Switching over to sequential workloads, we look at peak 64K read performance, here the A300 made it to roughly 80K IOPS or 5GB/s before breaking sub-millisecond latency performance. The A300 peaked at about 84,766K IOPS or 5.71GB/s with 3.64ms latency before dropping off a bit compared to the A200’s peak of 60K IOPS or 3.75GB/s with a latency of 8.5ms.
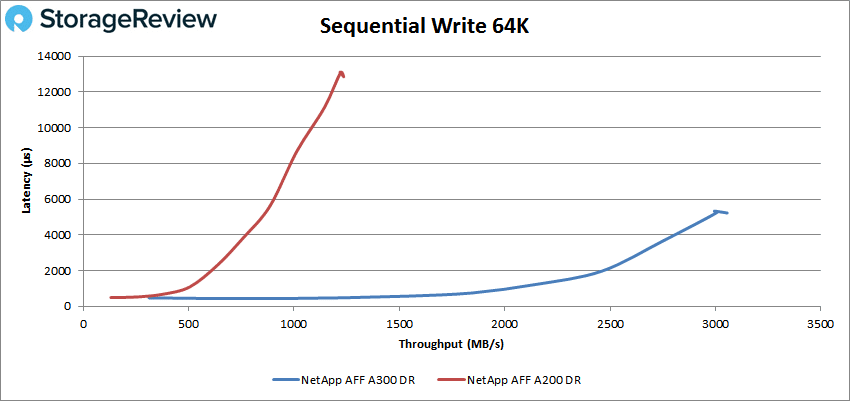
With 64K sequential write we saw another huge jump in performance between the two models. The A300 had sub-millisecond latency until about 31K IOPS or 1.91GB/s, versus the A200 at 6K or about 500MB/s. For peak performance we saw the A300 hit 48,883 IOPS or 3.1GB/s at a latency of 4.8ms versus the A200’s 19.7K IOPS or 1.22GB/s at a latency of 12.85ms.
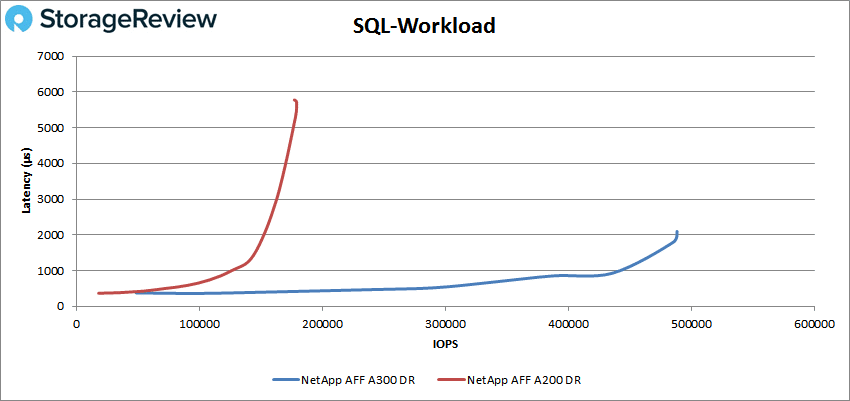
Next up is our SQL workload benchmarks. The A300 made it over 430K IOPS before breaking 1ms in latency. At its peak, the A300 was able to hit 488,488 IOPS with a latency of 2.1ms, compared to the A200’s 179K IOPS and 5.7ms latency.
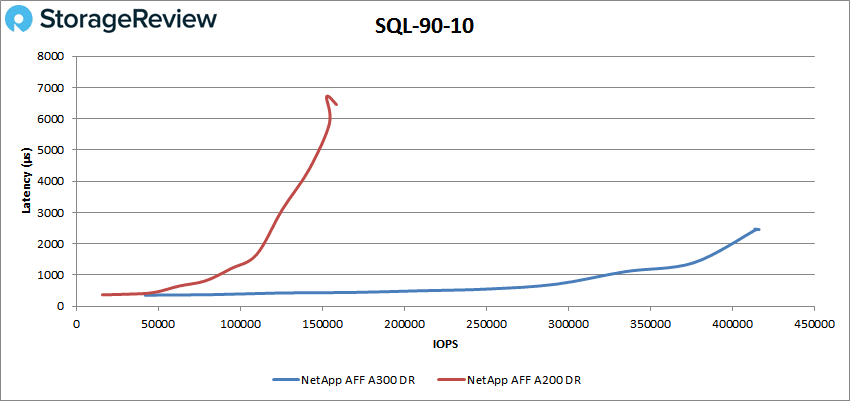
For SQL 90-10 the A300 made it around 330K IOPS with sub-millisecond latency and peaked at 416,370 IOPS with a latency of 2.46ms. This is over four times the performance of the A200 (90K IOPS) with less than half the latency (6.5ms).
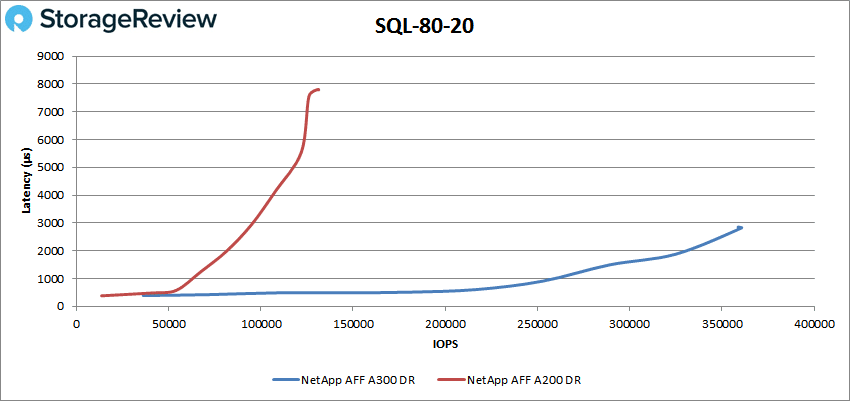
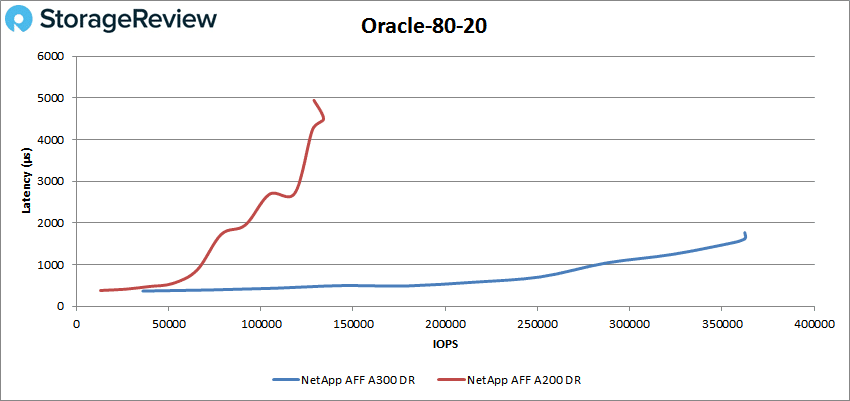
The SQL 80-20 saw the A300 again make it to roughly 250K IOPS at less than 1ms before peaking at 360,642 IOPS with 2.82ms latency. This put it over 150K IOPS higher performance and half the latency of the A200.
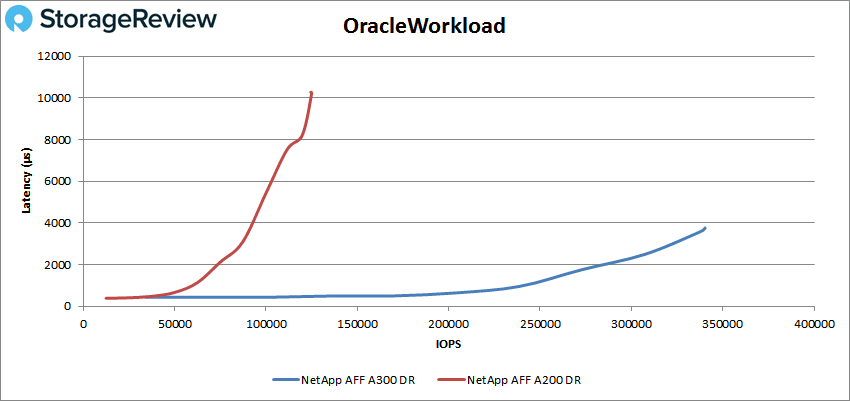
Moving on to our Oracle workloads, we see the A300 hit about 240K IOPS with sub-millisecond latency and the array peaked at 340,391 IOPS with a latency of 3.6ms. Again this is leaps and bounds over the A200 model that peaked at 125K IOPS with a latency of 10.2ms.
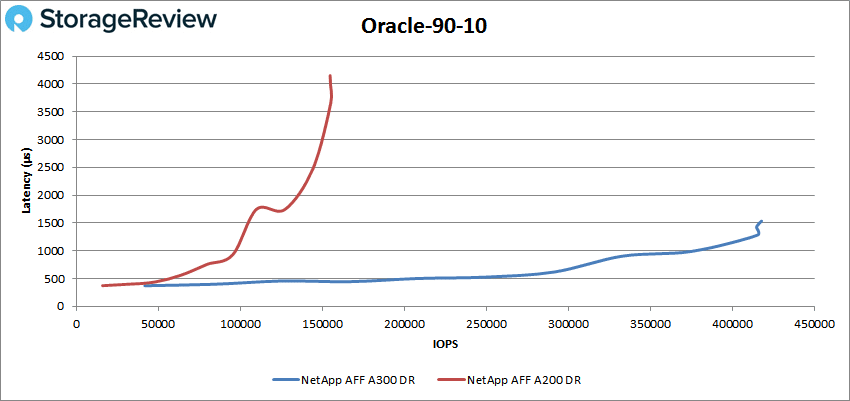
With the Oracle 90-10 it was more of the same: the A300 had sub-millisecond latency until over 375K IOPS and peaked at 417,869 IOPS with a latency of 1.53ms. For perspective, the A200 broke 1ms at about 100K IOPS and peaked at 155K IOPS with a latency of 4.2ms.
For Oracle 80-20, we saw sub-millisecond latency until roughly 285K IOPS and a peak performance of 362,499 IOPS and a latency of 1.62ms. Again this showed over twice the performance and less than half the latency of the A200.
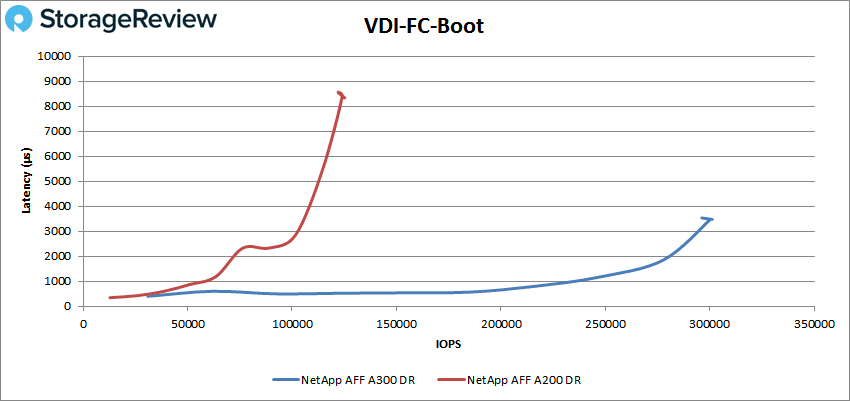
Next we switched over to our VDI Clone Test, Full and Linked. For VDI Full Clone Boot the A300 stayed under 1ms until about 225K IOPS and peaked at 300,128 IOPS with a latency of 3.46ms. This was a tremendous performance leap over the A200’s peak of 122K IOPS and latency of 8.6ms.
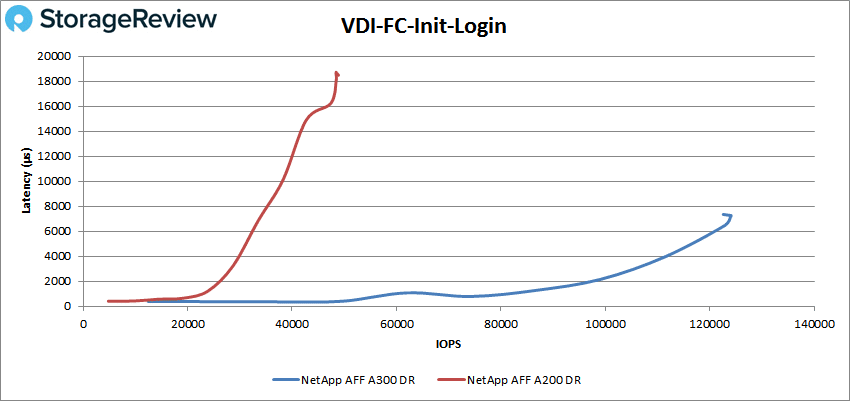
With the VDI Full Clone Initial Login, the A300 made it to 75K IOPS before going over 1ms and went on to peak at 123,984 IOPS with a latency of 7.26ms. The sub-millisecond latency performance of the A300 was better than the peak performance of the A200, 48K IOPS with a latency of 18.6ms.
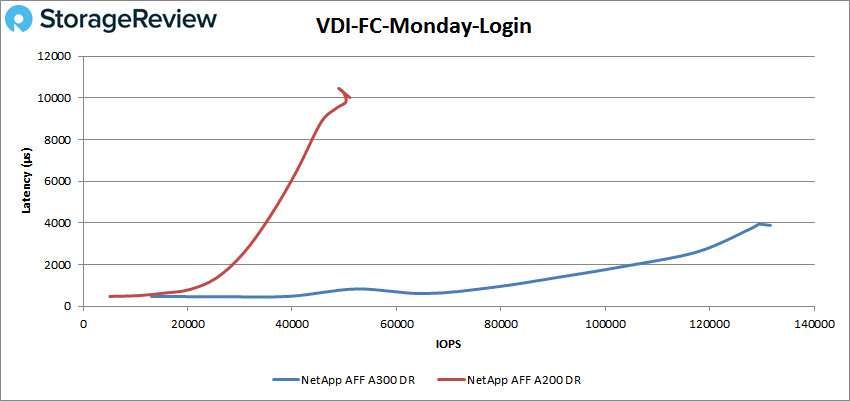
VDI FC Monday Login showed another huge bump in performance with the A300 making it to roughly 80K IOPS under 1ms and peaking at 131,628 IOPS or 2.2GB/s with a latency of 3.89ms. This is compared to the A200’s peak performance of 49K IOPS with 10.4ms for latency.
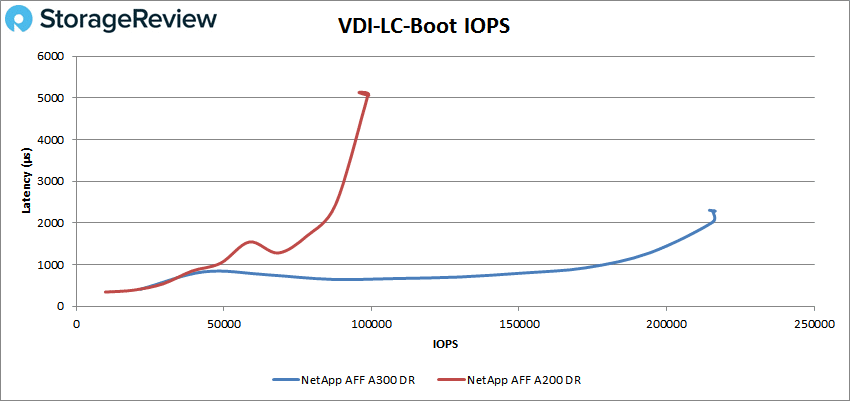
Switching over the VDI Linked Clone (LC), the A300 had sub-millisecond latency performance over 175K IOPS and peaked at 215,621 IOPS with a latency of 2.28ms for the boot test. For comparison, the A200 peaked at 95.k IOPS with a latency of 5.13ms.
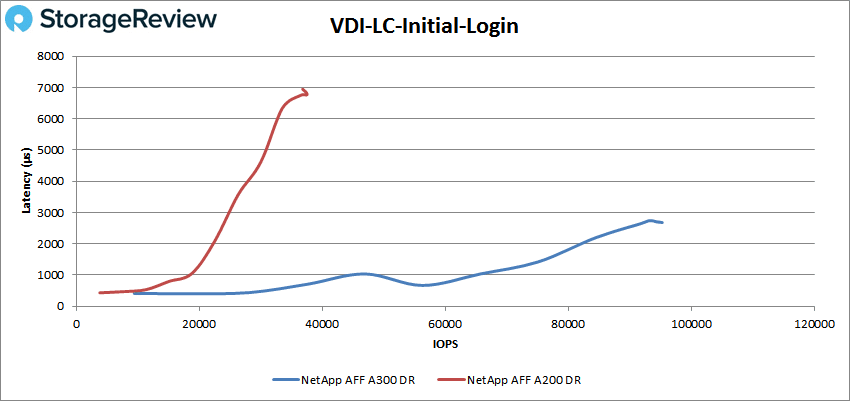
In a large difference of performance, the VDI LC Initial Login had the A300 peak at 95,296 IOPS with a latency of 2.68ms versus the A200’s peak of 37K IOPS at 6.95ms.
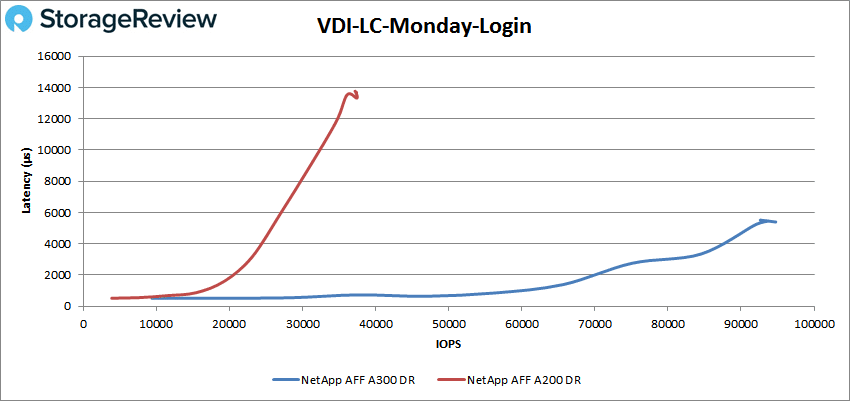
Finally we look at VDI LC Monday Login where the A300 had sub-millisecond latency up until 60K IOPS and peaked at 94,722 IOPS or 2.3GB/s with a latency of 5.4ms. the A200 had sub-millisecond latency until 17K IOPS and peaked at about 37k IOPS and 13.3ms latency.
Conclusion
NetApp released the impressive A200 all-flash array last year that earned one of our Editor’s Choice awards. The release of the more powerful NetApp AFF A300 doesn’t represent a replacement for the A200, it is a more powerful AFA for users that need additional capacity and performance. The A300 is a 3U form factor for the dual active-active controller setup, plus disk shelves. The A300 can pack quite a bit more capacity than it’s smaller cousin: 140PB raw (560PB effective) in NAS and 70PB raw (280PB effective) as SAN. The A300 supports networking up to 40GbE and FC 32Gb.
For Application Analysis we ran SQL Server and Sysbench on both the A200 and A300 with data reduction (DR) on. For the transactional performance on SQL we saw the A300 hit an aggregate score of 12,628.7 TPS an increase from the A200’s 12,583.8 TPS. With SQL Server average latency we saw a bigger increase with the A300 having an aggregate latency of 8ms compared to the A200’s 25ms. With Sysbench we tested sets of 8, 16, and 32 VMs with the A300 seeing TPS of 13,347, 18,125, 22,313 and average latency of 19.18ms, 28.27ms, and 46.04ms and worst-case scenario latency of 42.97ms, 68.82ms, and 109.66ms respectively.
For synthetic performance we tested the A300 with VDBench positioned against the A200 as a reference point. To once again note, the comparison of the A300 to the A200 is less about which one is better (the A300 is more powerful and will beat the A200 in performance in all tests), and more about what users can expect and how to choose for their given needs. The A300 put up some impressive numbers highlights include random 4K peak performances of 635K IOPS read and nearly 209K IOPS write. For 64K sequential, the array hit 5.71GB/s read and 3.1GB/s write. For our SQL benchmarks the A300 was able to get close to 490K IOPS, 416K IOPS for SQL 90-10, 361K IOPS for SQL 80-20. The Oracle results being around 340K IOPS, 418K IOPS for Oracle 90-10, and 362K IOPS for Oracle80-20.
In our reviews, we rarely compare units against each other, but in this case, the A200 to A300 comparison is appropriate if for nothing else to confirm what NetApp claims about the performance jump between the two systems. Where the A200 (and subsequently the A220) is great for smaller operations or perhaps even some ROBO scenarios, the A300 takes a big jump forward in terms of overall performance capabilities and is suitable for larger organizations with a lot of mixed workloads or perhaps for someone like a regional managed services provider. In the end, the A300 is quite similar to the A200, it’s just more in terms of scalability, IO port flexibility and overall performance. The NetApp A300 continues on where the A200 leaves off, making it another favorite in our lab and ultimately another great execution for NetApp’s ONTAP storage portfolio.

Sign up for the StorageReview newsletter