Power consumption is front of mind when it comes to designing, building, and running a datacenter. Not only does power usage eat into IT operations budgets, there are many other influences power consumption has as a larger part of the IT infrastructure. The StorageReview lab is no different. Not only does our testing at times draw huge amounts of power (think the Griswold household when the Christmas lights went on in Christmas Vacation) but we want to know how much power everything we plug in draws. If we test a storage device that out performs all other in a given segment, it is nice to point out if it draws more power than Godzilla’s atomic breath, putting a more complete cost of ownership profile together.
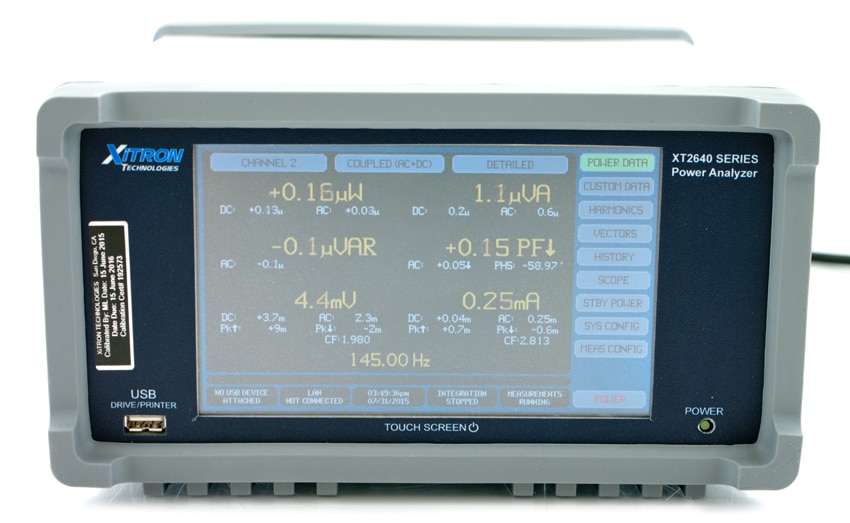
While we have measured power efficiency tests in the past, we recently obtained a Xitron XT2640 Precision Multi-Channel Power Analyzer. The XT2640 is a standalone power analyzer, though there is software available that enables better data collection. The XT2640 is three virtual power analyzers, channels, in one that share one chassis and one interface. Users can install up to 4 channels with any combination of channel cards and input options. Users can configure channels of each of the three power analyzers and each analyzer can be configured up to all channels installed. While each channel is independent of one another (configured for multi-channel wiring configuration, signal filtering, default measurement coupling, display results smoothing and significant digits, VA/VAR combine method, and efficiency grouping) they can also be configured to synchronize with each other.

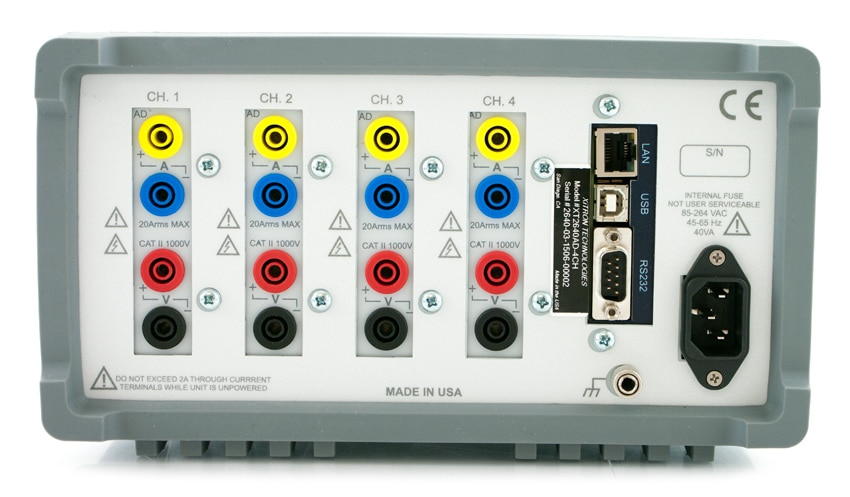
In our configuration the Xitron XT2640 Power Analyzer is set up with four 20A channels, which we make use of for power AC and DC power testing. The primary usecases break down into the following segments:
- SSD/HDD: 5v and 12v volt/amp monitoring
- PCIe: 3.3v, 5v and 12v volt/amp monitoring
- Server: 120-240v volt/amp monitoring of up to 4 PSUs
- Clustered Servers: 120-240v volt/amp monitoring up to four systems, 1 PSU each
- Rack-Scale: 240v volt/amp monitoring up to 20A of current, in-line to PDU
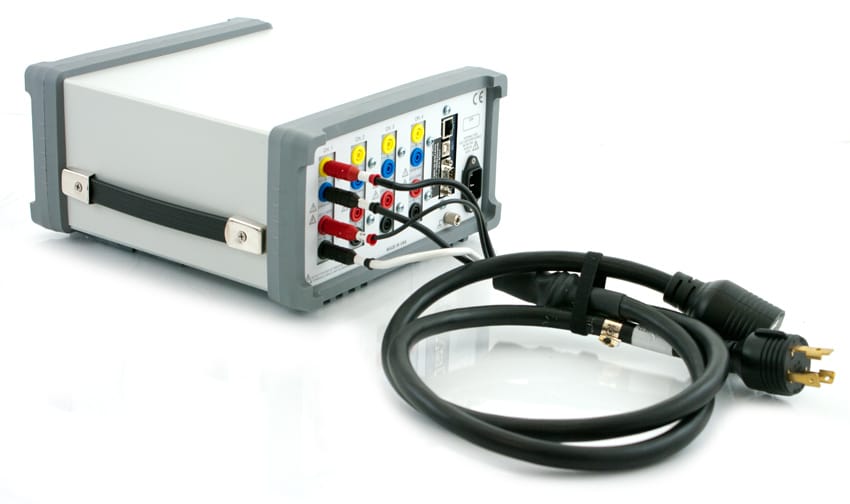
Obviously with 4 channels of recording capabilities, we can get creative with measuring individual SSDs or HDDs through their 5v and 12v leads, while also measuring the 120-240v input for the system itself. A key strength of our upcoming testing methodology though is the unit carries a valid industry calibration, and will receive ongoing calibration to keep it accurate as time goes on.
Benefits include:
- History Displays
- Vector Diagrams
- Signal Waveform Displays
- Harmonics Displays With Limits
- Custom Data Displays
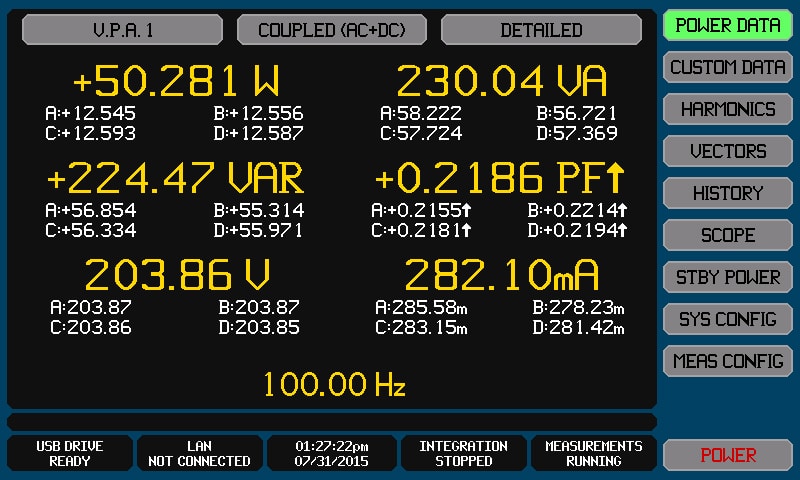
Showing off 4 channel monitoring capabilities, we connected the analyzer inline with a hybrid VMware Virtual SAN configuration running on four Dell PowerEdge R730xds. Here we can see the power info with the servers turned off, drawing roughly 12.5 watts per server. This is viewing the calm before the storm, prior to starting up the cluster.
In the next screenshot we are looking at the data history across the four channels, each monitoring one server.
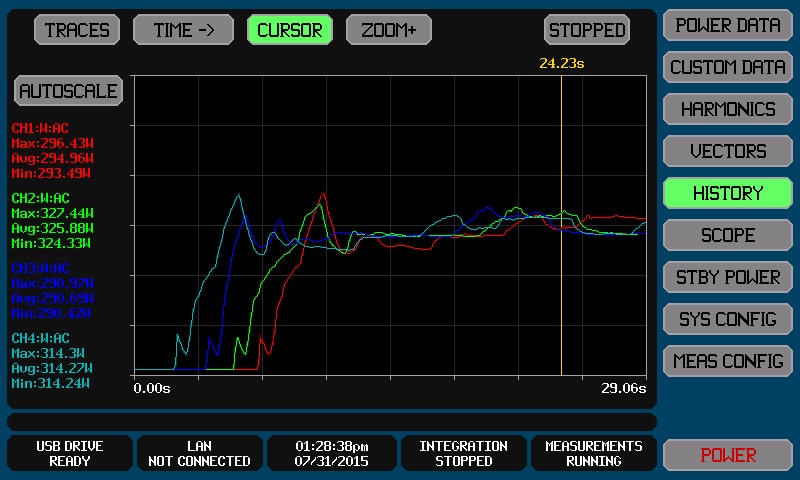
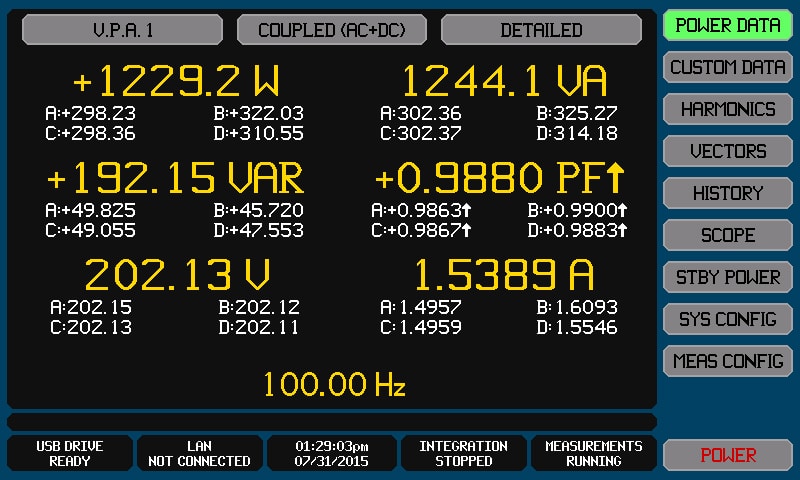
One the platform was moving past its startup activitys, we switch back to the power data screen, looking at the aggregate power usage through the VPA feature.
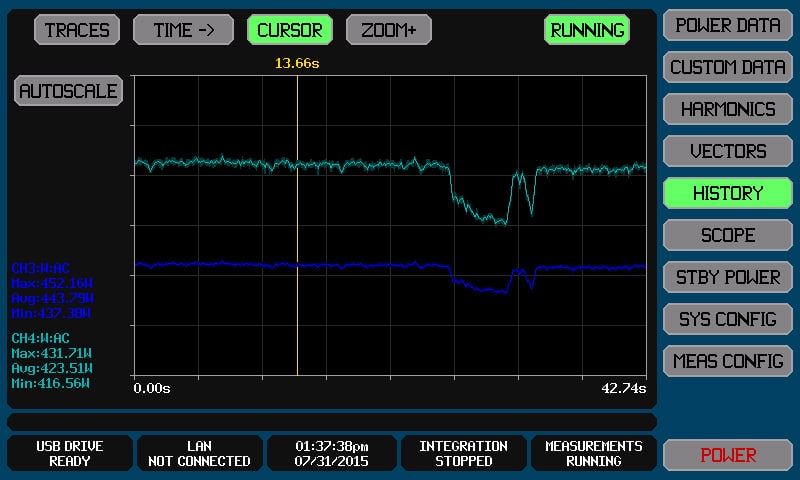
We can also look at the power consumption history of a specific device and test. In the next example we are looking at an EchoStreams GridStreams 4-node cluster (dual power supplies) running a MarkLogic NoSQL Test. Here we can see the real-time power usage during the time we were capturing data.
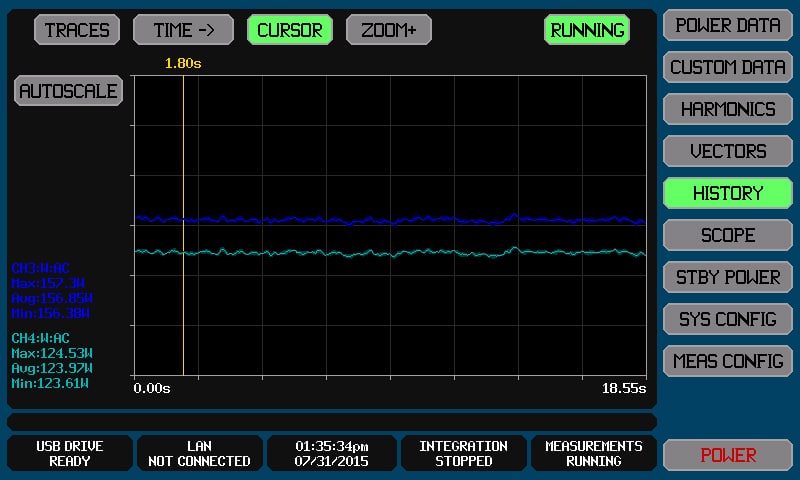
In a similar light we turned out view to an HP DL360 Gen9 server in the lab, running a SQL Server TPC-C test on some upcoming SAS3 SSDs.
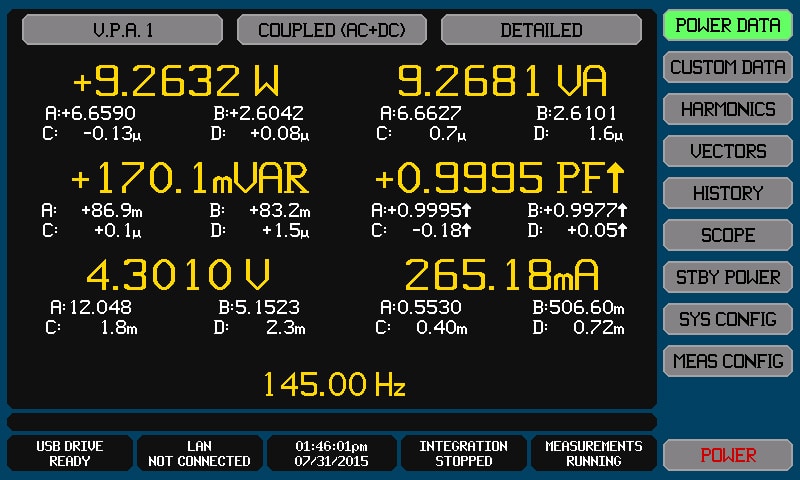
Aside from testing larger devices like arrays and servers, we can also look at power consumption of something small like hard drives. The next example is of the power info of a 3.5" hard drive in idle. In this case we see channel A (12v) measuring 6.6590W while channel B (5v) measures only 2.6042W, for a total of 9.2632W.
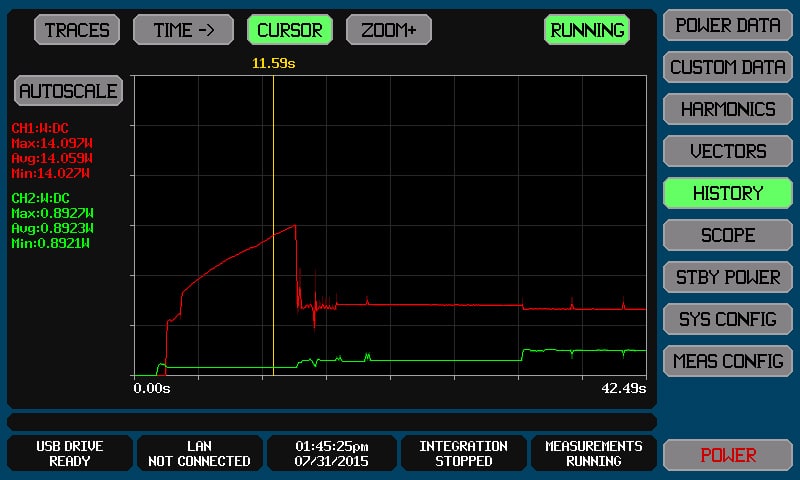
In our next example we look at that same drive through its spin-up process, getting to its 7200RPM rotational speed.
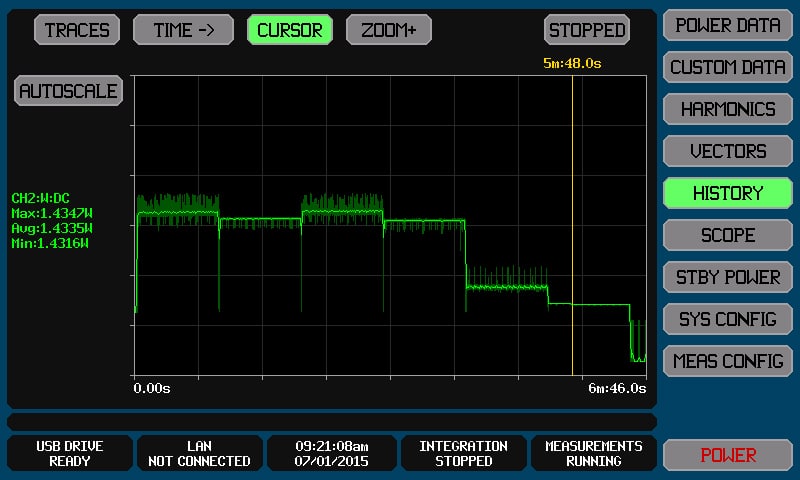
We can also look at specific tests, read/write in this case, ran on smaller devices like the Samsung PRO 850 SSD.
There remains a good deal of work to standardize on best practices for power testing individual components all the way through small clusters. The Xitron hardware is a great start however, and our industry partners are already piling in with ideas to develop repeatable, industry standard metrics. Expect to see a deeper dive into energy consumption from an application perspective as the StorageReview lab endeavors to drive the TCO conversation in enterprise IT.


 Amazon