The OCZ Talos 2 R is a 2.5" form factor enterprise-class SSD that ranges in raw capacity up to nearly 1TB and features a SAS interface with dual-port support as well as cost-effective MLC NAND. The Talos 2 R also features OCZ’s Virtualized Controller Architecture (VCA) 2.0 that ties together a pair of SandForce flash controllers to deliver performance and capacity enhancements. This much makes the Talos 2 R similar to its sibling OCZ Talos 2 C that we recently reviewed. However, the Talos 2 R differentiates itself from the Talos 2 C by tacking on power fail protection to protect in-flight data from unexpected power loss, an upgraded controller and additional over-provisioning at 28% versus 7% on the Talos 2 C.
Another major difference between the Talos 2 R and Talos 2 C is their MTBF rating. The Talos 2 R has a MTBF of 2 million hours, while the Talos 2 C has a MTBF of 1 million hours. The rating for the C model is more aligned with its value-play in the SAS market, while the R model features a mark closer to the higher-end of the industry standard. Both drives also feature MLC NAND for solid endurance that still maintains affordability. For those that require a Talos 2 in some other configuration, OCZ is happy to customize drives for organizations with either eMLC or SLC NAND.
As we mentioned in our review of the OCZ Talos 2 C, SAS-based SSDs are often promoted as enterprise-prepared drives that can handle just about any application. OCZ claims solid performance with read bandwidth up to 550MB/s and write bandwidth up to 375MB/s. Additionally, OCZ marks the OCZ Talos 2 R in a mixed 75/25 workload (read/write) at 54,000 IOPS 4k Random and 42,000 IOPS 8k random. This performance is aided by the SAS interface which allows for greater performance compared to SATA drives. Adding to that, the Talos 2 R is dual-ported for HA access that SATA also lacks.
The OCZ Talos 2 R is available now in 200GB, 400GB and 800 GB capacities with a three-year warranty rated at at least 1 drive write per day.
OCZ Talos 2 R Specifications
- Capacities
- 200GB (TL2RSAK2G2M1X-0200)
- 400GB (TL2RSAK2G2M1X-0400)
- 800GB (TL2RSAK2G2M1X-0800)
- Read Bandwidth up to 550 MB/s
- Write Bandwidth up to 375 MB/s
- Random Operations (4kB): 70,000 IOPS (read); 35,000 IOPS (write)
- Mixed Workload (75% R; 25% W): 54,000 IOPS (4kB random); 42,000 IOPS (8kB random)
- Synchronous Mode Multi-Level Cell (MLC) NAND
- Interface Dual-Port SAS 6.0 Gb/s (Full Duplex/Active-Active)
- 2.5" Form Factor
- Dimensions (L x W x H) 100.0 x 69.85 x 14.5 mm
- Weight 155g (may vary slightly due to capacity)
- Power Consumption Idle: 5.1 Watts; Active: 7.4 Watts
- Operating Temperature 0°C ~ 55°C
- MTBF: 2 million hours
- Data Fail Recovery Recovers data from up to one NAND flash block per NAND controller
- Data Path Protection ECC: Up to 55 bits correctable per 512-byte sector; Data path parity protection
- Data Reliability Read Unrecoverable Bit Error Rate (UBER): 1017
- Data Encryption 128-bit AES-compliant
- Product Health Monitoring Self-Monitoring, Analysis and Reporting Technology (SMART) Support with enterprise attributes
- Operating Systems: Windows: XP, Vista, 7, Server 2008 R2 / Linux
Video Overview
Design and Build
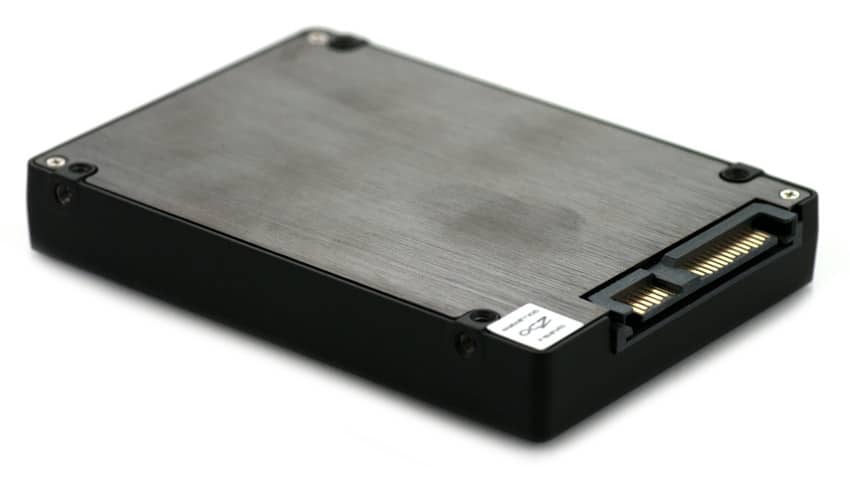
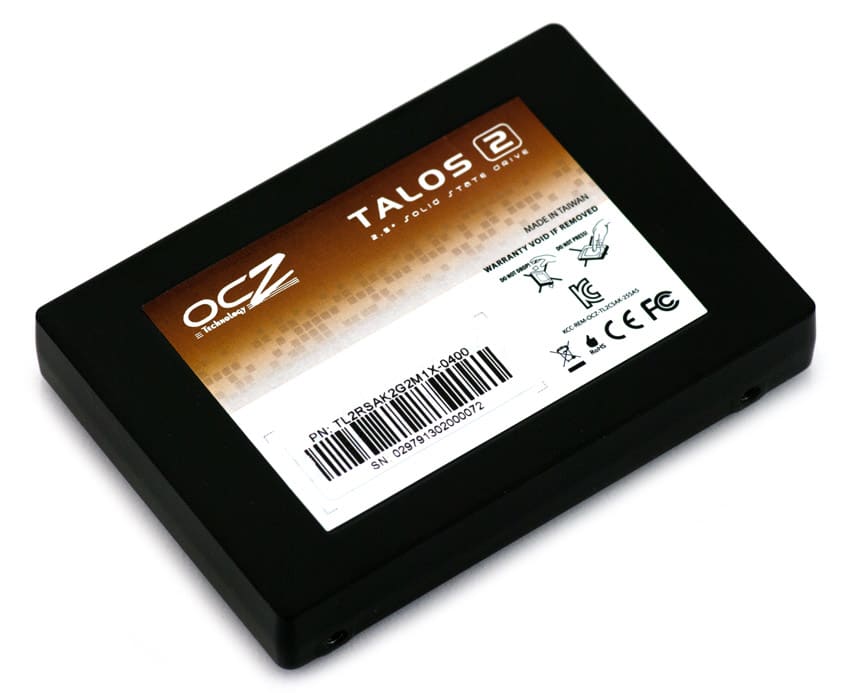
The OCZ Talos 2 R, just as the Talos 2 C, has a 2.5" form factor and is offered in a 14.5mm z-height – fairly standard for the SAS market. The build is sturdy and features an all-black case. The top of the case features an OCZ Talos 2 sticker with the relevant branding. The side profiles present the screw holes that enable the drive to be mounted securely. Rounding out the exterior, the bottom of the drive houses the product label with drive information.
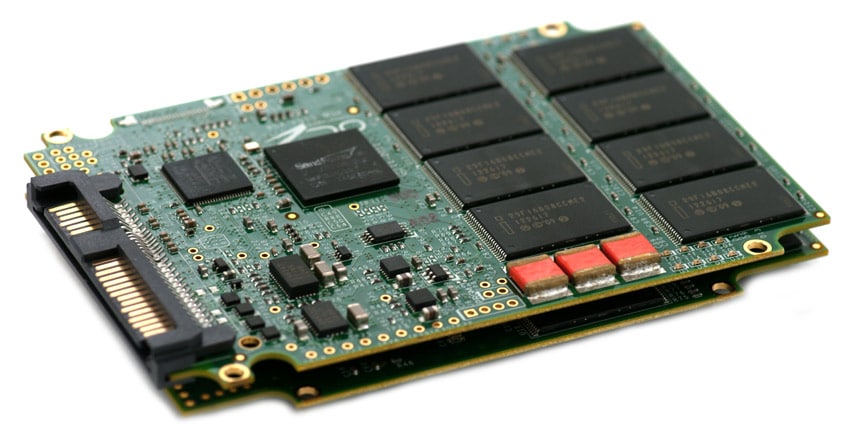
With both circuit boards outside of the case, you can see both SandForce 2500 controllers. These two SF-2500 controllers are linked together through the OCZ VCA that bridges the two SandForce controllers and presents them on the SAS interface. Our review model Talos 2 R 400GB also has 32 NAND packages at 16GB each.
The Talos 2 R goes beyond the C model with OCZ offering power-fail protection by implementing capacitors.
Testing Background and Comparables
The OCZ Talos 2 R uses two SandForce SF-2500 controllers and Intel 25nm MLC NAND with a SAS 6.0Gb/s interface.
Comparables for this review:
- OCZ Talos 2 C (480GB, two SandForce SF-2282 controllers, Intel 25nm MLC NAND, 6.0Gb/s SAS)
- Hitachi SSD400M (400GB, Intel EW29AA31AA1 controller, Intel 25nm eMLC NAND, 6.0Gb/s SAS)
- Smart Optimus (400GB, third-party controller, Toshiba 34nm MLC NAND, 6.0Gb/s SAS)
- STEC s842 (s840 series) (800GB, STEC 24950-15555-XC1 controller, Toshiba MLC NAND, 6.0Gb/s SAS)
All SAS/SATA enterprise SSDs are benchmarked on our second-generation enterprise testing platform based on a Lenovo ThinkServer RD630. This new Linux-based testing platform includes the latest interconnect hardware such as the LSI 9207-8i HBA as well as I/O scheduling optimizations geared towards best-case flash performance. For synthetic benchmarks, we utilize FIO version 2.0.10 for Linux and version 2.0.12.2 for Windows.
- 2 x Intel Xeon E5-2620 (2.0GHz, 15MB Cache, 6-cores)
- Intel C602 Chipset
- Memory – 16GB (2 x 8GB) 1333Mhz DDR3 Registered RDIMMs
- Windows Server 2008 R2 SP1 64-bit, Windows Server 2012 Standard, CentOS 6.3 64-Bit
- 100GB Micron RealSSD P400e Boot SSD
- LSI 9211-4i SAS/SATA 6.0Gb/s HBA (For boot SSDs)
- LSI 9207-8i SAS/SATA 6.0Gb/s HBA (For benchmarking SSDs or HDDs)
- Mellanox ConnectX-3 10GbE PCIe 3.0 Adapter
- Mellanox ConnectX-3 InfiniBand PCIe 3.0 Adapter
Application Performance Analysis
In the enterprise market there is a huge difference between how products claim to perform on paper and how they perform in a production environment. We understand the importance of evaluating storage as a component of larger systems, most importantly how responsive storage is when interacting with key enterprise applications. To this end, we’ve rolled out our first application tests including our proprietary MarkLogic NoSQL Database Storage Benchmark and MySQL performance via SysBench.
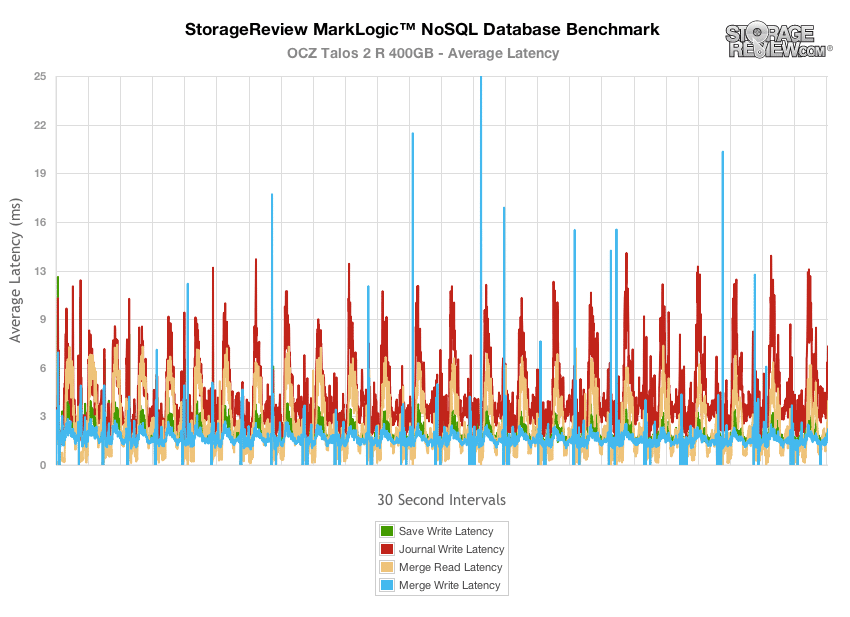
In our MarkLogic NoSQL Database environment, we test groups of four SATA or SAS SSDs with a usable capacity greater than or equal to 200GB. Our NoSQL database requires roughly 650GB of free space to work with, evenly divided between four database nodes. In our testing environment, we use an SCST host and present each individual SSD in JBOD, with one allocated per database node. The test repeats itself over 24 intervals, requiring between 30-36 hours total for the SSDs in this category. Measuring the internal latencies seen by the MarkLogic software, we record both total average latency, as well as interval latency for each SSD.
In our MLC SAS SSD group the Talos 2 R came in below the Smart Optimus and Hitachi SSD400M in our overall average latency ranking, with an average response time of 2.622ms, closely trailing the SSD400M.
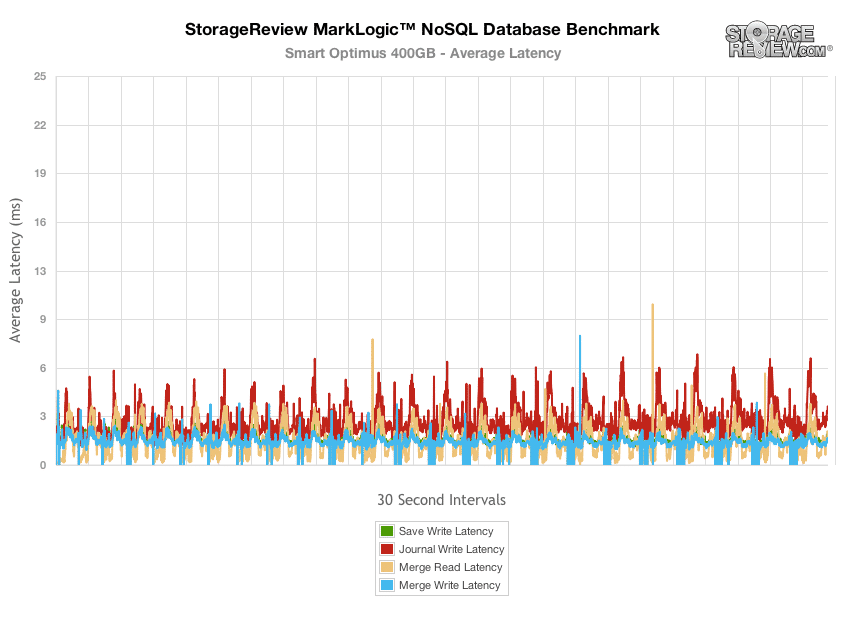
The Smart Optimus offered the lowest latency in the MLC SAS group, with peaks ranging in the 6-11ms range.
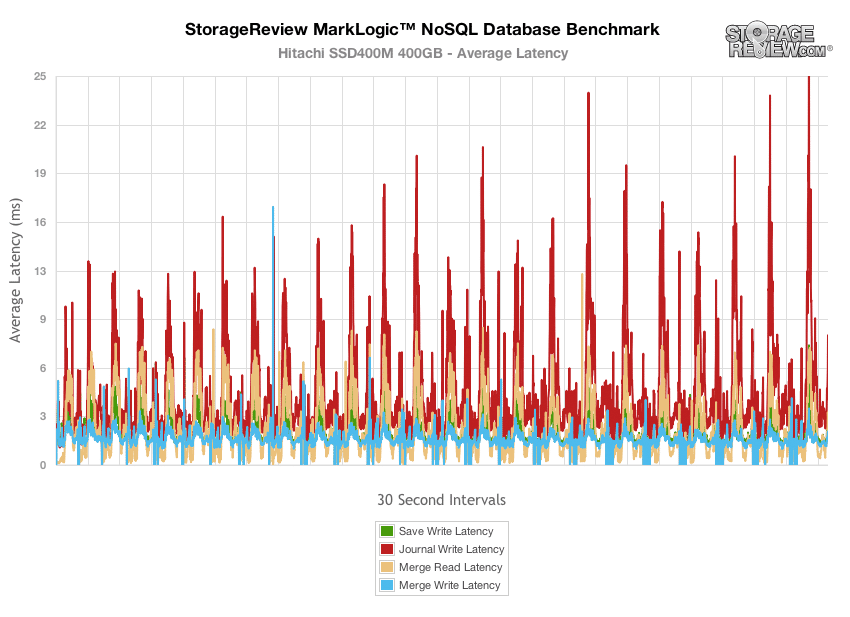
The 400GB Hitachi SSD400M came in next in our MarkLogic latency measurements, with higher latency peaks, measuring between 10-25ms with the bulk coming from journal write latency.
The OCZ Talos 2 R closely trailed the SSD400M, with its peak latency measuring between 9-32ms, with its highest peaks coming from merge write activities.
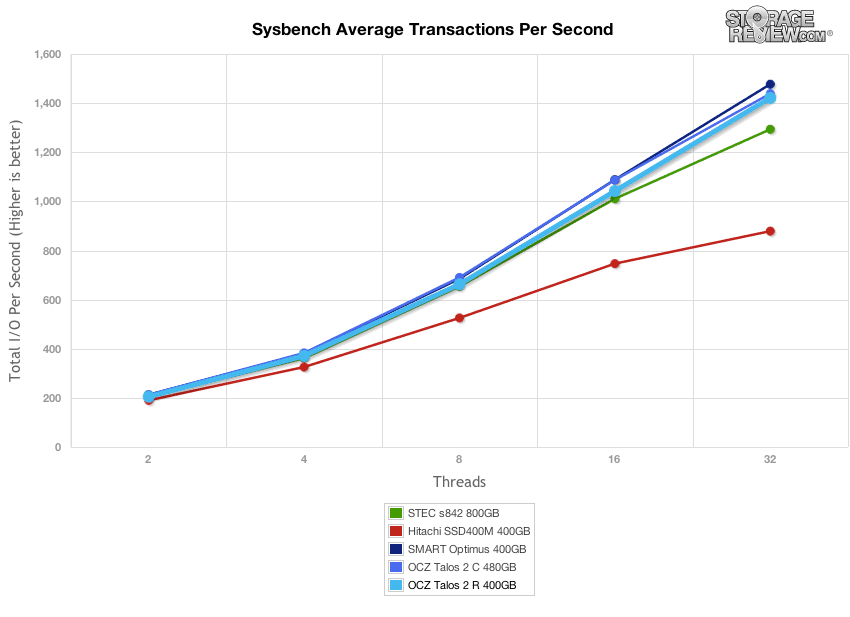
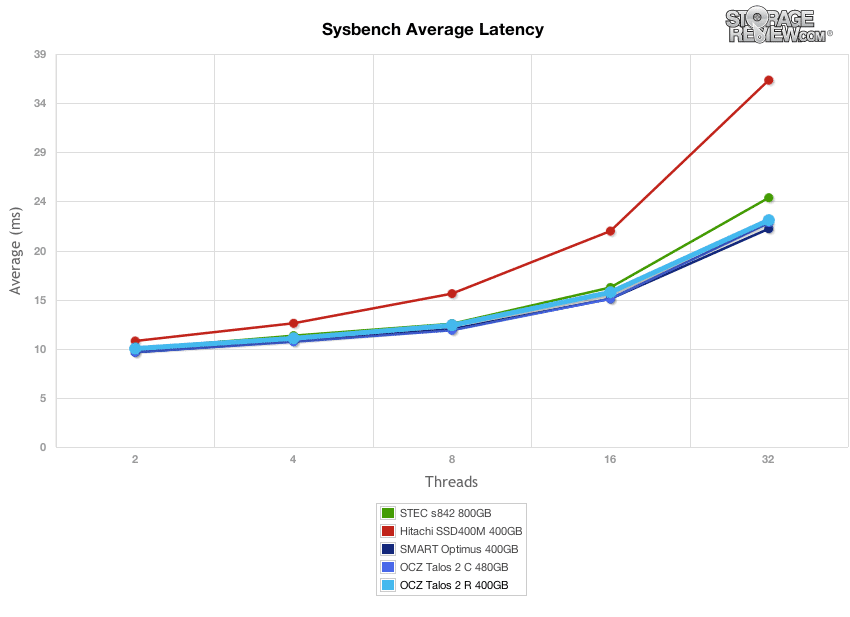
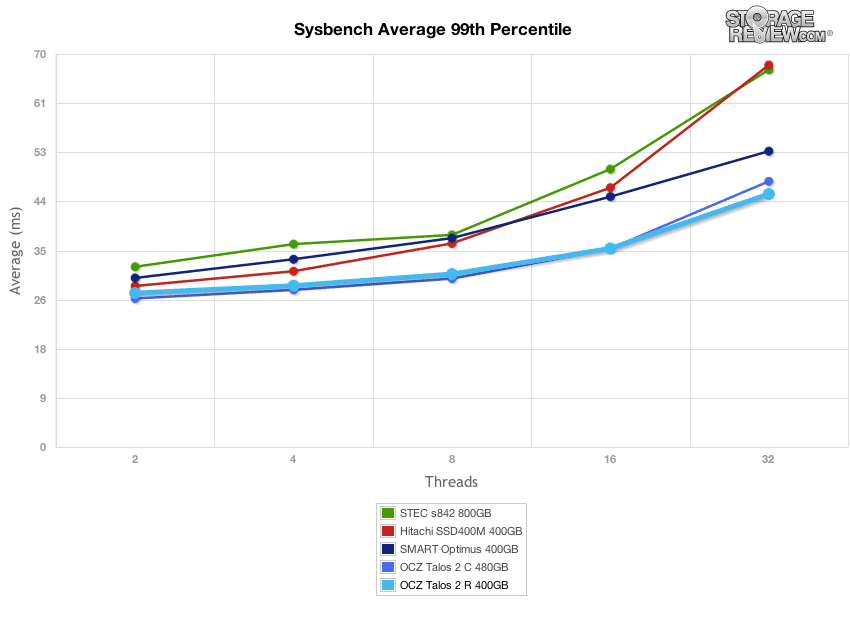
Our next application test consists of Percona MySQL database test via SysBench, which measures the performance of OLTP activity. In this testing configuration, we use a group of Lenovo ThinkServer RD630s and load a database environment onto a single SATA, SAS or PCIe drive. This test measures average TPS (Transactions Per Second), average latency, as well as average 99th percentile latency over a range of 2 to 32 threads.
Comparing average TPS in our MLC SAS group, the OCZ Talos 2 R came in 3rd place, closely trailing the 480GB Talos 2 C as well as the Smart Optimus. The performance of the Talos 2 R scaled from 204 TPS at 2 threads up to 1421 TPS at 32 threads.
Comparing average latency over the course of 1 hour test segments, we measured the average latency of the OCZ Talos 2 R to range from 9.77ms at 2 threads up to 22.51ms at 32 threads.
Drilling into lowest overall 99th percentile latency, the OCZ Talos 2 R and Talos 2 C offered the best response times in the pack, measuring between 22 to 45ms over the range of thread-counts.
Enterprise Synthetic Workload Analysis
Flash performance varies throughout the preconditioning phase of each storage device. Our synthetic enterprise storage benchmark process begins with an analysis of the way the drive performs during a thorough preconditioning phase. Each of the comparable drives are secure erased using the vendor’s tools, preconditioned into steady-state with the same workload the device will be tested with under a heavy load of 16 threads with an outstanding queue of 16 per thread, and then tested in set intervals in multiple thread/queue depth profiles to show performance under light and heavy usage.
Preconditioning and Primary Steady-State Tests:
- Throughput (Read+Write IOPS Aggregate)
- Average Latency (Read+Write Latency Averaged Together)
- Max Latency (Peak Read or Write Latency)
- Latency Standard Deviation (Read+Write Standard Deviation Averaged Together)
Our Enterprise Synthetic Workload Analysis includes four profiles based on real-world tasks. These profiles have been developed to make it easier to compare to our past benchmarks as well as widely-published values such as max 4k read and write speed and 8k 70/30, which is commonly used for enterprise drives. We also included two legacy mixed workloads, the traditional File Server and Webserver, each offering a wide mix of transfer sizes.
- 4k
- 100% Read or 100% Write
- 100% 4k
- 8k 70/30
- 70% Read, 30% Write
- 100% 8k
- File Server
- 80% Read, 20% Write
- 10% 512b, 5% 1k, 5% 2k, 60% 4k, 2% 8k, 4% 16k, 4% 32k, 10% 64k
- Webserver
- 100% Read
- 22% 512b, 15% 1k, 8% 2k, 23% 4k, 15% 8k, 2% 16k, 6% 32k, 7% 64k, 1% 128k, 1% 512k
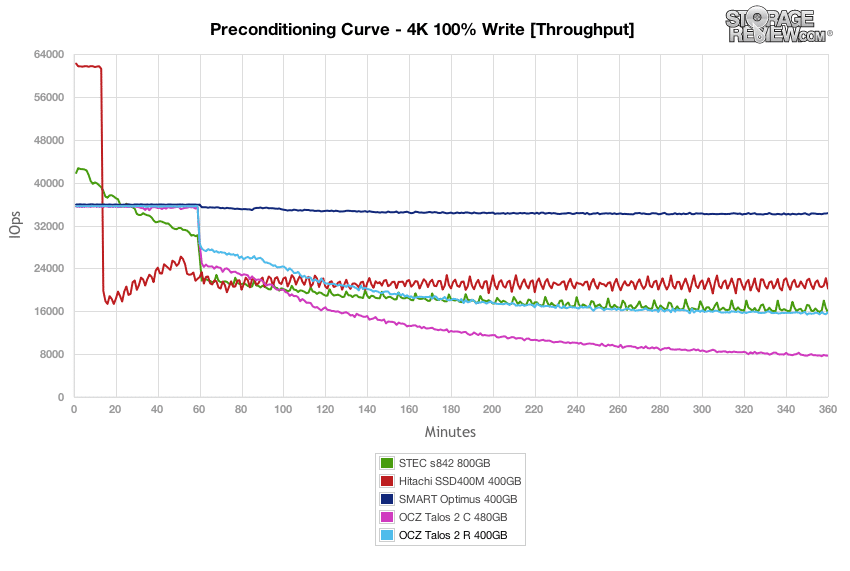
Our first test measures 100% 4k random write performance with a load of 16T/16Q. In this setting, the burst performance of the OCZ Talos 2 R tested at 35,500 IOPS, which later leveled off around 15,500 IOPS as the drive neared steady-state. This was below the rest of the group aside from the Talos 2 C.
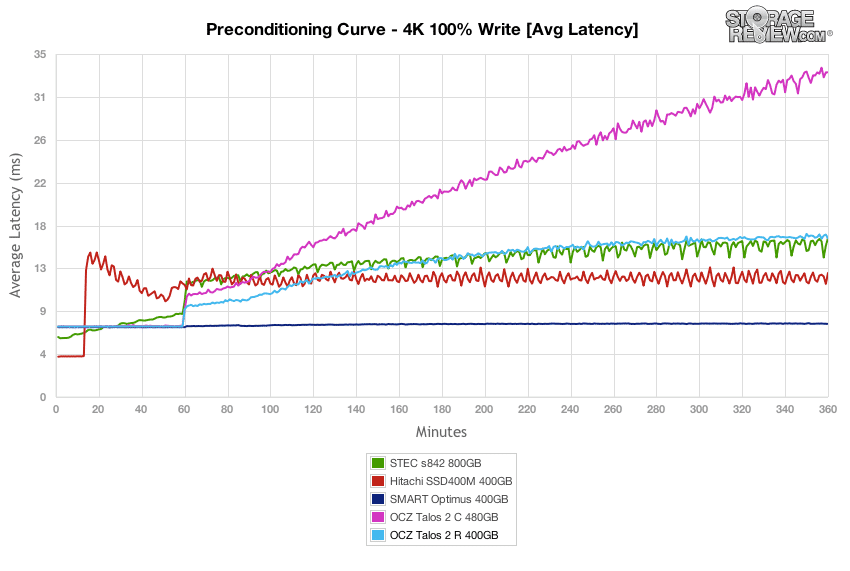
With a heavy 16T/16Q load, the OCZ Talos 2 R measured 7.19ms in burst and scaled up to 16.16ms as it neared steady-state. This placed the Talos 2 R near the middle of the group.
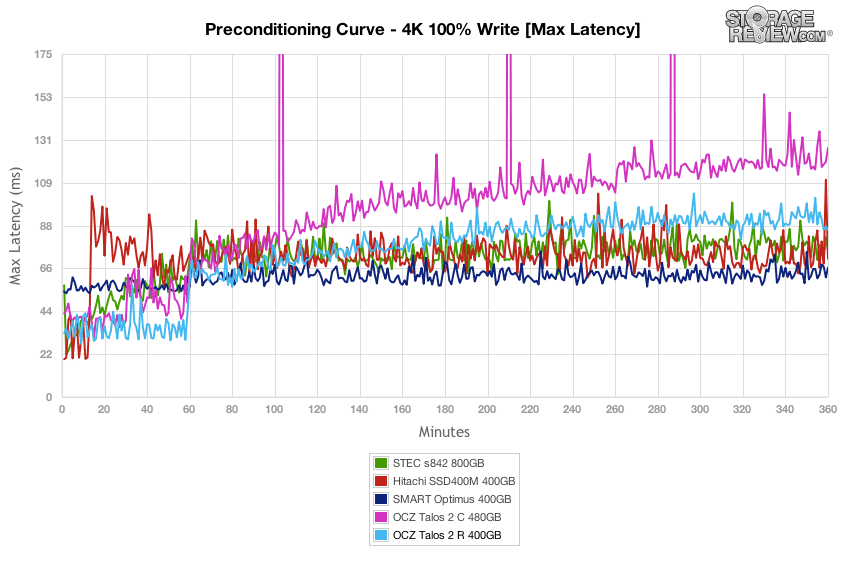
Comparing max latency between the SSDs, the OCZ Talos 2 R had max response times ranging 60-90ms in steady-state – a figure near the other drives in the group.
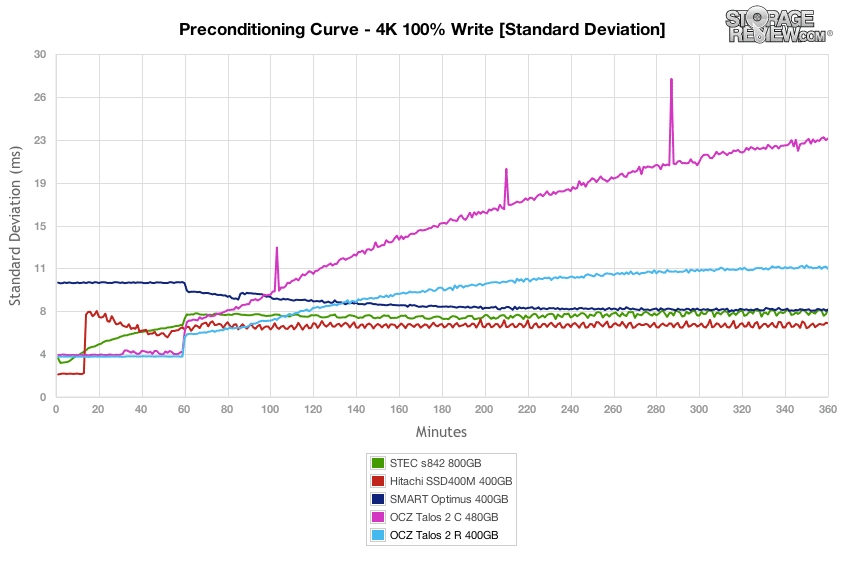
Looking even closer at the latency consistency in our 4k random write workload, the OCZ Talos 2 R only bested its sibling Talos 2 C.
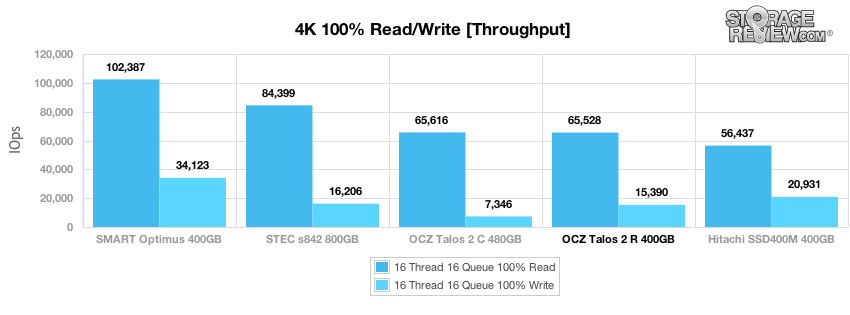
After 6 hours of preconditioning, the OCZ Talos 2 R offered 4k random read performance at 65,500 IOPS and write speed at 15,400 IOPS.
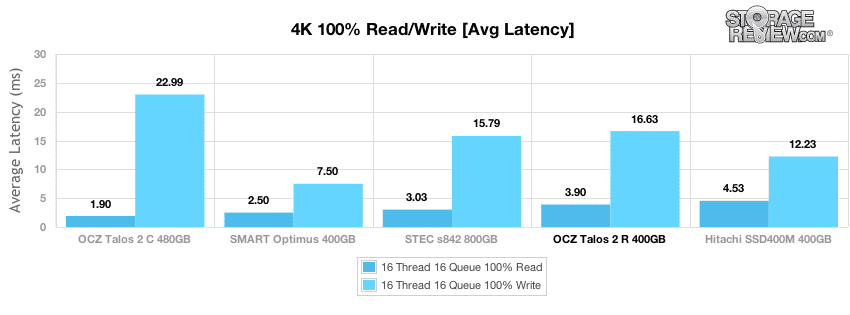
With a workload of 16T/16Q, the OCZ Talos 2 R offered an average 4k random read latency of 3.90ms, with a write latency of 16.63ms.
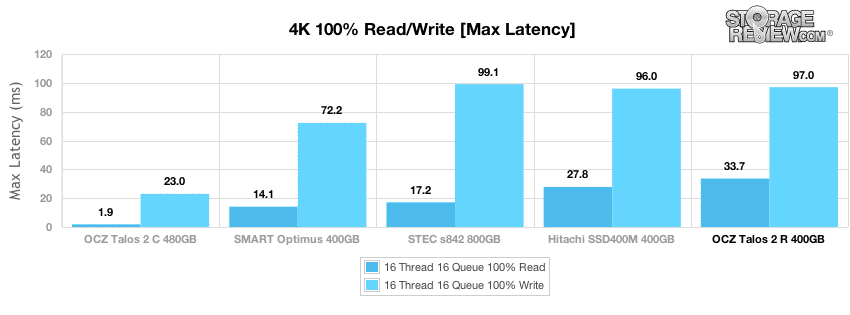
Max latency from the OCZ Talos 2 R was high for reads and average for writes in testing, measuring a peak read response time of 33.67ms and a peak write latency of 97ms.
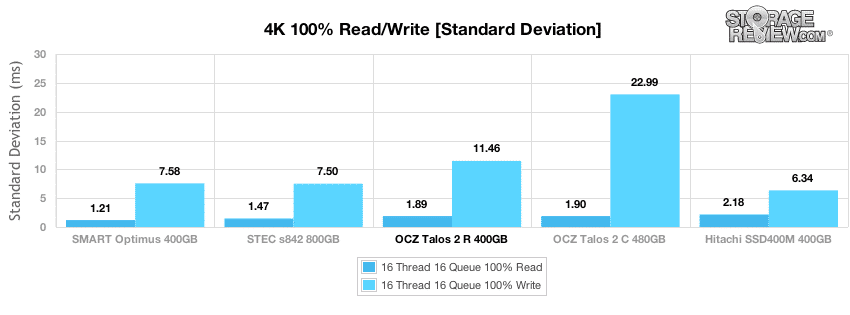
Comparing latency consistency, the OCZ Talos 2 R had average marks in 4k random read and write consistency.
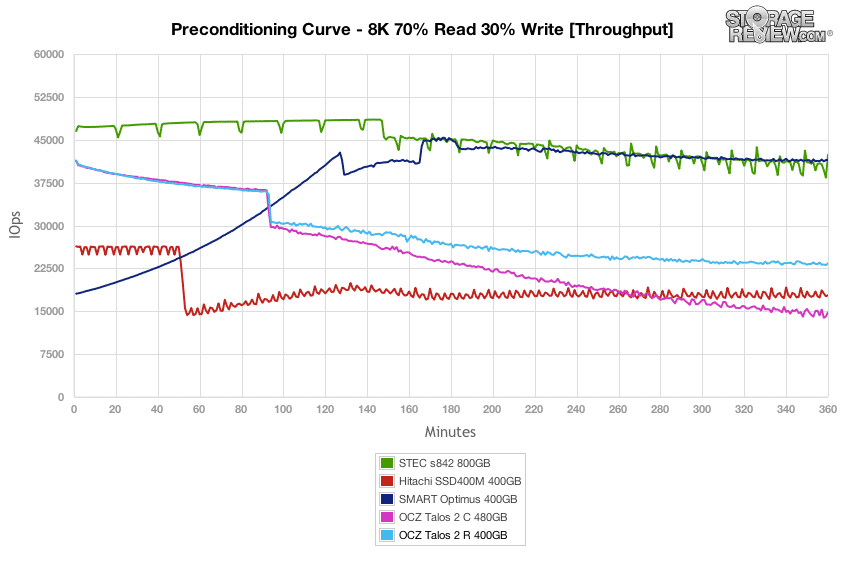
In our next workload we look at an 8k profile with a 70/30 read/write mixed ratio. In this setting, the OCZ Talos 2 R started off around 41,400 IOPS burst which slowed to a speed around 23,400 IOPS near steady-state. The burst performance was near the top, while the steady-state speed was closer to the middle of the group.
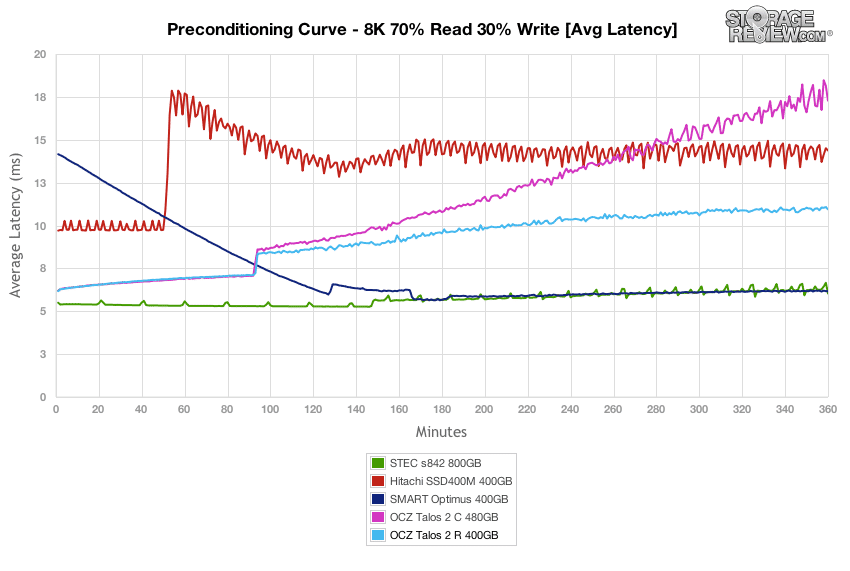
Average latency of the OCZ Talos 2 C measured 6.17ms at the beginning of our 8K 70/30 preconditioning test, which increased to around 11ms as it neared steady-state.
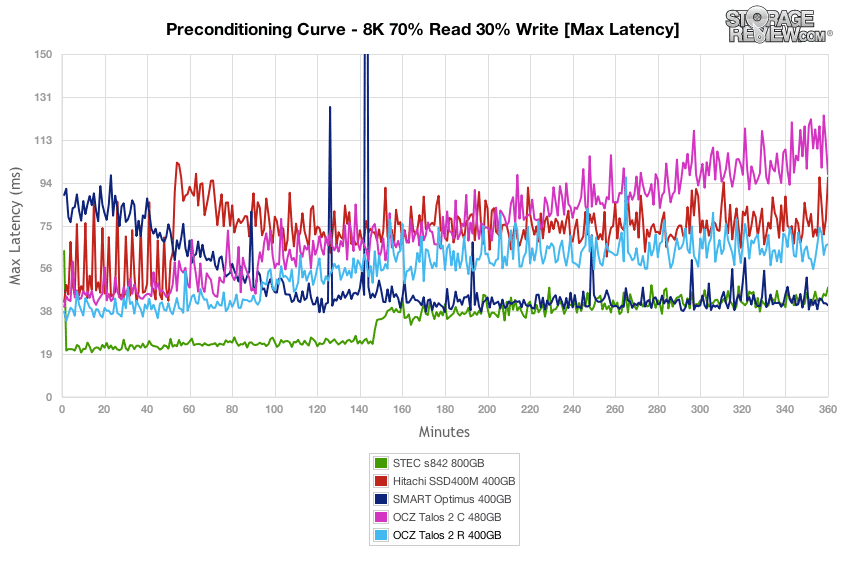
Over the duration of our 8K 70/30 test, the OCZ Talos 2 R offered average peak response times, with latency max measuring below 70ms for the duration of the test.
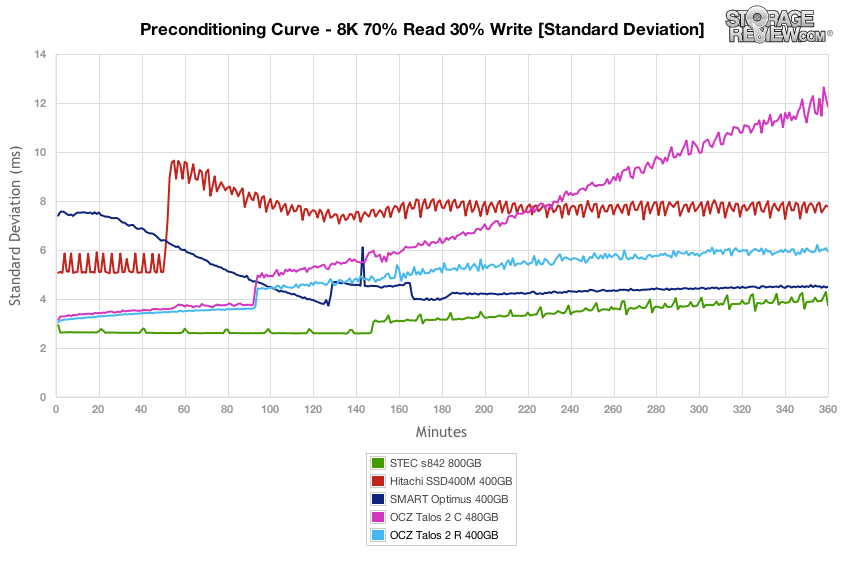
Latency consistency of the OCZ Talos 2 R stayed close to the Talos 2 C for the beginning of the test, though it stayed lower throughout the rest of the test, finishing near the middle of the group.
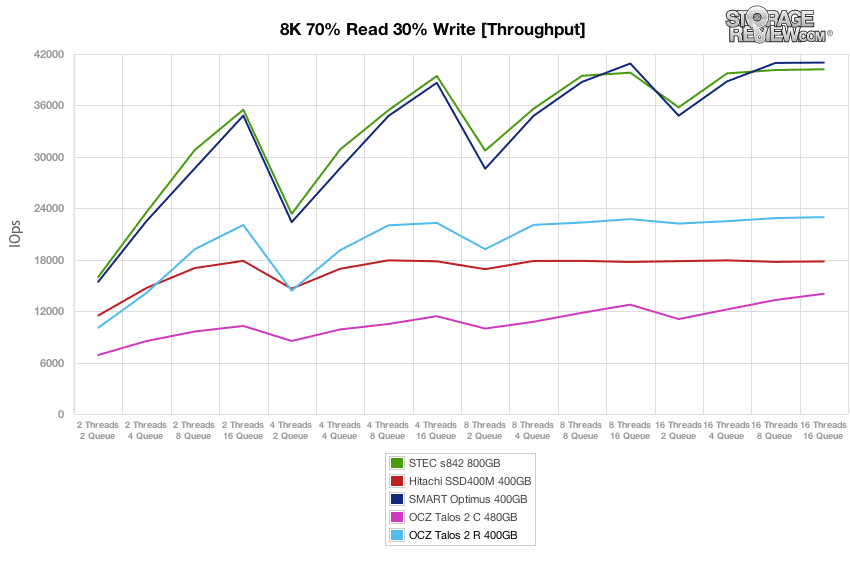
Compared to the fixed 16 thread, 16 queue max workload we performed in the 100% 4k write test, our mixed workload profiles scale the performance across a wide range of thread/queue combinations. In these tests, we span workload intensity from 2 threads and 2 queue up to 16 threads and 16 queue. In the expanded 8k 70/30 test, the OCZ Talos 2 R peaked at 22,971 IOPS with a workload of 16T/16Q, which was near the middle of the pack, but a ways out from the leaders’ marks.
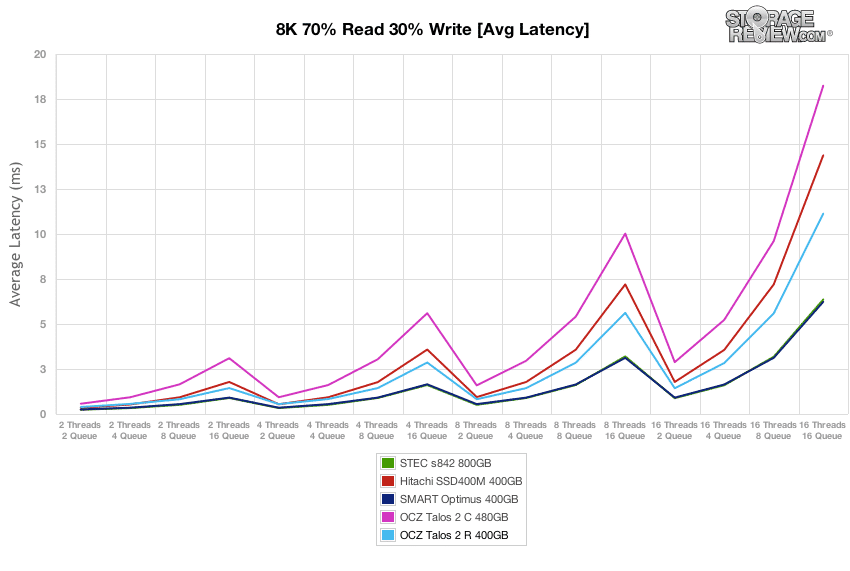
Average latency for the OCZ Talos 2 R was quite good, though it didn’t perform as well as the STEC s842 and Smart Optimus.
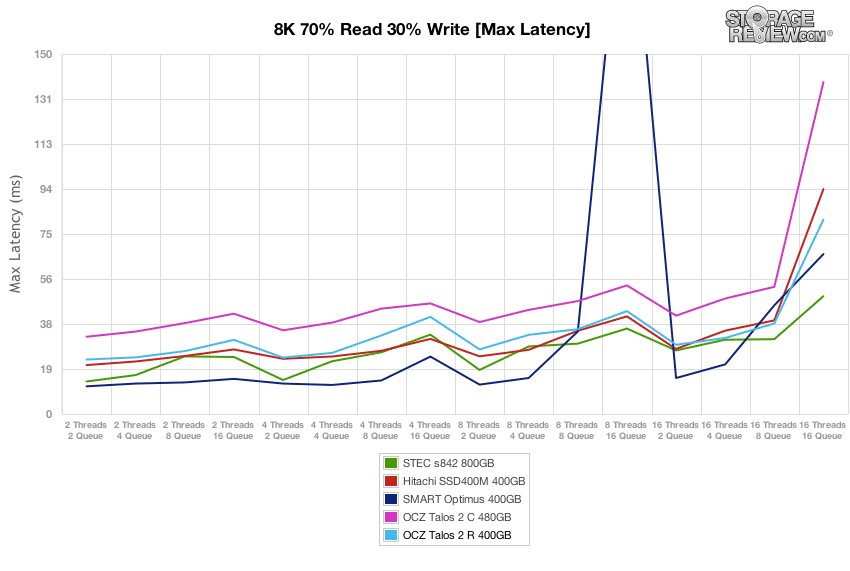
Over the duration of our varying load 8k 70/30 test, max latency stayed very low from the OCZ Talos 2 R, with the peak staying under 40ms for the bulk of the test, before edging up to around 80ms with the highest 16T/16Q load.
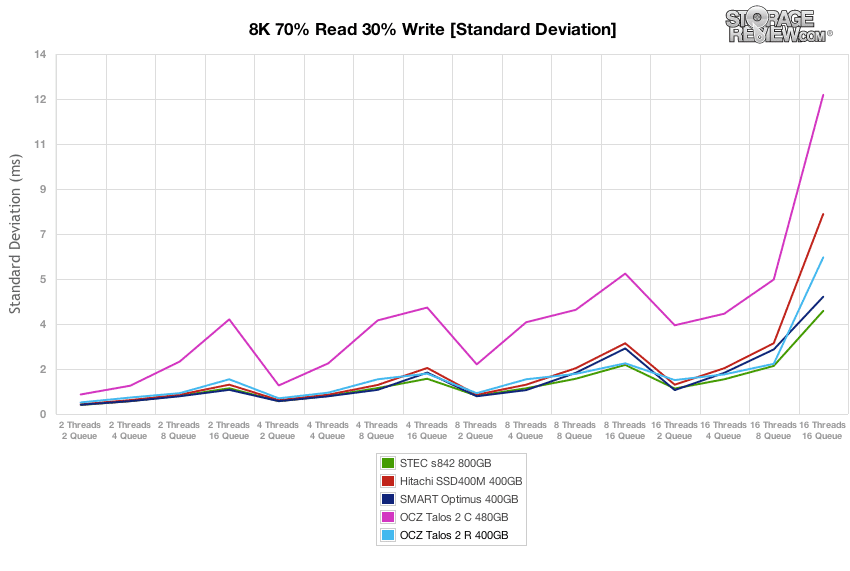
Standard deviation from the OCZ Talos 2 R in our test environment was quite good, though it peaked at the end just a bit more than the STEC s842 and Smart Optimus.
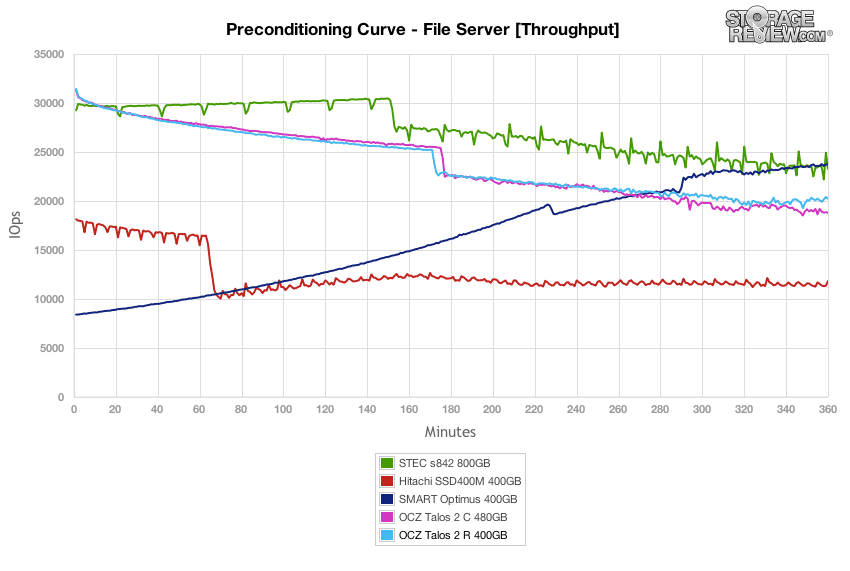
The next workload is our File Server profile, which covers a wide range of transfer sizes spanning from 512b to 512K. With a heavy 16T/16Q saturation load, the dual-controller OCZ Talos 2 R and C offered the highest peak performances, though the STEC s842 and Smart Optimus caught up mid-way through the test and offered greater performance in steady-state.
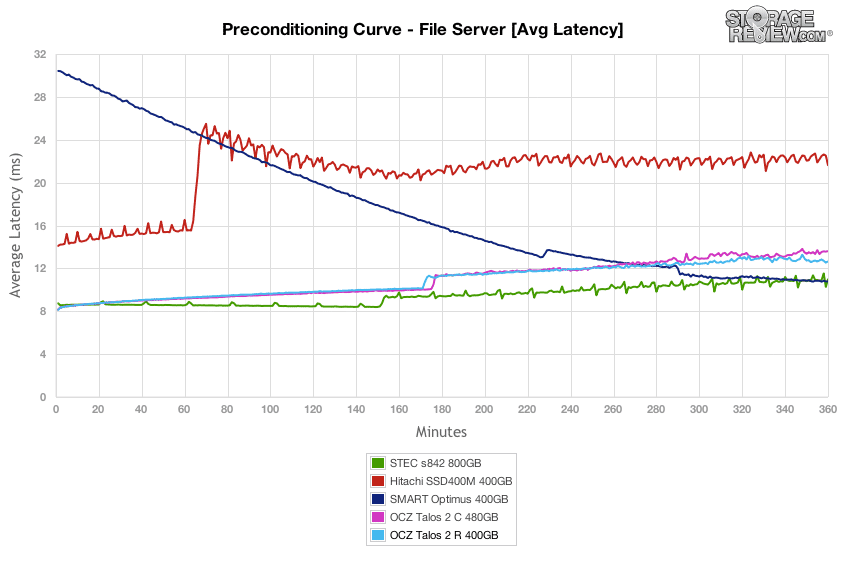
Average latency in the preconditioning section of our File Server test measured around 8.1ms during burst speeds and slowly increased to 11-13ms over the duration of the test.
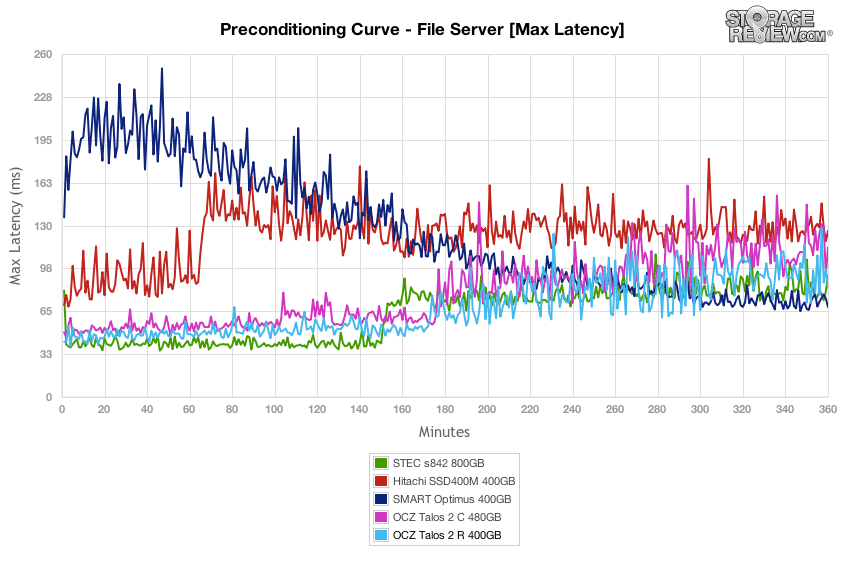
The OCZ Talos 2 R offered the max latency in our File Server preconditioning section around 40-50ms during burst conditions and remained under 100ms as it neared steady-state for the bulk of the test. The burst performance was the best, and the steady-state was edged out only by the Smart Optimus.
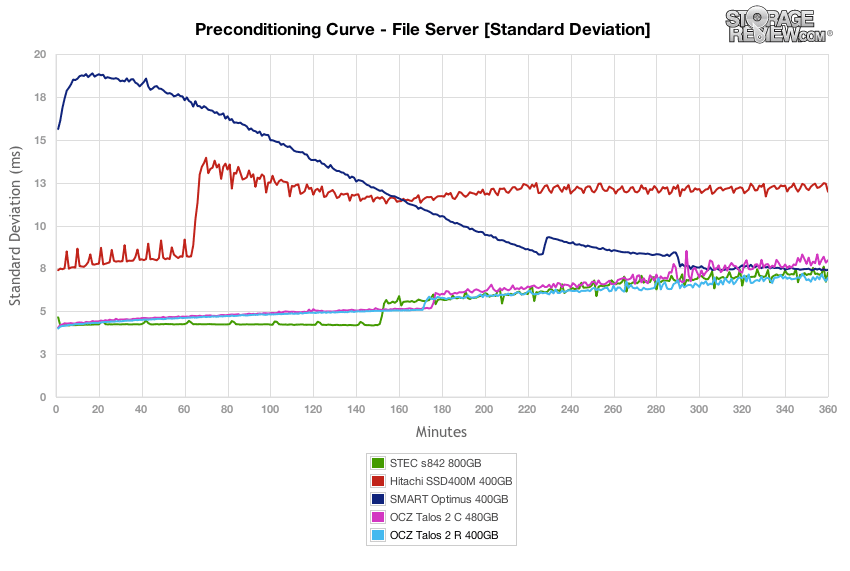
In terms of latency consistency, the OCZ Talos 2 R offered the best performance in our File Server test, coming in ahead of its sibling Talos 2 C by remaining just under 7ms.
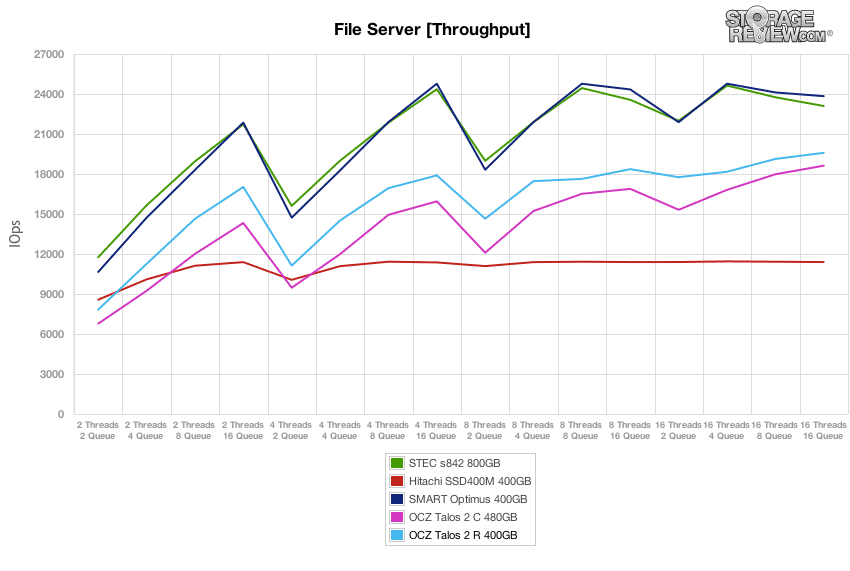
After each drive completed the preconditioning stage, we dropped into a varying workload where we scaled the thread and queue count from 2T/2Q up to 16T/16Q. The OCZ Talos 2 R performed near the middle of the group throughout the test, ending in the same position at the 16T/16Q load.
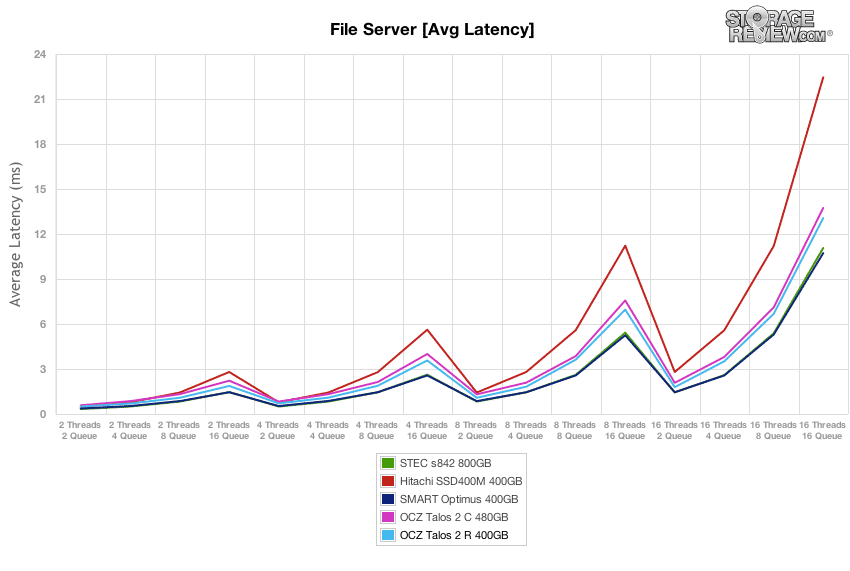
The OCZ Talos 2 R offered average latency ranking middle of the group throughout testing.
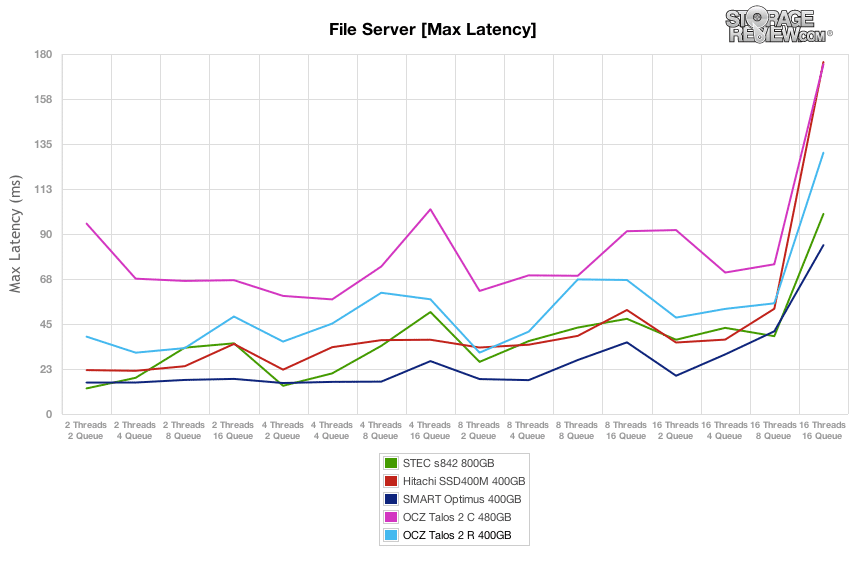
The max latency of the OCZ Talos 2 R in our File Server test stayed below 70ms for all loads below 16T/16Q, and then increased to 131ms for the highest load.
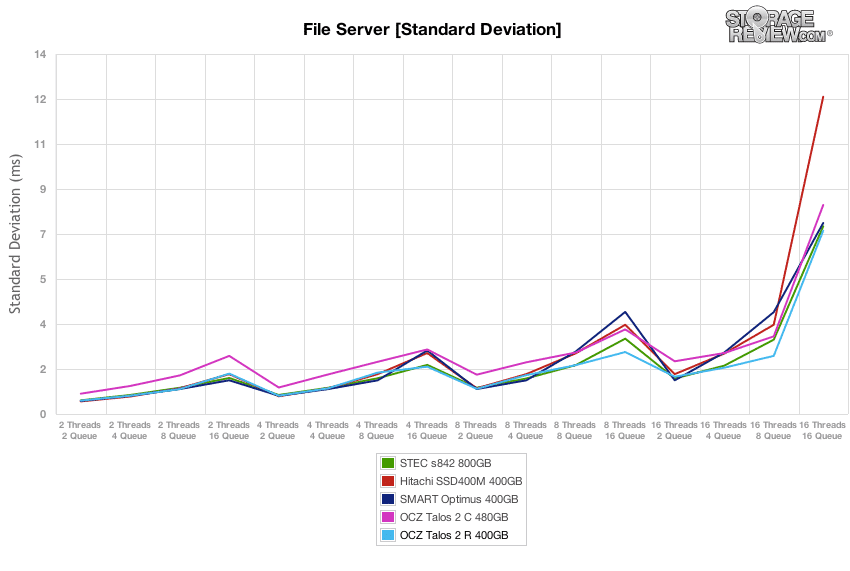
Standard deviation of the OCZ Talos 2 R was very consistent, staying roughly on par with the OCZ Talos 2 C, STEC s842 and Hitachi SSD400M. At the end, the win went to Talos 2 R at the highest 16T/16Q load.
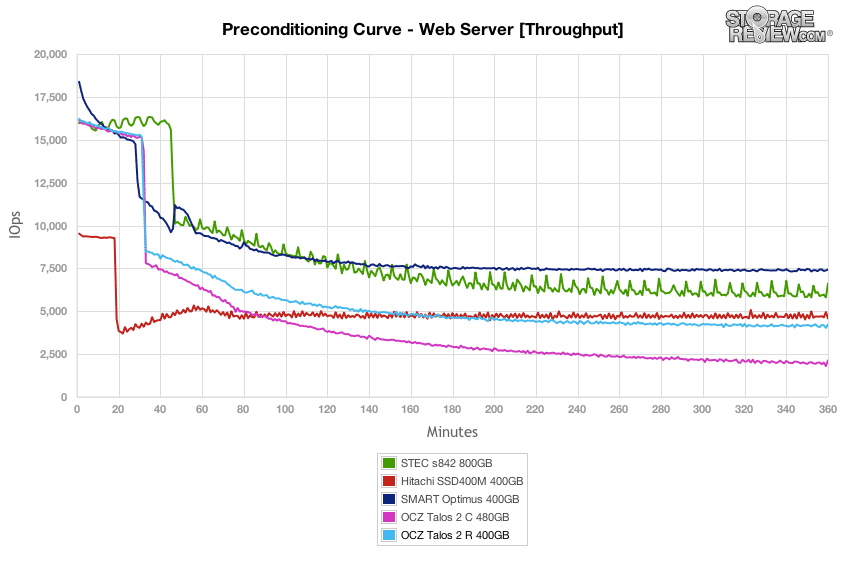
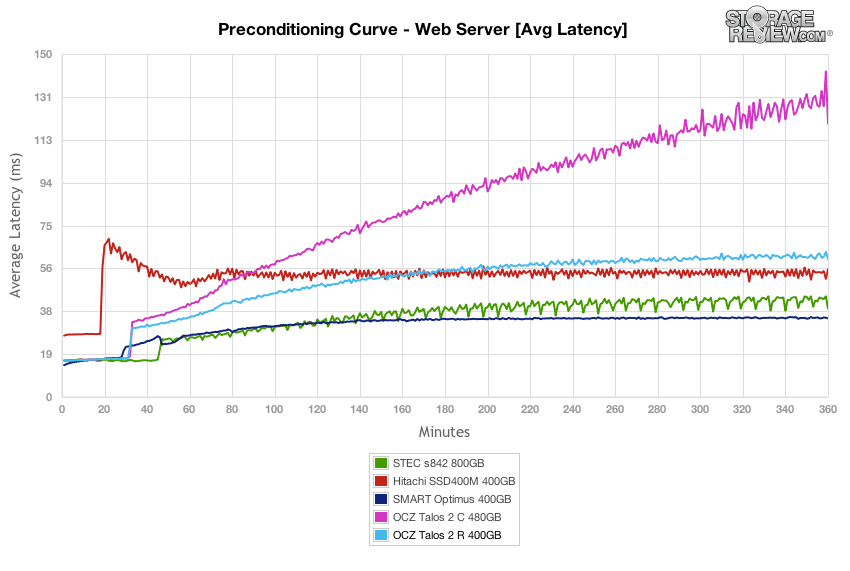
Our final preconditioning workload takes the traditional 100% read activity Web Server test and flips it to 100% write to precondition each SSD. This is our most aggressive workload, although it doesn’t really match any real-world conditions with 100% write. In this section the Talos 2 R started with the second highest burst workload at 16,220 IOPS, but tapered off to about 4,242 IOPS, second from the bottom.
The OCZ Talos 2 R started with a low response time that hit the middle of the group mark, but its response times fell to the back of the group with the Talos 2 C nearing the end of the test.
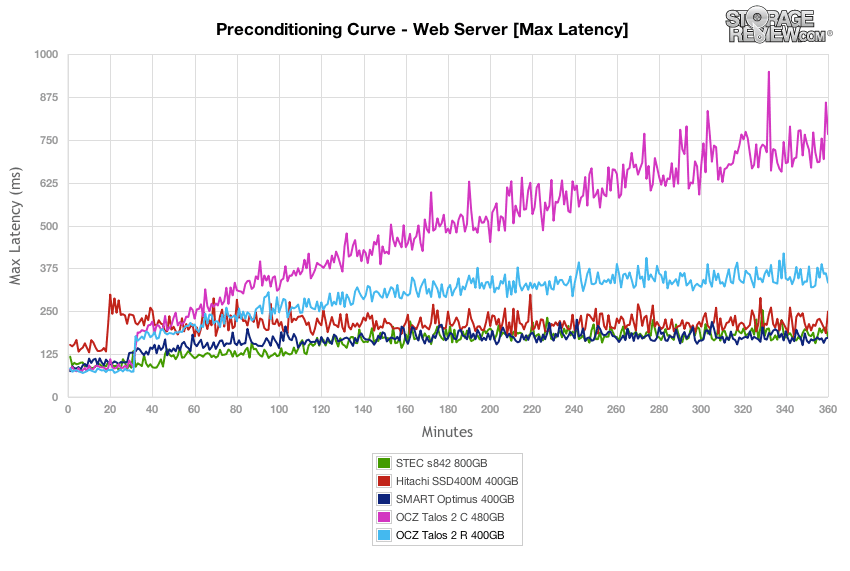
The OCZ Talos 2 drives started off well matching the Smart Optimus in max latency, but getting into steady-state the OCZ drives fell to the back of the group.
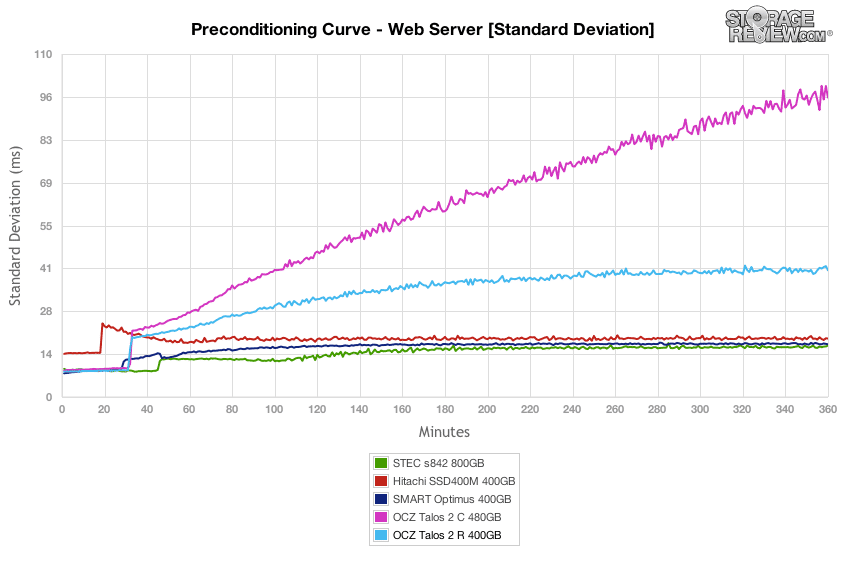
In line with what we saw in the max latency performance test, the OCZ Talos 2 drives started well with standard deviation, but slipped to the back of the group again in steady-state.
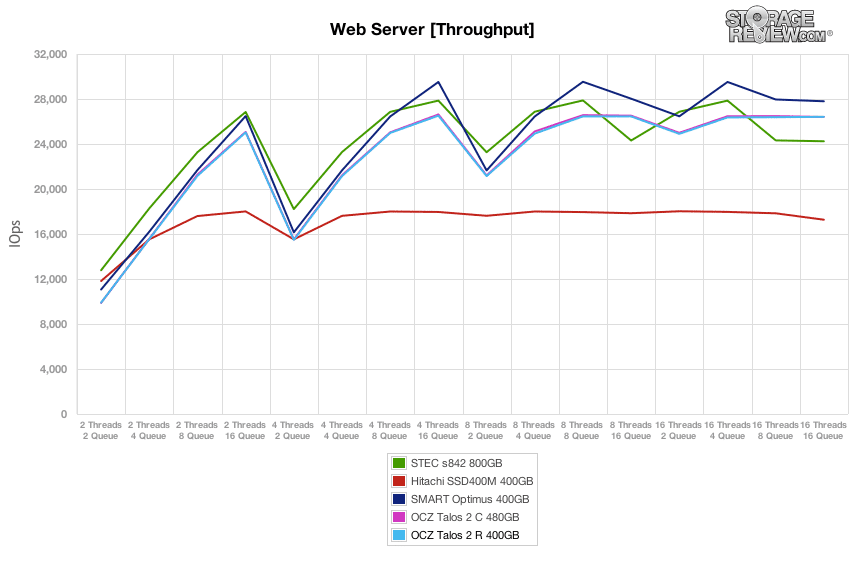
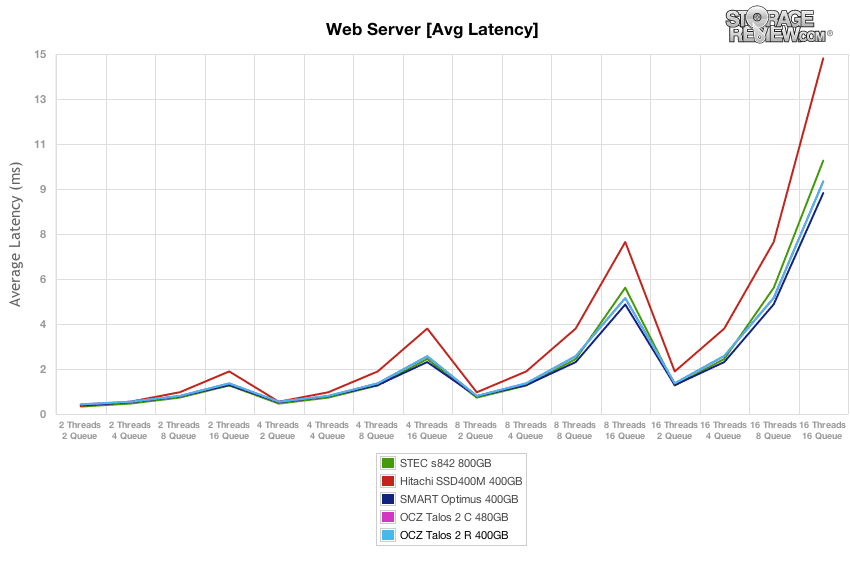
After each SSD finished our preconditioning stage in the Web Server test, we flipped the workload back to 100% read. In read-only conditions, the OCZ Talos 2 R offered consistently high throughput in all the thread/queue loads. It peaked around 26,400 IOPS, compared to the class-leading 27,800 IOPS the Smart Optimus delivered at the highest effective queue depth.
Average response times from the OCZ Talos 2 R and C stayed consistently low throughout the queue depths, and they were edged out only by the Smart Optimus.
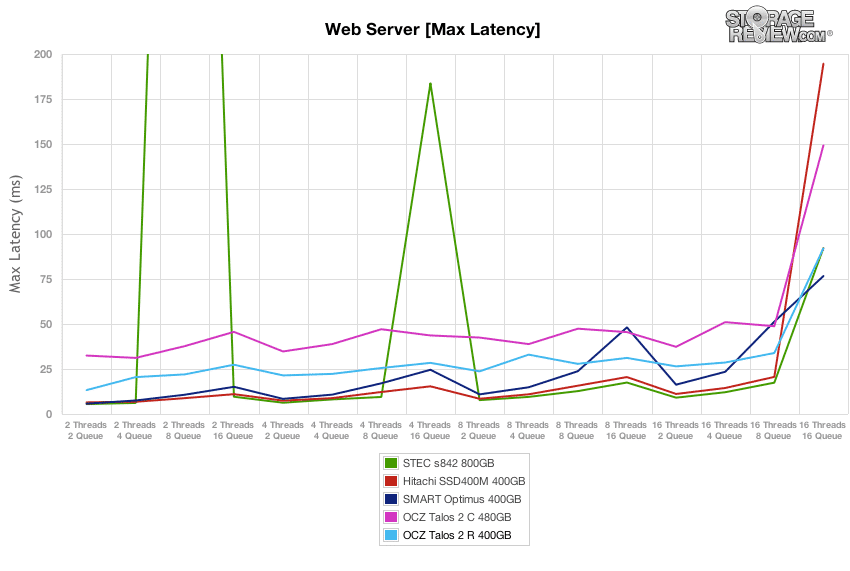
Comparing max latency, the OCZ Talos 2 R tested with response times measuring 20-35ms over the bulk of the test, before peaking at 92ms at the 16T/16Q load. The 16T/16Q figure was only bested by the Smart Optimus.
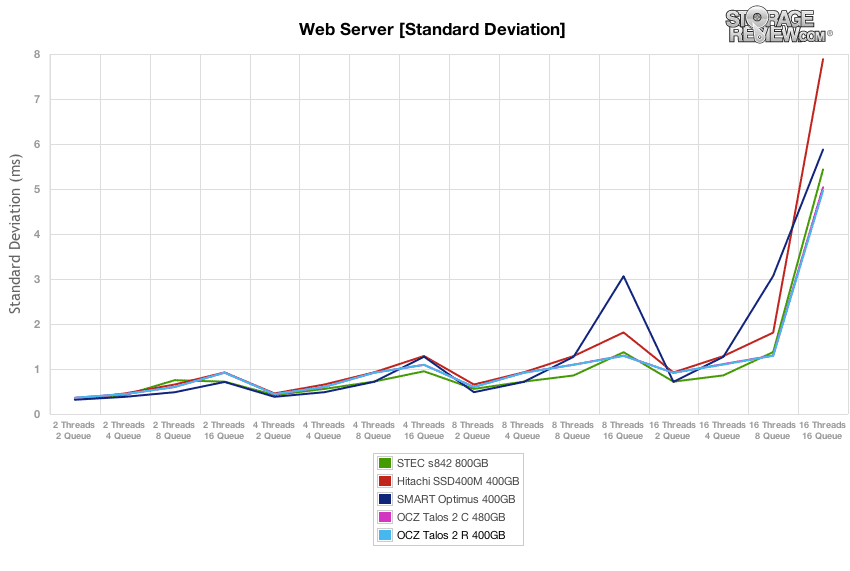
In terms of latency consistency in our read-only Web Server workload, the OCZ Talos 2 R started out at the back by a slim margin, though as the test continued onward, the Talos 2 R registered the best performance.
Conclusion
The OCZ Talos 2 R is a 2.5" form factor, enterprise-class SSD that provides up to 800GB of high-performance storage and interfaces over SAS with dual-ports for HA. Arriving in 200GB, 400GB and 800GB capacities, the Talos 2 R features 28% over-provisioning paired with MLC NAND for cost-benefits and reasonable endurance. To get to the capacity and performance numbers in this class of drive, OCZ ties together a pair of SSDs powered by twin SandForce controllers, uniting them with their virtual controller technology which delivers a unified storage pool to the file system.
As is typical for enterprise drives that utilize the SAS interface, the OCZ Talos 2 R is a billed as a high-performance SSD. So how did it hold up to the challenge of our wide-ranging workloads? Overall, the drive wasn’t a leader in synthetic benchmarks but in application tests it ranked closely with others or came in towards the top of the pack. In our proprietary MarkLogic NoSQL environment, the Talos 2 R came in third among the drives we’ve tested, closely trailing the Hitach SSD400M. In our new SysBench MySQL OLTP test, the Talos 2 ranked up at the top of the group and also offered the lowest 99th percentile latency from low to high load. Throughout the majority of our synthetic testing, it performed at parity with average. In our 4k and 8k workloads, the Talos 2 was bested by the Smart Optimus and sTec s842. However, there were some areas where the Talos 2 R shined: the web server and file server profiles. In those profiles, the Talos 2 R keep its latency to a minimum with greater consistency than most of the drives. Additionally, it provided plenty of throughput to see it compete for the top spot. While the Smart Optimus SSD often outpaces the other drives, the OCZ Talos 2 R particularly gave it a challenge and even bested it at times in the web and file server profiles.
It is important to recognize that even within the high-end SAS enterprise SSD market, there is still quite a bit of stratification. The Talos 2 isn’t trying to be the best top-tier drive in the market; both the C and R offerings are more mainstream and should have pricing advantages in many cases. The family offers quite a bit of flexibility in range of offerings and highlights some OCZ’s more creative technical assets like the VCA.
Pros
- Strong MySQL OLTP and MarkLogic NoSQL performance
- Good latency consistency during heavy preconditioning activity
- Midrange performance with fully-incompressible synthetic workloads
Cons
- 4k and 8k 70/30 performance was lower than other SSDs with single controller designs
- Lower warranty than comparable SSDs which offer 5 years
Bottom Line
The OCZ Talos 2 R is a mainstream enterprise SAS SSD that uses MLC NAND and features a unique dual-controller design with virtualized controller to unite them and includes enterprise features like power-fail protection. The drive posted good performance in our database application tests where SSDs of this nature are often asked to perform.

