
 Earlier this year, QSAN launched its first All-Flash SAN with the QSAN XCubeFAS XF2026D. As opposed to being a update to QSAN’s XCubeSAN line, the XCubeFAS XF2026D is an all new SAN product. The product is built on the foundations of being user-friendly, can be deployed and integrated into any environment, and is affordable regardless of the size of the company.
Earlier this year, QSAN launched its first All-Flash SAN with the QSAN XCubeFAS XF2026D. As opposed to being a update to QSAN’s XCubeSAN line, the XCubeFAS XF2026D is an all new SAN product. The product is built on the foundations of being user-friendly, can be deployed and integrated into any environment, and is affordable regardless of the size of the company.
The foundations laid out above are the main thrust of the QSAN XCubeFAS XF2026D. The company states the new SAN can be operated by all and managed through just a few clicks. QSAN states that features such as multiple volume creation, automatic remote replication, SSD monitoring, and performance analytics are easy to use. QSAN also states that the XF2026D can be deployed and integrated into any data environment whether they need high performance or certain features that are ideal for use cases like virtualization environments, big data analytics, and managing demanding applications. All of the above comes with the claims of affordability.
The QSAN XCubeFAS XF2026D is a 2U SAN that has a dual-active controller architecture. The SAN delivers high availability by designing everything with full redundancy. It also features automatic failover/failback mechanism, and cache mirroring through NTB (Non-Transparent Bridge) bus to achieve Active-Active functionality. With these features the XF2026D claims 99.9999% availability.
Another new feature that also improves data reliability is the Cache-to-Flash memory protection. This technology preserves cache data in the event of a power loss. The XF2026D leverages a battery backup module to transfer the data out of cache into an M.2 flash module assuring no data is lost and no inconsistencies occur.
QSAN XCubeFAS XF2026D Specifications
| Form Factor | 2U |
| CPU | Intel Xeon 4-core processor (8-core processor model is also available) |
| Memory (per controller) | Up to 128GB DDR4 ECC |
| RAID controller | Active-active dual controller |
| Memory Protection | Cache-to-Flash module Battery backup module + Flash module |
| Host connectivity | |
| Host Card Slot 1 | (optional): 4 x 16Gb FC (SFP+) ports 2 x 16Gb FC (SFP+) ports 4 x 10GbE iSCSI (SFP+) ports 2 x 10GbE iSCSI (RJ45) ports |
| Host Card Slot 2 | (optional): 4 x 16Gb FC (SFP+) ports 2 x 16Gb FC (SFP+) ports 4 x 10GbE iSCSI (SFP+) ports 2 x 10GbE iSCSI (RJ45) ports |
| Built-in 2 x 10GBASE-T iSCSI (RJ45) ports Built-in 1 x 1GbE management port |
|
| Storage | |
| Bays | 26 |
| Drive Type | 2.5” SAS, SED SSD |
| Max drives supported | 130 |
| Expansion | |
| Connectivity | Built-in 2 x 12Gb/s SAS wide ports (SFF-8644) |
| Capabilities | Up to 4 expansion units using XD5326 (SFF 26-bay) 12Gb SAS expansion enclosure |
| Power | |
| Supply | 80 PLUS Platinum, two redundant 770W (1+1) |
| AC Input | 100 – 127V 10A, 50-60Hz 200 – 240V 5A, 50-60Hz |
| DC Output | +12V 63.4A +5VSB 2.0A |
| Fan module | 2 x hot pluggable/redundant fan modules |
| Temperature | |
| Operating | 0 to 40°C |
| Shipping | -10°C to 50°C |
| Relative Humidity | 20%-80% |
| Warranty | 3-year system, 1-year battery backup |
Design and Build
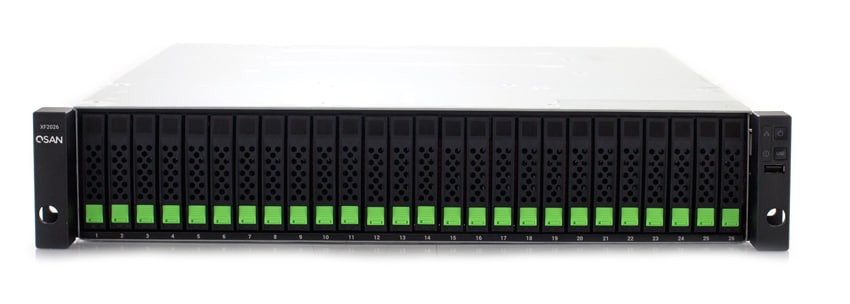
As stated, the QSAN XCubeFAS XF2026D is a 2U SAN and the design stays in line with the rest of QSAN products. Across the front are the 26 2.5” drive bays with the signature green release button. On the right side of the front panel are the system power button, the UID (Unique Identifier) button, system access and system status LEDs and a USB port for the USB LCM module.
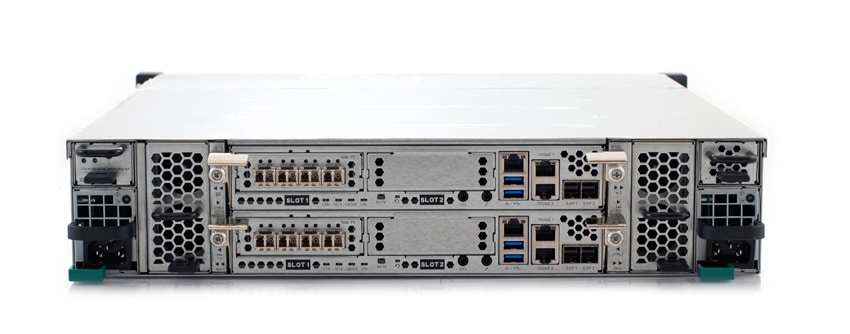
The rear of the device has the dual redundant power supplies, as well as the dual controllers. Each controller has onboard twin 10Gbase-T network connectivity, in addition to an out-of-band management interface. For additional connectivity, each controller has two host card slots, which can be loaded up with dual or quad port 8/16Gb cards, or dual or quad port 10Gb Ethernet cards. This gives users a wide range of options for attaching storage into a diverse datacenter environment. Expansion capabilities are also supported through two 12Gb/s SAS ports per controller, enabling SAS 3.0 expansion shelves. In the top left corner lies the Flash-to-Cache memory and battery module.
Management
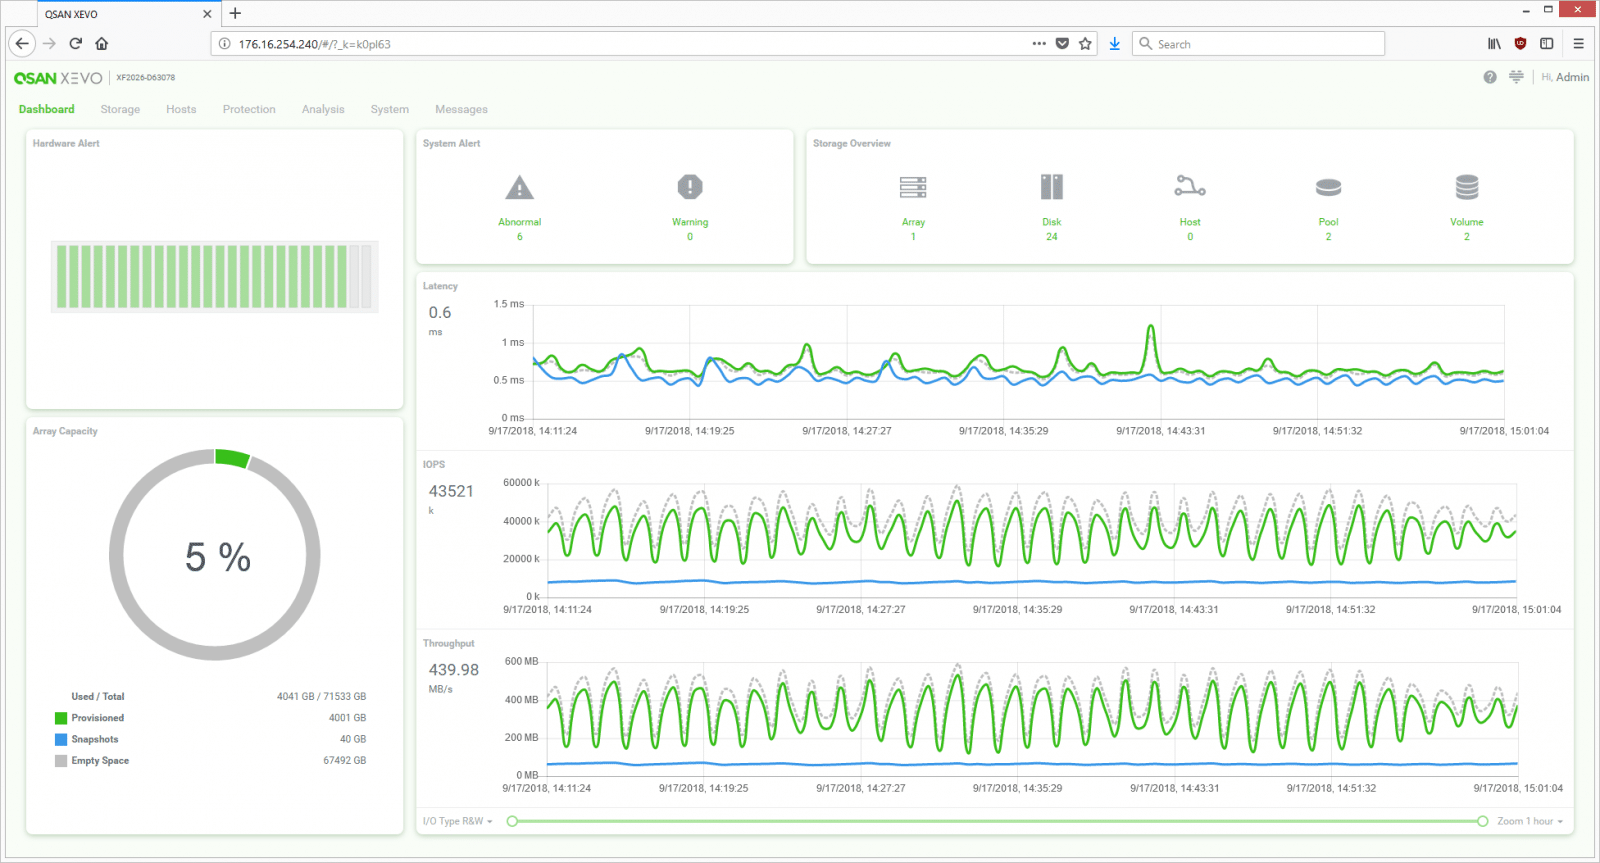
With this SAN comes a new management OS from QSAN, XEVO. This HTML5 GUI follows similar principles as the past QSAN models, specifically ease of use. The main page or dashboard has a quick view of anything an admin may need to know about right away. This includes hardware alerts, capacity used, system alerts, storage overview, and real-time performance. There are several tabs across the top that includes: Dashboard, Storage, Hosts, Protection, Analysis, System, and Messages.
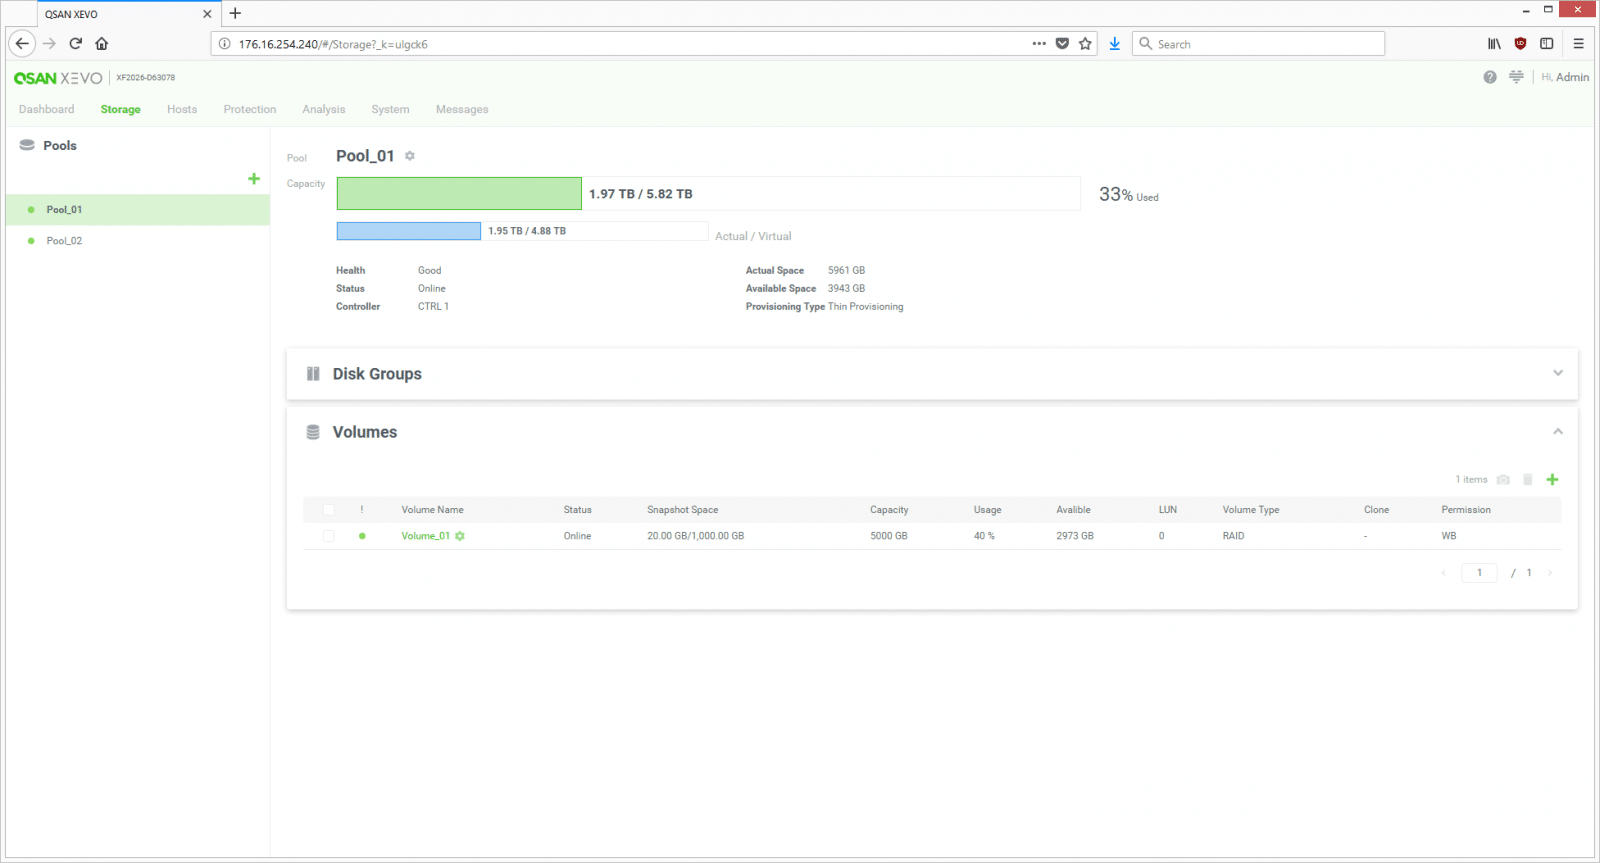
Under the Storage tab users can see the storage pools or create new ones. Within the pool they can see how much storage is used, the health and status of the storage, as well as the disk groups and volumes.
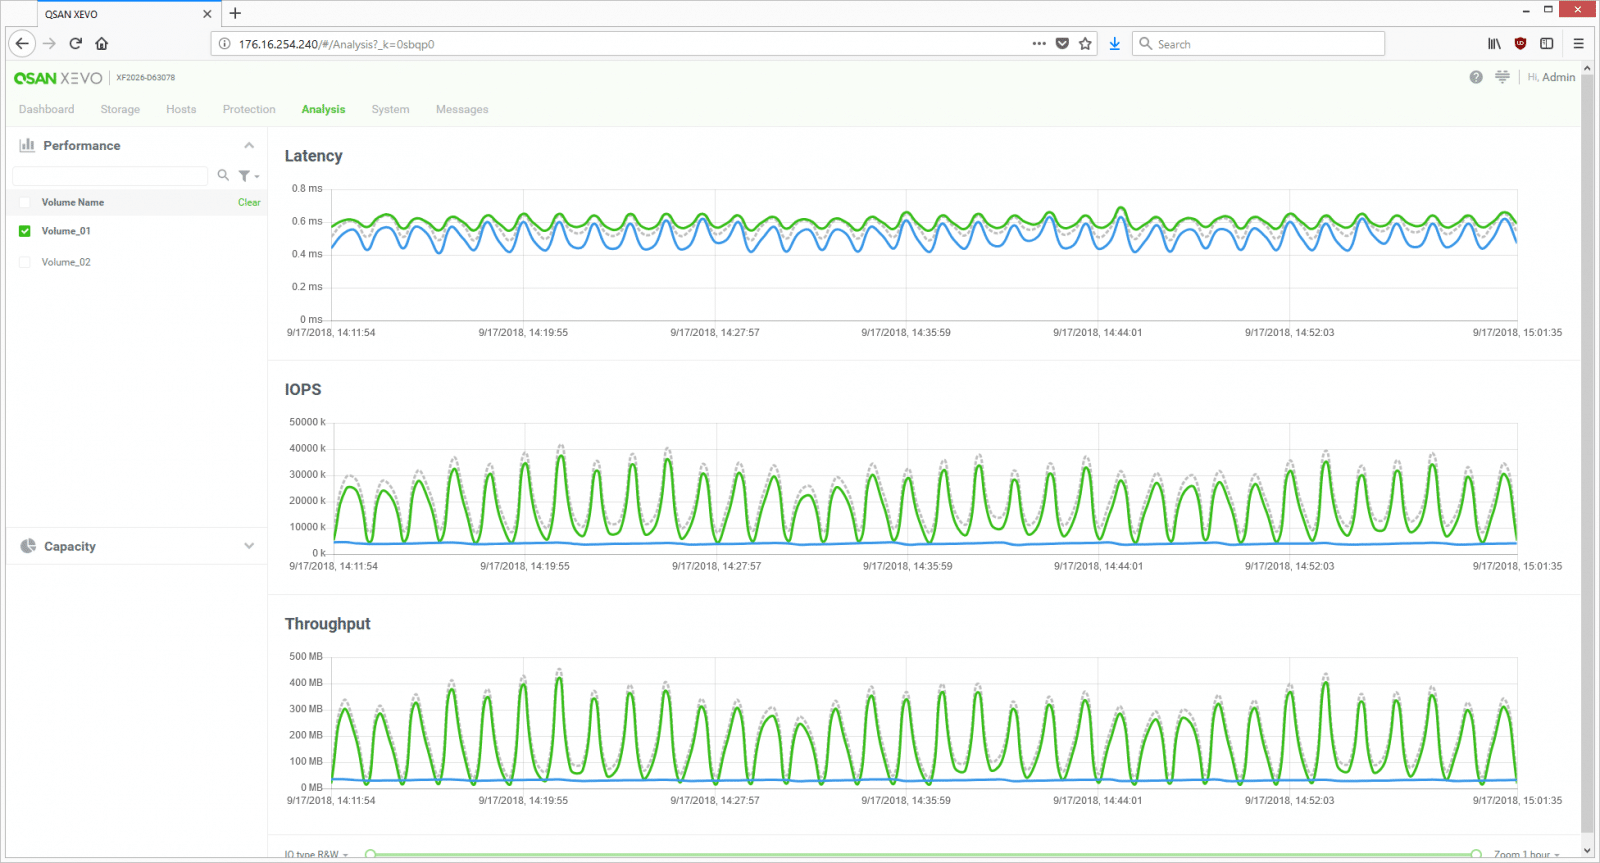
In the Analysis tab users can see important information such as performance of a volume (broken down into latency, IOPS, and throughput) as well as capacity usage of a volume.
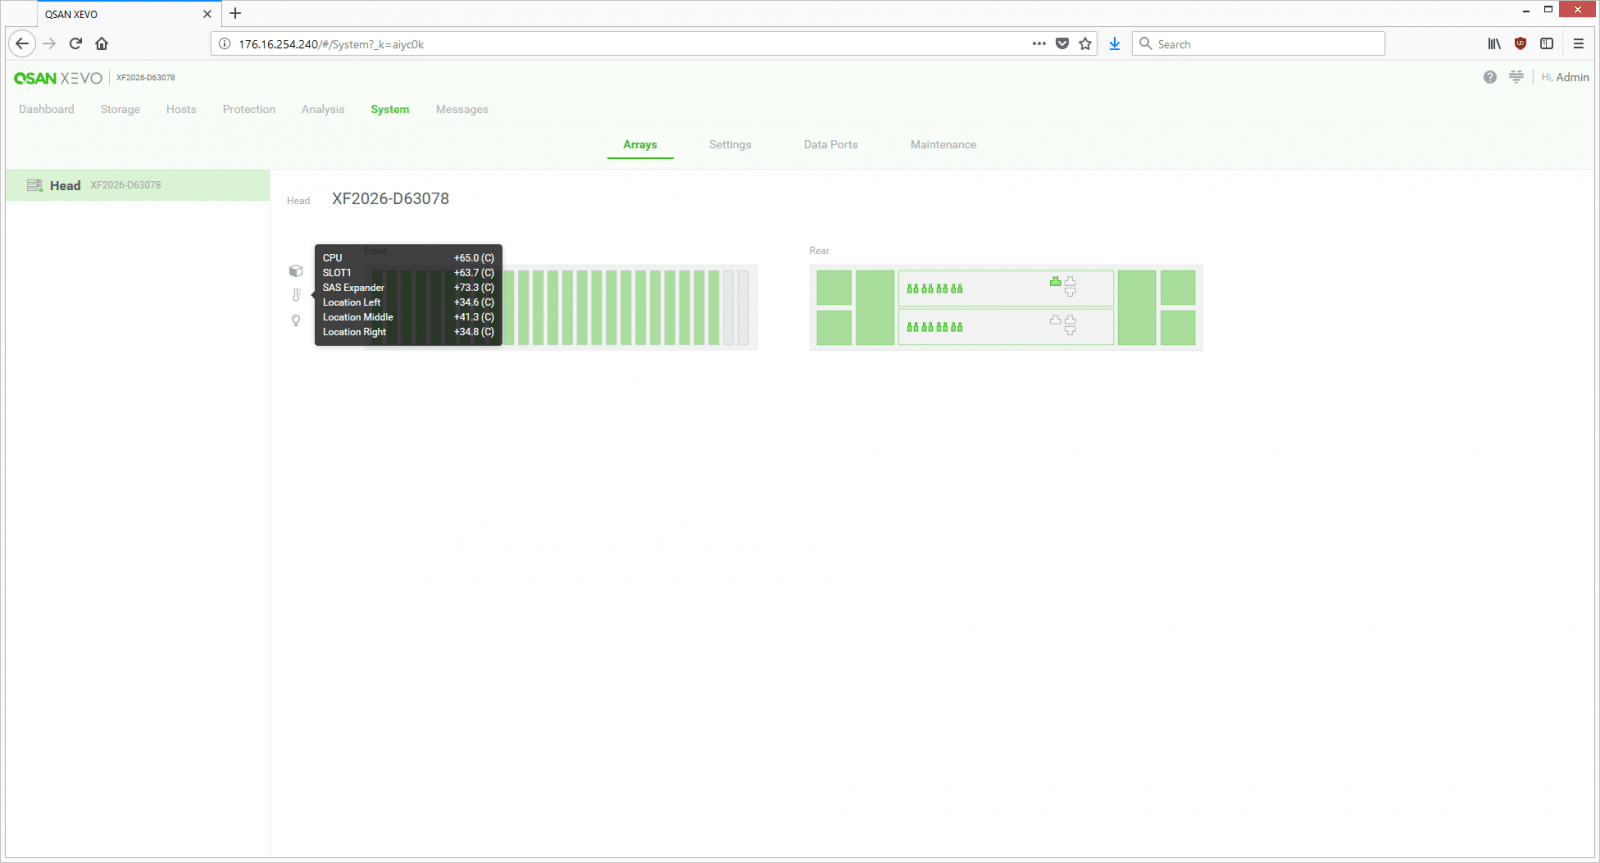
The System tab shows the hardware and what it is currently doing. Users can select between the sub-tabs of Arrays, Settings, Data Ports, and Maintenance. Under the Arrays sub-tab users can hover over things like the temperature icon to see the temperature for the host selected.
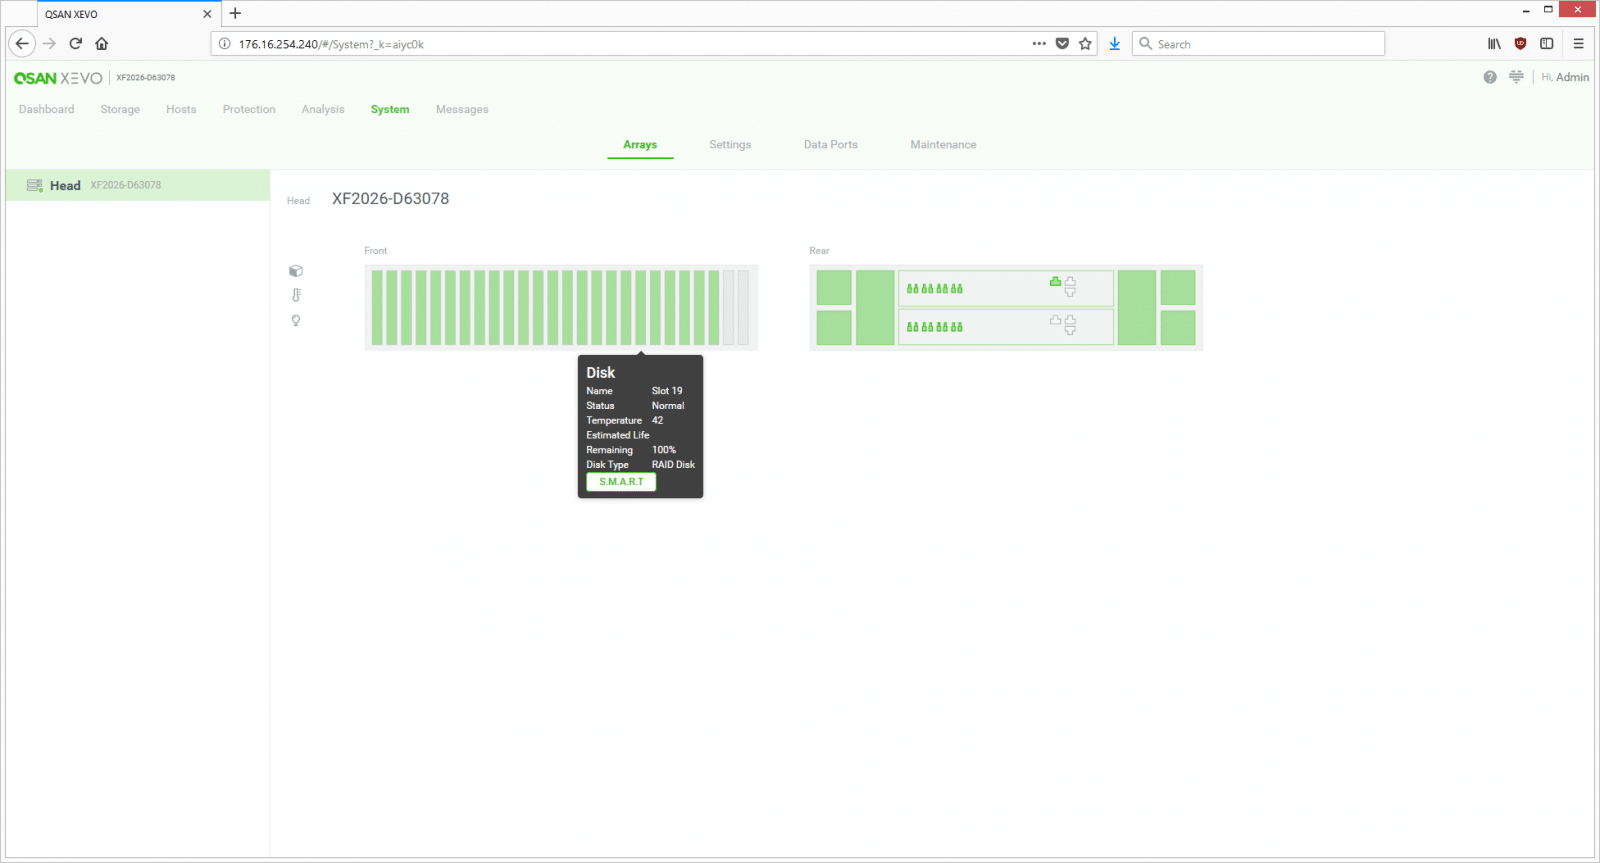
Users can also hover over a specific disk to see the type, temperature, status, and estimated remaining life.
Overall the UI and management are a big step forward for QSAN. Prior systems weren’t difficult to manage but this look and feel is much better. In an era where a usable HTML5 interface is table stakes, QSAN checks off that box.
Performance
Application Workload Analysis
The application workload benchmarks for the QSAN XCubeSAN XF2026D consist of the MySQL OLTP performance via SysBench and Microsoft SQL Server OLTP performance with a simulated TPC-C workload. In each scenario, we had the array configured with 26 Toshiba PX04SV SAS 3.0 SSDs, configured in two 12-drive RAID10 disk groups, one pinned to each controller. This left 2 SSDs as spares. Two 5TB volumes were then created, one per disk group. In our testing environment, this created a balanced load for our SQL and Sysbench workloads.
SQL Server Performance
Each SQL Server VM is configured with two vDisks: 100GB volume for boot and a 500GB volume for the database and log files. From a system resource perspective, we configured each VM with 16 vCPUs, 64GB of DRAM and leveraged the LSI Logic SAS SCSI controller. While our Sysbench workloads tested previously saturated the platform in both storage I/O and capacity, the SQL test is looking for latency performance.
This test uses SQL Server 2014 running on Windows Server 2012 R2 guest VMs, and is stressed by Quest’s Benchmark Factory for Databases. While our traditional usage of this benchmark has been to test large 3,000-scale databases on local or shared storage, in this iteration we focus on spreading out four 1,500-scale databases evenly across the QSAN XF2026D (two VMs per controller).
SQL Server Testing Configuration (per VM)
- Windows Server 2012 R2
- Storage Footprint: 600GB allocated, 500GB used
- SQL Server 2014
- Database Size: 1,500 scale
- Virtual Client Load: 15,000
- RAM Buffer: 48GB
- Test Length: 3 hours
- 2.5 hours preconditioning
- 30 minutes sample period
SQL Server OLTP Benchmark Factory LoadGen Equipment
- Dell EMC PowerEdge R740xd Virtualized SQL 4-node Cluster
- 8 Intel Xeon Gold 6130 CPU for 269GHz in cluster (Two per node, 2.1GHz, 16-cores, 22MB Cache)
- 1TB RAM (256GB per node, 16GB x 16 DDR4, 128GB per CPU)
- 4 x Emulex 16GB dual-port FC HBA
- 4 x Mellanox ConnectX-4 rNDC 25GbE dual-port NIC
- VMware ESXi vSphere 6.5 / Enterprise Plus 8-CPU
With SQL Server transactional score, the XF2026D had an aggregate score of 12,635.5 TPS with individual VMs running from 3,158.7 to 3,159 TPS.
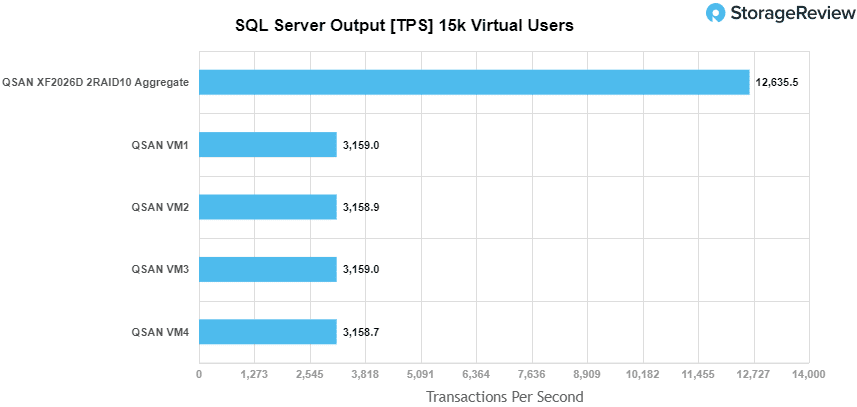
For SQL Server average latency the XF2026D had an aggregate score of 5.0ms.

Sysbench Performance
Each Sysbench VM is configured with three vDisks, one for boot (~92GB), one with the pre-built database (~447GB), and the third for the database under test (270GB). From a system-resource perspective, we configured each VM with 16 vCPUs, 60GB of DRAM and leveraged the LSI Logic SAS SCSI controller. Load gen systems are Dell R740xd servers.
Dell PowerEdge R740xd Virtualized MySQL 4 node Cluster
- 8 Intel Xeon Gold 6130 CPU for 269GHz in cluster (two per node, 2.1GHz, 16-cores, 22MB Cache)
- 1TB RAM (256GB per node, 16GB x 16 DDR4, 128GB per CPU)
- 4 x Emulex 16GB dual-port FC HBA
- 4 x Mellanox ConnectX-4 rNDC 25GbE dual-port NIC
- VMware ESXi vSphere 6.5 / Enterprise Plus 8-CPU
Sysbench Testing Configuration (per VM)
- CentOS 6.3 64-bit
- Storage Footprint: 1TB, 800GB used
- Percona XtraDB 5.5.30-rel30.1
- Database Tables: 100
- Database Size: 10,000,000
- Database Threads: 32
- RAM Buffer: 24GB
- Test Length: 3 hours
- 2 hours preconditioning 32 threads
- 1 hour 32 threads
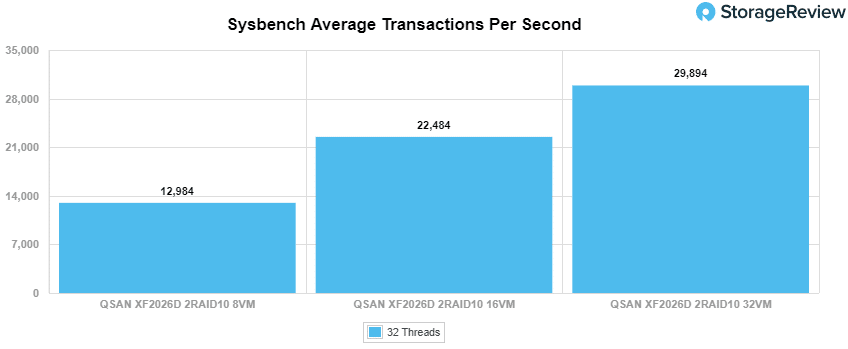
In our Sysbench benchmark, we tested several sets of 8VMs, 16VMs, and 32VMs. In transactional performance, the XF2026D hit numbers of 12,983.8 TPS for 8VM, 22,484.4 TPS for 16VM, and 29,893.9 TPS for 32VM.
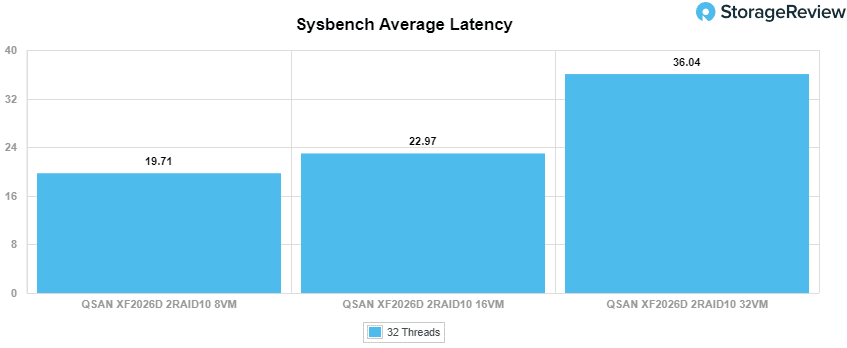
With average latency the XF2026D had 19.7ms for 8VMs, 23ms for 16VM, and 36ms for 32VM.
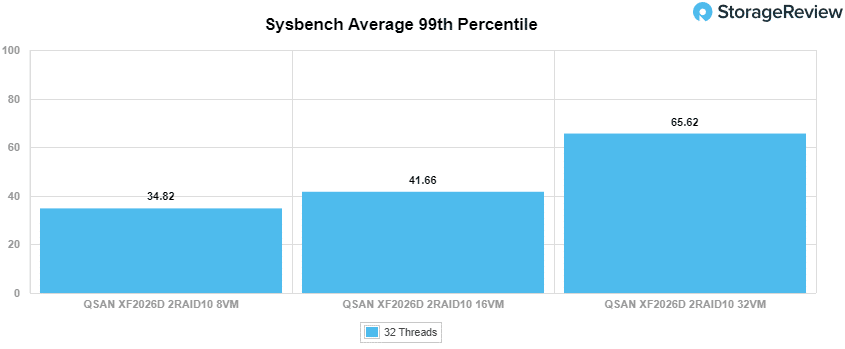
In our worst-case scenario latency benchmark, the XF2026D hit 34.8ms for 8VM, 41.7ms for 16VM and 65.6ms for 32VM.
VDBench Workload Analysis
When it comes to benchmarking storage arrays, application testing is best, and synthetic testing comes in second place. While not a perfect representation of actual workloads, synthetic tests do help to baseline storage devices with a repeatability factor that makes it easy to do apples-to-apples comparison between competing solutions. These workloads offer a range of different testing profiles ranging from “four corners” tests, common database transfer size tests, as well as trace captures from different VDI environments. All of these tests leverage the common vdBench workload generator, with a scripting engine to automate and capture results over a large compute testing cluster. This allows us to repeat the same workloads across a wide range of storage devices, including flash arrays and individual storage devices. On the array side, we use our cluster of Dell PowerEdge R740xd servers:
Profiles:
- 4K Random Read: 100% Read, 128 threads, 0-120% iorate
- 4K Random Write: 100% Write, 64 threads, 0-120% iorate
- 64K Sequential Read: 100% Read, 16 threads, 0-120% iorate
- 64K Sequential Write: 100% Write, 8 threads, 0-120% iorate
- Synthetic Database: SQL and Oracle
- VDI Full Clone and Linked Clone Traces
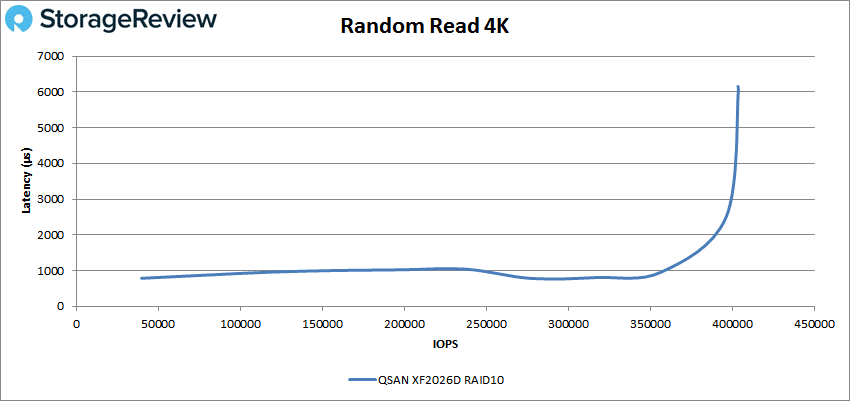
In 4K peak read performance, the XF2026D started off with sub-millisecond latency, rode the 1ms line for a bit, and went over 1ms around 15K IOPS. The SAN went on to peak at 403,790 IOPS with a latency of 6.03ms.
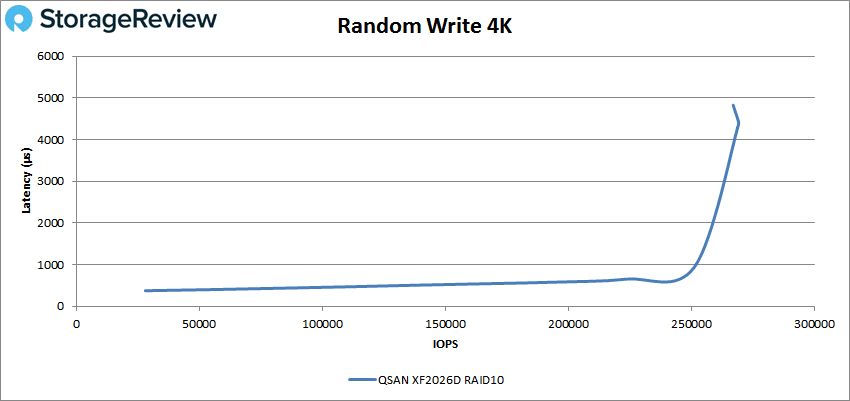
With 4K random writes we see an improvement in latency with the XF2026D maintaining sub-millisecond latency until about 250K IOPS and going on to peak at about 270K IOPS with 4.4ms latency before falling off some.
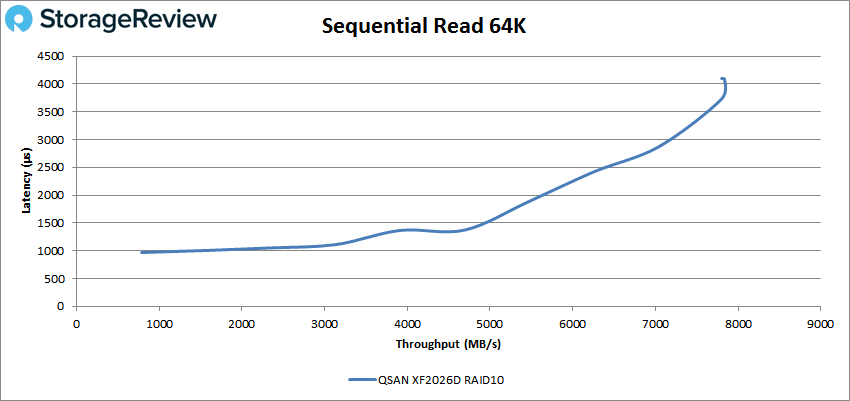
Switching over to 64K sequential, the XF2026D started off just a hair under 1ms in read before going over and then going on to peak just over 125K IOPS or 7.8GB/s with a latency of roughly 4.1ms before falling off slightly.
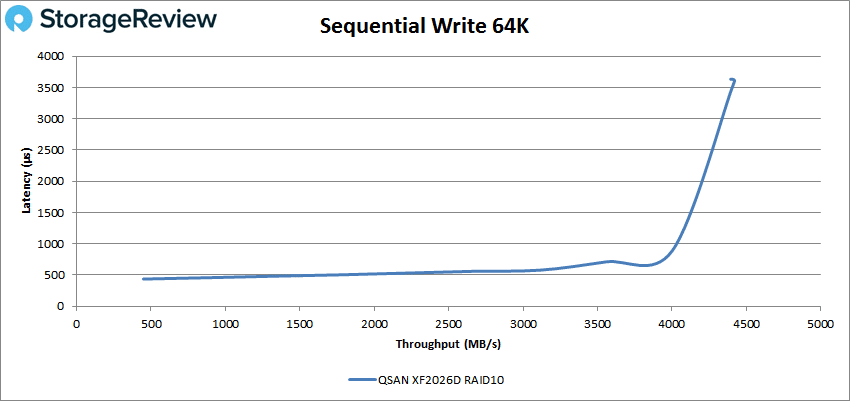
With 64K write we again see a better latency with the XF2026D maintaining sub-millisecond latency until about 64K IOPS or 4GB/s and going on to peak at 70,731 IOPS or 4.4GB/s with 3.6ms of latency.
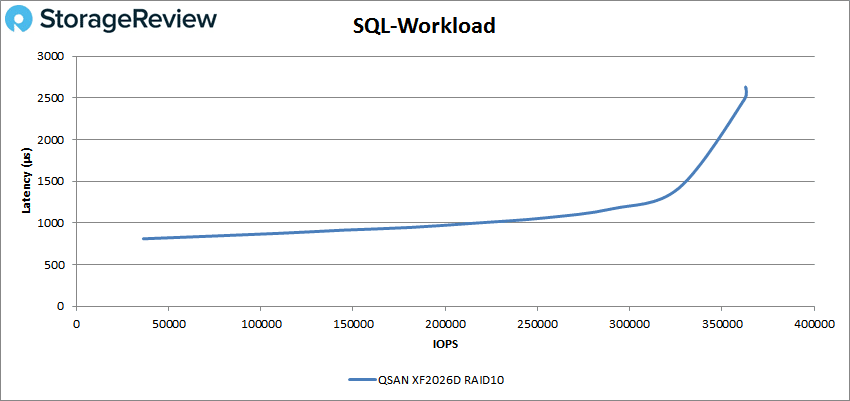
Next up is our SQL workload that saw the XF2026D stay under 1ms until roughly 210K IOPS and going on to peak at 362,807 IOPS with a latency of 2.62ms.
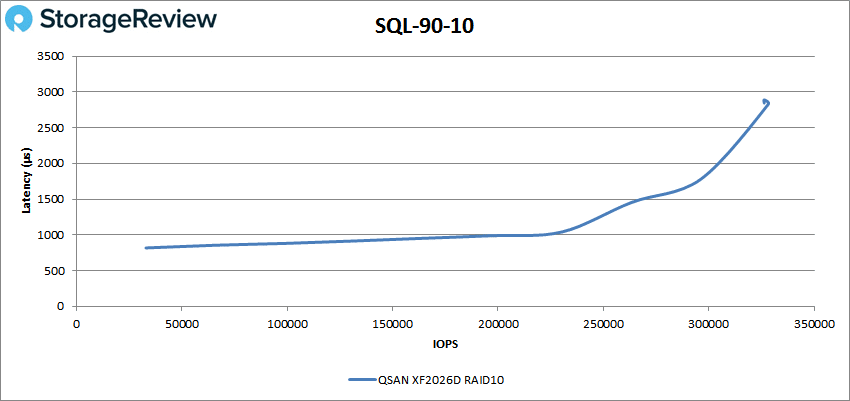
In SQL 90-10 the XF2026D had sub-millisecond latency until about 200K IOPS and peaked at 328,209 IOPS with a latency of 2.82ms.
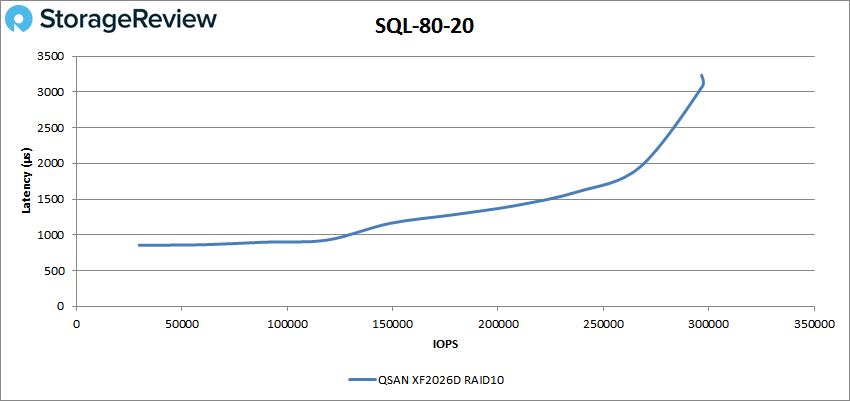
For SQL 80-20 the XF2026D stayed under 1ms until about 120K IOPS and peaked at 296,772 IOPS with a latency of 3.1ms.
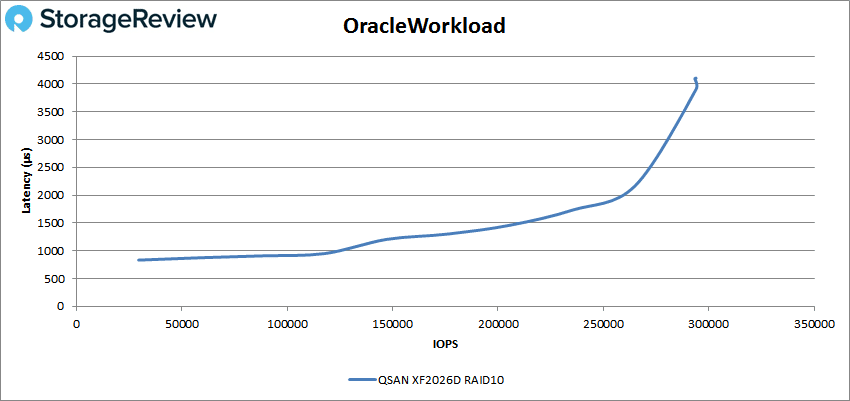
The next batch of benchmarks is out Oracle workloads with the XF2026D staying under 1ms until about 125K IOPS and having a peak of 293,975 IOPS and a latency of 3.91ms.
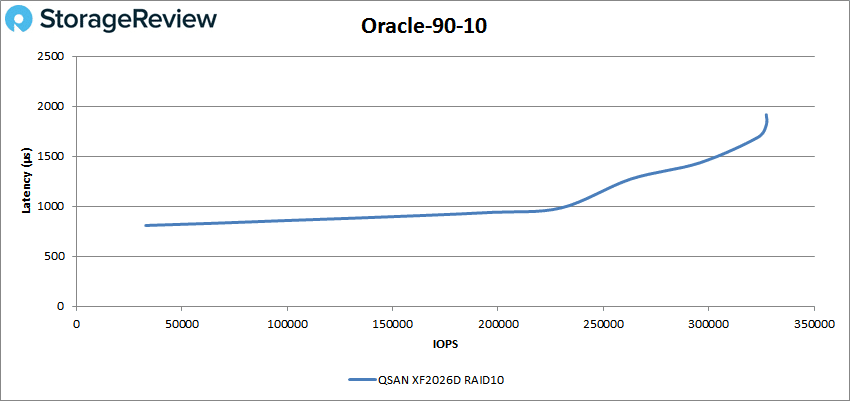
For Oracle 90-10 the XF2026D made it to 230K IOPS with sub-millisecond latency and had a peak of 327,269 IOPS at a latency of 1.91ms.
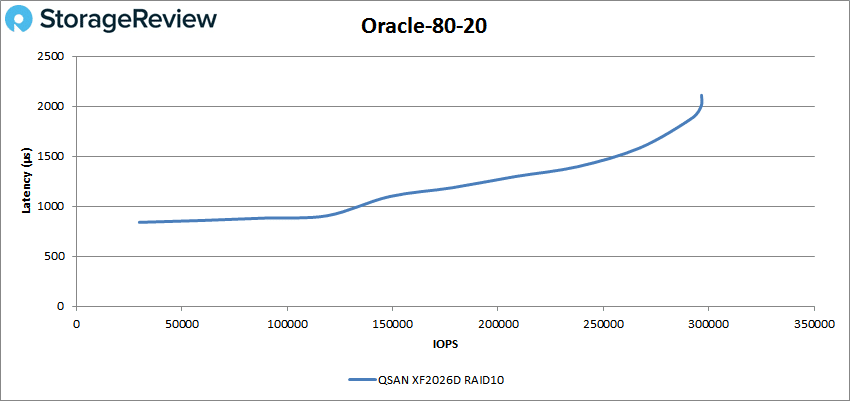
In the Oracle 80-20 benchmark the XF2026D had sub-millisecond latency performance until about 130K IOPS and peaked at 296,549 IOPS with 2.1ms for latency.
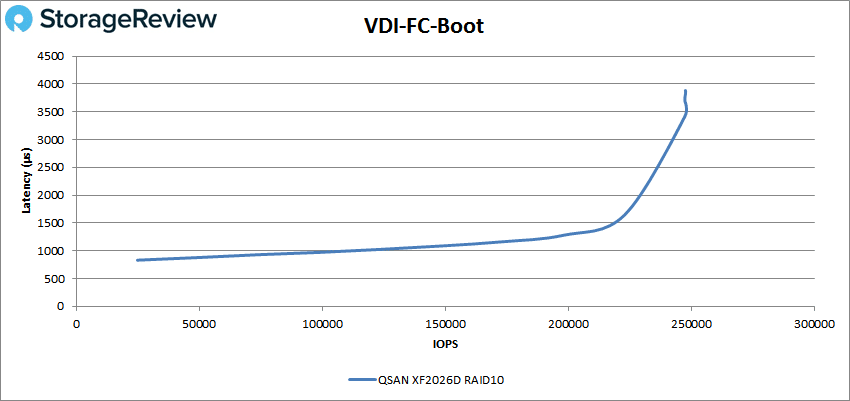
Next, we switched over to our VDI clone tests, Full Clone (FC) and Linked Clone (LC). For VDI FC Boot, the XF2026D had sub-millisecond latency performance until just under 10oK IOPS with a peak of 247,710 IOPS and a latency of 3.84ms.
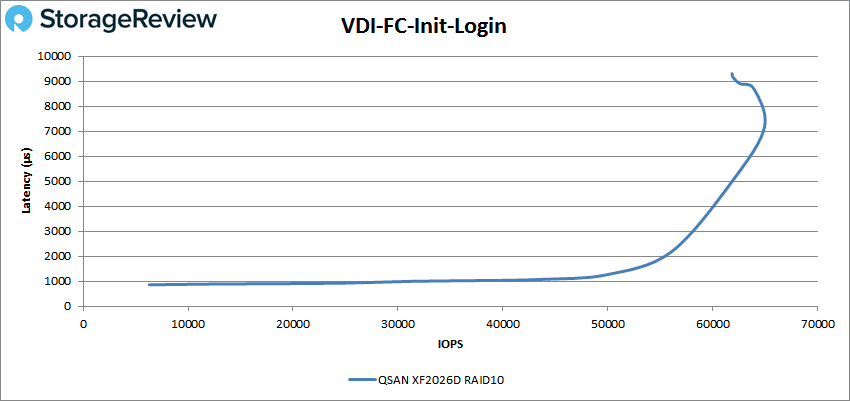
VDI FC Initial Login saw the XF2026D ride the 1ms line for some time with a peak of roughly 65K IOPS at a latency of 7.2ms before dropping off a bit.
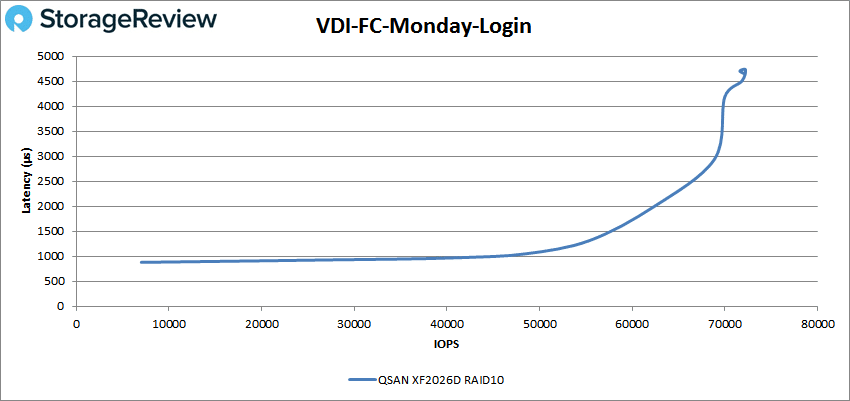
With VDI FC Monday Login the XF2026D started off better latency-wise, staying under 1ms until about 48K IOS and hitting a peak of 72,224 IOPS at a latency of 4.73ms.
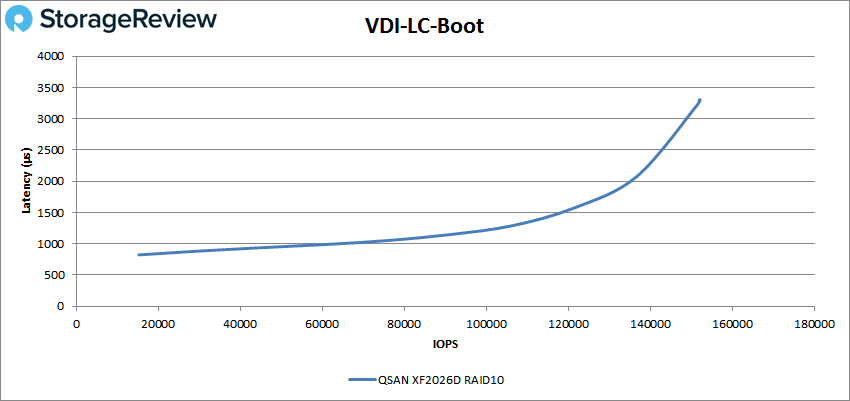
Switching over to Linked Clone (LC), we first looked at the boot test. In this scenario, the XF2026D had sub-millisecond latency performance until about 65K IOPS and peaked at 152,191 IOPS with 3.22ms for latency.
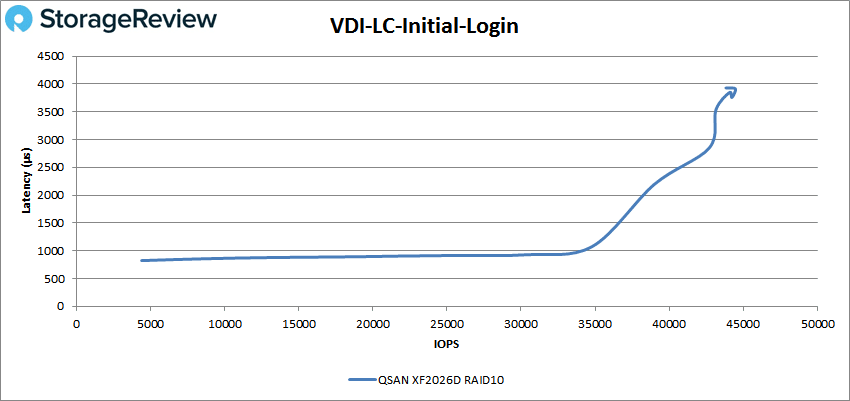
With VCI LC Initial Login we saw a stronger latency before with the XF2026D staying under 1ms until about 35K IOPS with a peak of 44,461 IOPS at 3.76ms latency.
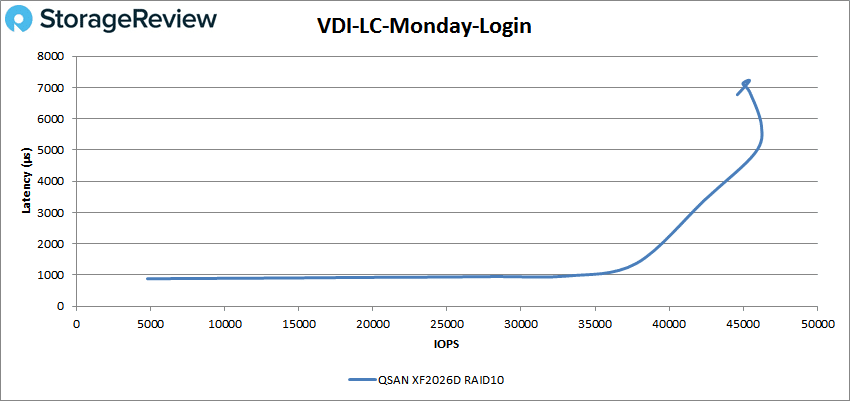
Finally our VDI LC Monday Login had the XF2026D start just under 1ms and riding the 1ms line until 35K IOPS before going on to peak at about 46K IOPS with a latency of 5.4ms.
Conclusion
The QSAN XCubeFAS XF2026D is the company’s latest SAN and first all-flash SAN. The 2U SAN is built around high availability with redundancy built in and offers six 9’s of availability. The XF2026D has the Cache-to-Flash technology that moves cached data to an M.2 module in the case of a power outage. Overall the device is built to be simple to use and deploy, easy to integrate into any environment, and to be affordable regardless of the company’s size.
In our Application Workload Analysis the XCubeFAS XF2026D was able to hit aggregate score of 12,635.5 TPS with an average latency of 5ms in SQL Server. This is right inline with the previous two versions we tested. In Sysbench the XF2026D outshone the previous version with transactional performance of 12,983.8 TPS for 8VM, 22,484.4 TPS for 16VM, and 29,893.9 TPS for 32VM. Average Sysbench latency saw the XF2026D with 19.7ms for 8VMs, 23ms for 16VM, and 36ms for 32VM. And the Sysbench worst-case scenario latency showed the new SAN slightly better with 34.8ms for 8VM, 41.7ms for 16VM and 65.6ms for 32VM.
Our VDBench workloads showed a strong performance from the SAN. Outfitted with SAS drives the SAN was able to hit some highlights such as 403K IOPS in 4K read, 270K IOPS in 4K write, 7.8GB/s in 64K sequential read, and 4.4GB/s in 64K sequential write. For our SQL test the SAN hit 363K IOPS, 328K IOPS in 90-10, and 297K IOPS in 80-20. Oracle tests also showed strong performance with 294K IOPS, 327K IOPS in 90-10, and 297K IOPS in 80-20. The SAN had strong VDI clone boots with 248K IOPS in Full and 152K IOPS in Linked. Latency always started off below 1ms and had peaks ranging from 1.91ms to 7.2ms
Sign up for the StorageReview newsletter