
We have a lot to say about this, so buckle up and enjoy the ride. This review will address some of the more interesting aspects of the Zen5 architecture and the flagship CPUs that AMD launched today.
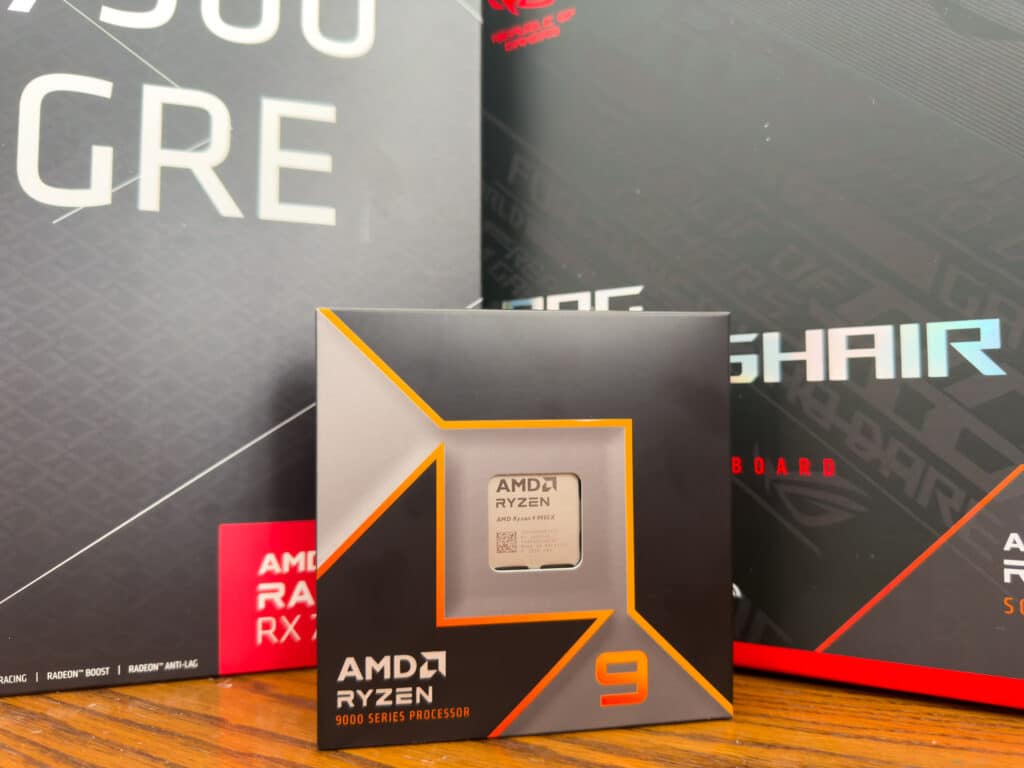
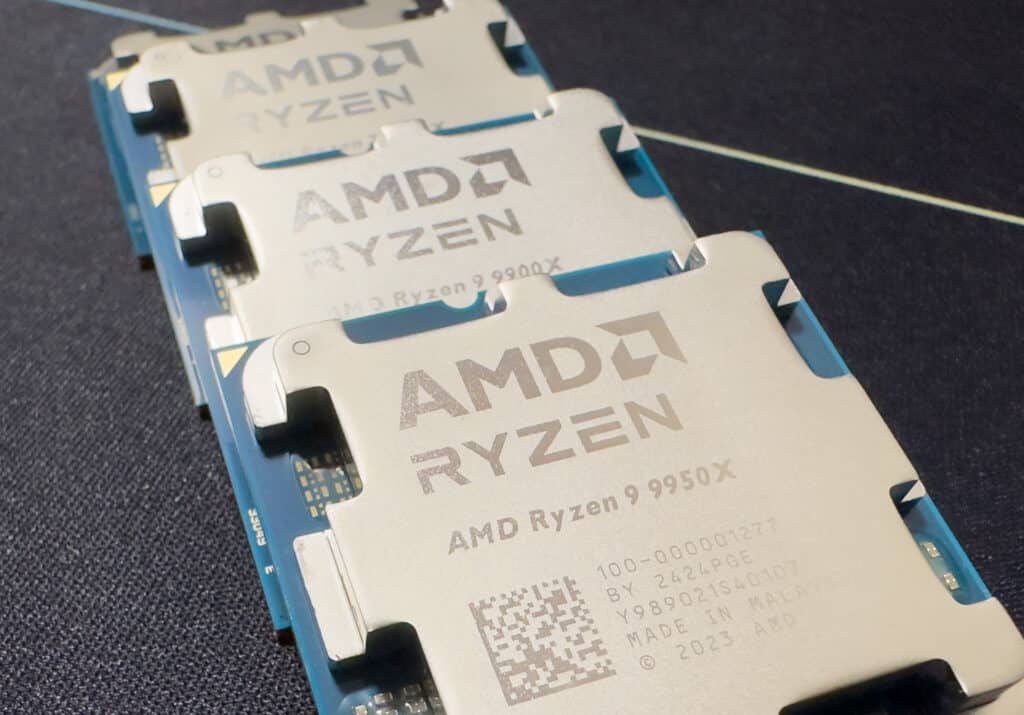
The AMD Ryzen 9 9950X and 9900X processors represent the next evolution in desktop computing, powered by AMD’s revolutionary Zen5 architecture. With groundbreaking advancements in performance, efficiency, and cutting-edge features like AVX-512 support, these CPUs are poised to redefine what’s possible for gamers, creators, and professionals alike. Whether you’re pushing the limits in gaming, conquering complex multi-threaded workloads, or exploring the latest in AI and data science, the Ryzen 9 9950X and 9900X deliver a compelling blend of power and versatility.
In this review, we examine the benchmarks and real-world performance, comparing these next-gen processors to their predecessors and revealing why they might be the ultimate upgrade for your system. Whether upgrading from an older platform or seeking the most potent chip for your AM5 setup, the Ryzen 9 9950X and 9900X are designed to elevate your computing experience to new heights.
Zen5, The Complete Picture
The “Zen5” architecture marks a considerable leap forward for AMD in performance and power efficiency. This new architecture builds upon the foundations of its predecessors while introducing significant enhancements that drive higher performance across various workloads. For more information on Zen5’s background, check out our recent architecture deep-dive and the initial review of Ryzen 5 and 7. This time, we are going to focus on specifics around tuning and efficiency with the new platform architecture.
Eco Mode
AMD’s Eco Mode is valuable for those looking to optimize their power efficiency without compromising too much on performance. This mode allows users to configure their AMD processors to operate at a lower TDP, effectively reducing power consumption. For example, a processor with a 105W TDP can be configured to run at 65W, or a 170W TDP chip can be adjusted down to 105W. This adjustment is handled through AMD Ryzen Master or the system BIOS, which makes the necessary changes to socket current and power settings.
The practical impact of Eco Mode can be significant—take the Ryzen 9 7950X as an example. When configured to operate at a 65W TDP, it can outperform a Ryzen 9 5950X operating at its default, higher TDP. While not yet available in a one-click option on preview BIOS versions, this feature can be manually configured by adjusting PPT, TDC, and EDC settings in the BIOS.
iGPU on every IO Die
On the graphics side, the Ryzen 9000 Series integrates a small RDNA 2-based graphics engine within every IO Die. This addition serves multiple purposes, such as in commercial markets where powerful processors are required, but discrete graphics solutions are often not utilized. Most importantly for the target audience, the integrated graphics provide troubleshooting capabilities for enthusiasts, ensuring that users can maintain system functionality even if their discrete GPU encounters issues. Beyond this, the integrated GPU also supports hardware encode/decode functionalities, remaining active even when a discrete GPU is installed. This thoughtful integration is made possible by leveraging the smaller 6nm node, enhancing the user experience with added functionality.
The I/O Die (IOD) in the Ryzen 9000 series is another highlight, built on a 6nm process and shared across the series. This IOD includes several key features derived from AMD’s mobile processor lineup, such as an active power management architecture and firmware. It also supports DDR5 memory up to 5600MT/s JEDEC, USB SuperSpeed 10Gbps with Type-C connectors, native USB BIOS flashback, and more. These advancements, combined with the integrated RDNA 2 graphics and updated Infinity Fabric changes, set the stage for significant performance improvements.
Overclockability
Memory overclocking has also seen considerable changes with the Ryzen 9000 series. The approach of keeping fabric, memory controller, and DRAM frequencies tied 1:1:1 is no longer the go-to. Due to the significantly higher frequencies of DDR5 compared to DDR4, the optimal configuration often involves setting the Infinity Fabric to AUTO while scaling the memory controller and DRAM at a 1:1 ratio. This means that settings like FCLK, UCLK, and MCLK at AUTO:1:1 will likely deliver the best performance in most scenarios. For DDR5-6000 memory, this configuration maximizes the performance potential, especially considering that higher FCLK frequencies may introduce instability. Memory P-states and FCLK DPM can be disabled for some workloads, providing flexibility depending on the specific use case.
On the core overclocking front, Precision Boost Overdrive (PBO) is the go-to method for balancing power efficiency with performance gains, particularly in gaming and mixed-use scenarios. PBO enables users to push their processors to higher clock speeds within safe power limits, providing a blend of single-threaded and multi-threaded performance improvements. Manual overclocking remains an option for those looking for more targeted performance increases, allowing users to tweak settings such as PBO Scalar, CPU Boost Clock override, and Curve Optimizer steps. Introducing new features like Curve Shaper allows for even finer control, enabling users to optimize performance and stability across different temperature and frequency bands.
Finally, the Ryzen 9000 series also introduces support for AVX-512 instructions, a notable addition for workloads that can leverage these extended instruction sets. The support includes a broad range of AVX-512 instructions, such as AVX512F for foundational operations, AVX512VNNI for neural network instructions, and AVX512BF16 for BFloat16 conversions. This broad support underscores AMD’s commitment to providing robust computational capabilities across a wide range of use cases.
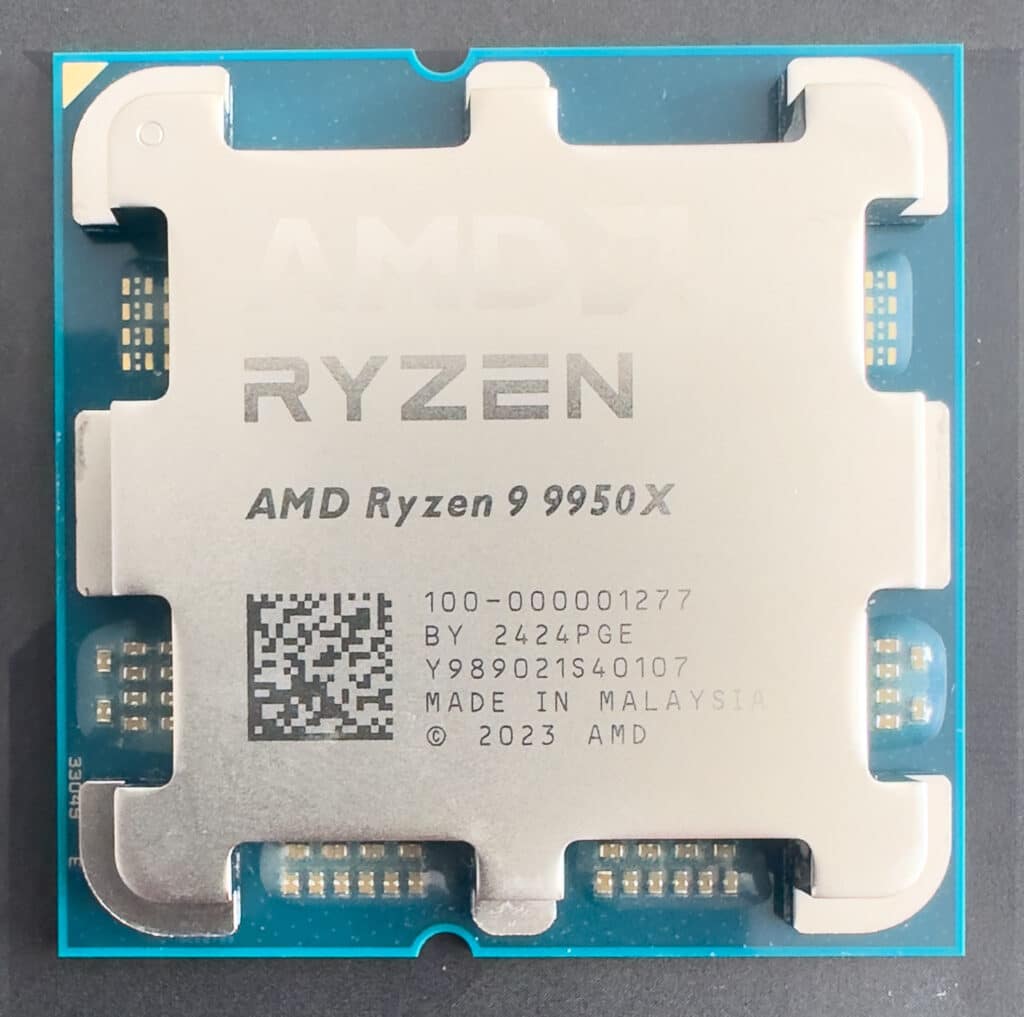
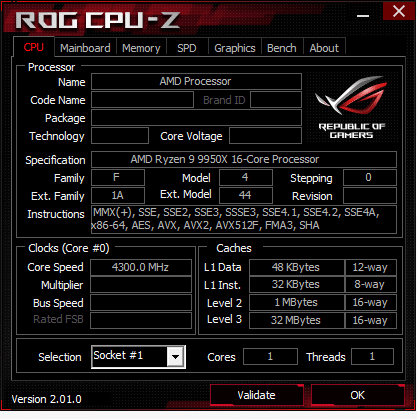
AMD Ryzen 9 9950X and 9900X Zen5 Specifications
| Specification | AMD Ryzen 9 9950X | AMD Ryzen 9 9900X |
| Architecture | Zen5 | Zen5 |
| Number of Cores | 16 | 12 |
| Number of Threads | 32 | 24 |
| Base Clock Speed | 4.3 GHz | 4.4 GHz |
| Max Boost Clock | Up to 5.7 GHz | Up to 5.5 GHz |
| L1 Cache | 1MB | 768KB |
| L2 Cache | 16MB | 12MB |
| L3 Cache | 64MB | 48MB |
| TDP | 170W | 142W |
| Socket | AM5 | AM5 |
| PCIe Version | PCIe 5.0 | PCIe 5.0 |
| Memory Type | DDR5-5600 | DDR5-5600 |
| Max Memory Size | 192 GB | 192 GB |
| Integrated Graphics | AMD Radeon Graphics | AMD Radeon Graphics |
| Graphics Base Frequency | 2200 MHz | 2000 MHz |
| Manufacturing Process | TSMC 4nm FinFET | TSMC 4nm FinFET |
| Supported Chipsets | AMD A620, B650, B650E, X670, X670E, X870, X870E | AMD A620, B650, B650E, X670, X670E, X870, X870E |
| Operating Systems Supported | RHEL, Ubuntu, Windows 10, Windows 11 | RHEL, Ubuntu, Windows 10, Windows 11 |
| Cooler | Not Included | Not Included |
AMD Ryzen 9 9950X and 9900X Performance
Test Configuration
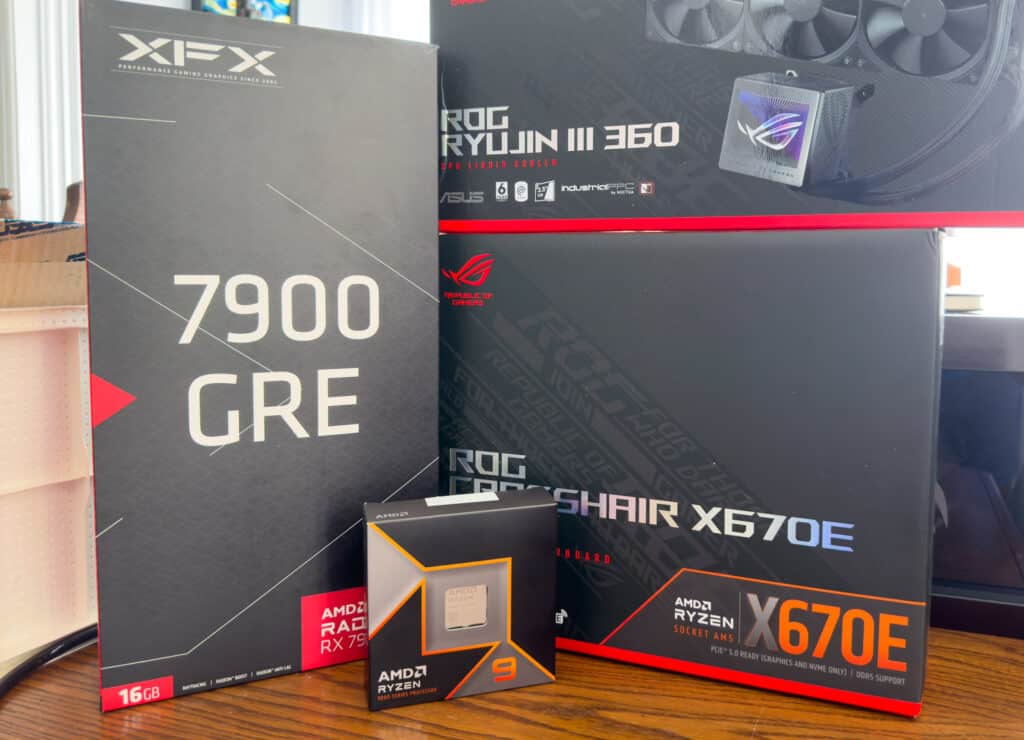
Our AMD Ryzen 9 9950X and 9900X CPUs testing rig has high-end components to ensure optimal performance. Each CPU was swapped into the same setup and subjected to rigorous benchmarking.
The specifications for our testing platform included:
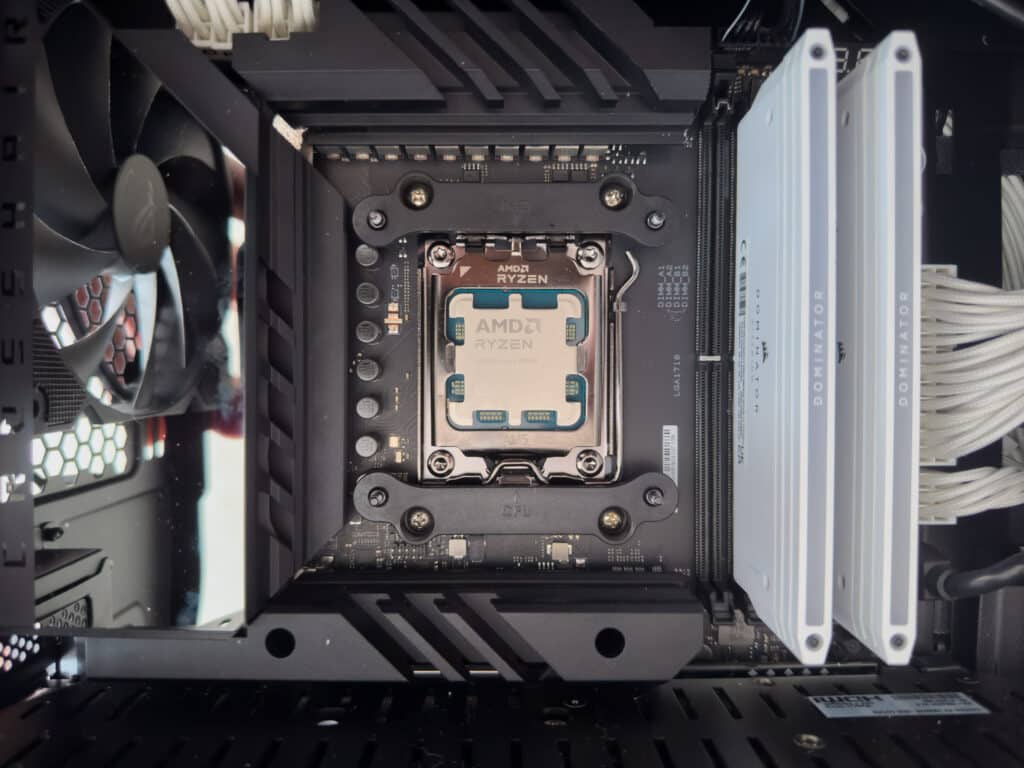
- Motherboard: ASUS ROG CROSSHAIR X670E HERO
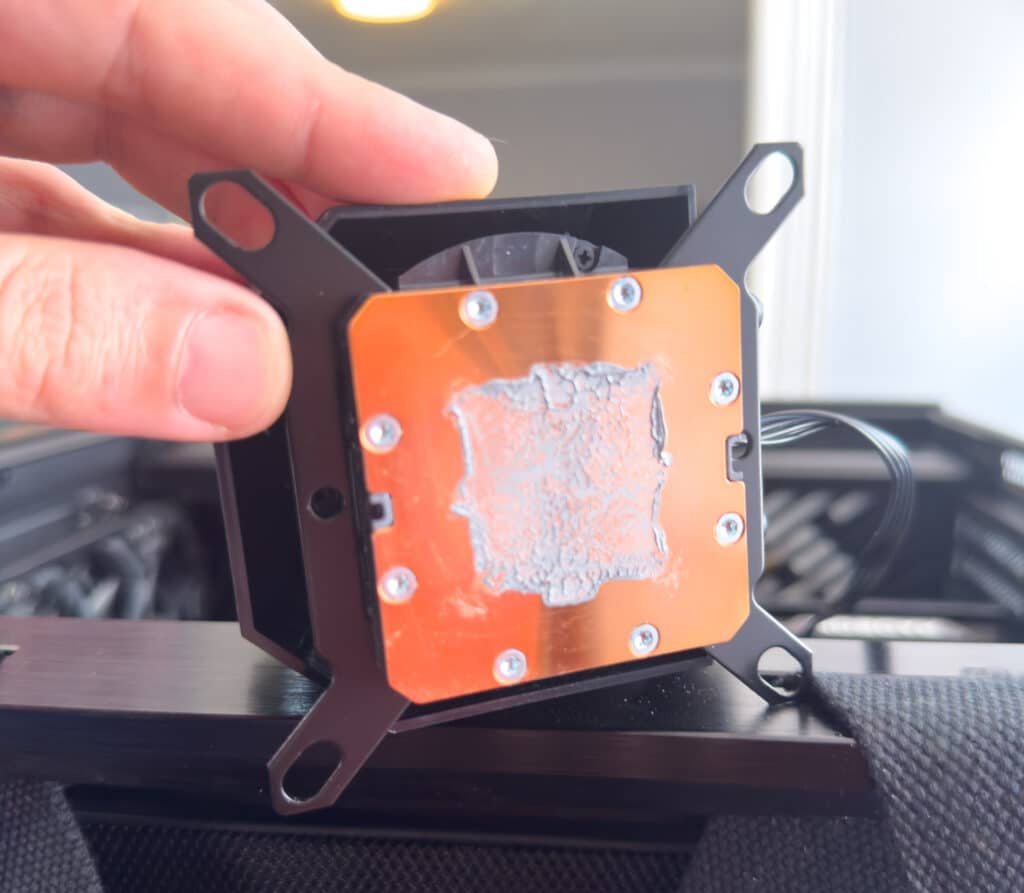
- Cooler: ASUS ROG RYUJIN III 360 AIO Cooler
- Memory: Corsair Dominator Titanium DDR5 @ DOCP 6000
- Storage: KIOXIA XG8 M.2 2TB NVMe
- GPU: XFX Radeon 7900 GRE
The ASUS ROG CROSSHAIR X670E HERO motherboard is ideal for benchmarking Zen5 CPUs due to its robust 18+2 phase VRM configuration, which ensures stable power delivery. We used the ASUS ROG RYUJIN III 360 AIO Cooler, which provides excellent thermal management, crucial for maintaining peak performance during intensive tasks. The Corsair Dominator Titanium DDR5 memory runs at DOCP 6000, offering high-speed, low-latency performance essential for both gaming and professional applications.
Storage is handled by the KIOXIA XG8 M.2 2TB NVMe SSD, which is quoted with sequential read speeds of up to 7,000 MB/s and sequential write speeds of up to 5,800 MB/s. The graphics performance is powered by the XFX Radeon RX 7900 GRE, featuring 16GB of GDDR6 memory, a 256-bit memory interface, and boost clock speeds up to 2395 MHz. This GPU supports advanced technologies like AMD FidelityFX and the AMD Radiance Display Engine.
We tested the 9950X with Precision Boost Overdrive (PBO), both enabled and disabled. PBO allows the processor to exceed its base performance by leveraging the extra thermal and power headroom. As you will see below, this resulted in a noticeable increase in multi-core performance, particularly during intensive workloads.
We will also compare AMD’s flagship 9000X series to the AMD Ryzen 9 7950X (Zen4, 16 cores, 32 threads) and the recently reviewed AMD Ryzen 5 9600X (Zen5, 6 cores, 12 threads). This will enable us to evaluate the performance differences across different tiers of AMD’s latest offerings, providing insights into how each processor handles a variety of workloads, such as gaming and content creation.
AMD Ryzen 9 9950X and 9900X Zen5 Benchmark Results
3DMark CPU Profile
The 3DMark CPU Profile benchmarking tool is tailored to gauge CPU performance through custom simulations. This benchmark includes six tests, each employing the same workload but with varying threading capacity. These tests are meticulously designed to challenge the CPU across different threading levels — 1, 2, 4, 8, 16, and up to the maximum available threads of a given system.
| 3DMARK CPU Profile | AMD Ryzen 9 9950X PBO (Zen5, 16c, 32t) |
AMD Ryzen 9 9950X (Zen5, 16c, 32t) |
AMD Ryzen 9 9900X (Zen5, 12c, 24t) | AMD Ryzen 9 7950X (Zen4, 16c, 32t) | AMD Ryzen 5 9600X (Zen5, 6c, 12t) |
| Max Threads | 18,303 | 16,619 | 14,075 | 15,820 | 7,374 |
| 16 Threads | 17,499 | 16,956 | 13,066 | 14,986 | 7,390 |
| 8 Threads | 9,457 | 9,431 | 9,369 | 8,058 | 6,876 |
| 4 Threads | 5,009 | 4,983 | 5,005 | 4,286 | 4,758 |
| 2 Threads | 2,562 | 2,551 | 2,576 | 2,213 | 2,484 |
| 1 Thread | 1,297 | 1,294 | 1,295 | 1,116 | 1,264 |
3DMark GPU Tests
3DMark Night Raid is a DirectX 12 benchmark tailored for devices with internal graphics, while Fire Strike is a DirectX 11 benchmark designed for gaming PCs. Fire Strike includes two graphics tests, one physics test, and a combined test for the CPU and GPU simultaneously.
| 3DMark Test | AMD Ryzen 9 9950X PBO (Zen5, 16c, 32t) |
AMD Ryzen 9 9950X (Zen5, 16c, 32t) |
AMD Ryzen 9 9900X (Zen5, 12c, 24t) | AMD Ryzen 9 7950X (Zen4, 16c, 32t) | AMD Ryzen 5 9600X (Zen5, 6c, 12t) |
| Fire Strike Ultra | 14,753 | 14,968 | N/A | 14,958 | 14,666 |
| Speed Way | 4,466 | 4,471 | 4,470 | 4,472 | 4,469 |
| Time Spy Extreme | 11,265 | 11,185 | 10,860 | 11,142 | 9,369 |
| Steel Nomad | 4,922 | 4,924 | 4,899 | 4,884 | 4,917 |
Geekbench 6
The Geekbench 6 cross-platform benchmark measures a system’s performance and provides a comparison score. It is designed to work on multiple platforms and provides a consistent performance measurement across many devices, from smartphones and tablets to desktops and servers.
| Geekbench 6 | AMD Ryzen 9 9950X PBO (Zen5, 16c, 32t) |
AMD Ryzen 9 9950X (Zen5, 16c, 32t) |
AMD Ryzen 9 9900X (Zen5, 12c, 24t) | AMD Ryzen 9 7950X (Zen4, 16c, 32t) | AMD Ryzen 5 9600X (Zen5, 6c, 12t) |
| Single Core | 3,346 | 3,426 | 3,442 | 3,099 | 3,326 |
| Multi-Core | 20,801 | 20,883 | 20,780 | 20,728 | 14,798 |
Maxon Cinebench
Cinebench is a widely used benchmarking tool that measures the performance of CPUs and GPUs using Maxon Cinema 4D for rendering. It provides a score that can compare the performance of different systems and components. We ran four popular versions of Cinebench so you can compare the results on popular leaderboards online.
| Test | AMD Ryzen 9 9950X PBO (Zen5, 16c, 32t) |
AMD Ryzen 9 9950X (Zen5, 16c, 32t) |
AMD Ryzen 9 9900X (Zen5, 12c, 24t) | AMD Ryzen 9 7950X (Zen4, 16c, 32t) | AMD Ryzen 5 9600X (Zen5, 6c, 12t) |
| Cinebench R23 | |||||
| CPU (Multi Core) | 45,571 pts | 42,962 pts | 33,386 pts | 38,327 pts | 16,384 pts |
| CPU (Single Core) | 2,296 pts | 2,284 pts | 2,249 pts | 2,024 pts | 2,184 pts |
| MP Ratio | 19.84 x | 18.81 x | 15.85 x | 18.93 x | 7.50 x |
| Cinebench R20 | |||||
| CPU | 18,032 pts | 16,722 pts | 13,038 pts | 14,970 pts | 6,413 pts |
| Cinebench R15 | |||||
| CPU | 7,168 cb | 6,706 cb | 5,181 cb | 6,288 cb | 2,561 cb |
| Cinebench R24 | |||||
| CPU (Multi Core) | N/A | 2,227 pts | 1,856 pts | 2,142 pts | N/A |
| CPU (Single Core) | N/A | 137 | 139 pts | 122 pts | N/A |
| MP Ratio | N/A | 16.28 x | 13.34 x | 17.55 x | N/A |
y-cruncher
y-cruncher 0.8.3.9522 is a multi-threaded, scalable program that can compute Pi and other mathematical constants to trillions of digits. Since its launch in 2009, it has become a popular benchmarking and stress-testing application for overclockers and hardware enthusiasts.
| y-cruncher Total Computation Time (Lower is Better) | AMD Ryzen 9 9950X PBO (Zen5, 16c, 32t) |
AMD Ryzen 9 9950X (Zen5, 16c, 32t) |
AMD Ryzen 9 9900X (Zen5, 12c, 24t) | AMD Ryzen 9 7950X (Zen4, 16c, 32t) | AMD Ryzen 5 9600X (Zen5, 6c, 12t) |
| 1 Billion | 17.494s | 17.652s | 16.656s | 15.598s | 24.945s |
| 2.5 Billion | 50.120s | 49.871s | 49.417s | 41.984s | 74.920s |
| 5 Billion | 116.049s | 116.624s | 115.006s | 91.386s | 163.732s |
y-cruncher BBP
This y-cruncher benchmark utilizes the Bailey-Borwein-Plouffe (BBP) formulas to compute massive hexadecimal digits of Pi, measuring the CPU’s total computation time, utilization, and multi-core efficiency. The results provide a detailed AMD Ryzen 9 9950X CPU performance analysis under these intensive calculations.
| Benchmark | AMD Ryzen 9 9950X PBO (Zen5, 16c, 32t) |
AMD Ryzen 9 9950X (Zen5, 16c, 32t) | AMD Ryzen 9 9900X (Zen5, 12c, 24t) | AMD Ryzen 9 7950X (Zen4, 16c, 32t) | AMD Ryzen 5 9600X (Zen5, 6c, 12t) |
| 1 BBP | Total Time: 0.326 seconds
CPU Utilization: 732.71% Multi-core Efficiency: 22.90% |
Total Time: 0.409 seconds
CPU Utilization: 572.93% Multi-core Efficiency: 17.90% |
Total Time: 0.470 seconds
CPU Utilization: 3120.43% Multi-core Efficiency: 97.51% |
Total Time: 0.633 seconds
CPU Utilization: 2549.88% Multi-core Efficiency: 79.68% |
Total Time: 1.008 seconds CPU Utilization: 1018.20% Multi-core Efficiency: 84.85% |
| 10 BBP | Total Time: 3.76 seconds
CPU Utilization: 3,120.43% Multi-core Efficiency: 97.51% |
Total Time: 4.401 seconds
CPU Utilization: 3091.30% Multi-core Efficiency: |
Total Time: 3.727 seconds
CPU Utilization: 3120.43% Multi-core Efficiency: 97.51% |
Total Time: 7.127 seconds
CPU Utilization: 3147.78% Multi-core Efficiency: 98.37% |
Total Time: 11.215 seconds
CPU Utilization: 1182.67% Multi-core Efficiency: 98.56% |
| 100 BBP | Total Time: 41.503 seconds
CPU Utilization: 3,187.87% Multi-core Efficiency: 99.62% |
Total Time: 48.752 seconds CPU Utilization: 3187.66% Multi-core Efficiency: 99.61% |
Total Time: 41.503 seconds
CPU Utilization: 3187.87% Multi-core Efficiency: 99.62% |
Total Time: 79.306 seconds
CPU Utilization: 3183.21% Multi-core Efficiency: 99.48% |
Total Time: 123.582 seconds
CPU Utilization: 1196.03% Multi-core Efficiency: 99.67% |
7Zip Compression Benchmark
The built-in memory benchmark in the 7-Zip utility measures the performance of a system’s CPU and memory during compression and decompression tasks, indicating how well the system can handle data-intensive operations. We run this test at a 128MB dictionary size when possible.
| 7-Zip Compression Benchmark (Higher is better) |
AMD Ryzen 9 9950X PBO (Zen5, 16c, 32t) |
AMD Ryzen 9 9950X (Zen5, 16c, 32t) |
AMD Ryzen 9 9900X (Zen5, 12c, 24t) | AMD Ryzen 9 7950X (Zen4, 16c, 32t) | AMD Ryzen 5 9600X (Zen5, 6c, 12t) |
| Current CPU Usage | 1235% | 1084% | 820% | 1298% | 368% |
| Current Rating / Usage | 14.050 GIPS | 16.001 GIPS | 19.773 GIPS | 14.623 GIPS | 26.461 GIPS |
| Current Rating | 173.536 GIPS | 173.498 GIPS | 162.127 GIPS | 189.811 GIPS | 97.375 GIPS |
| Resulting CPU Usage | 1211% | 1154% | 788% | 1175% | 407% |
| Resulting Rating / Usage | 14.436 GIPS | 14.988 GIPS | 20.868 GIPS | 16.207 GIPS | 24.057 GIPS |
| Resulting Rating | 174.506 GIPS | 172.068 GIPS | 163.593 GIPS | 189.471 GIPS | 97.146 GIPS |
| Current CPU Usage | 3128% | 3106% | 2366% | 3112% | 1190% |
| Current Rating / Usage | 8.879 GIPS | 8.515 GIPS | 8.885 GIPS | 8.635 GIPS | 8.736 GIPS |
| Current Rating | 277.706 GIPS | 264.436 GIPS | 210.178 GIPS | 269.481 GIPS | 103.977 GIPS |
| Resulting CPU Usage | 3111% | 3094% | 2361% | 3117% | 1186% |
| Resulting Rating / Usage | 8.868 GIPS | 8.555 GIPS | 8.907 GIPS | 8.676 GIPS | 8.765 GIPS |
| Resulting Rating | 275.894 GIPS | 264.716 GIPS | 210.257 GIPS | 270.429 GIPS | 103.924 GIPS |
| Total CPU Usage | 2161% | 2124% | 1574% | 2146% | 797% |
| Total Rating/Usage | 11.652 GIPS | 11.771 GIPS | 14.888 GIPS | 12.441 GIPS | 16.411 GIPS |
| Total Rating | 225.200 GIPS | 218.392 GIPS | 186.925 GIPS | 229.950 GIPS | 100.535 GIPS |
Blender OptiX
Blender OptiX is an open-source 3D modeling application. This benchmark was run using the Blender Benchmark CLI utility. The score is samples per minute, with higher being better.
| Blender 4.0 CPU Samples Per Minute (Higher is Better) |
AMD Ryzen 9 9950X PBO (Zen5, 16c, 32t) |
AMD Ryzen 9 9950X (Zen5, 16c, 32t) |
AMD Ryzen 9 9900X (Zen5, 12c, 24t) | AMD Ryzen 9 7950X (Zen4, 16c, 32t) | AMD Ryzen 5 9600X (Zen5, 6c, 12t) |
| Monster | 285.489 | 266.409 | 212.207 | 247.919 | 100.927 |
| Junkshop | 201.311 | 192.041 | 153.177 | 176.527 | 73.173 |
| Classroom | 142.251 | 137.069 | 107.86 | 124.462 | 51.277 |
UL Procyon
UL’s Procyon AI Inference benchmark suite tests how various AI inference engines perform using state-of-the-art neural networks. We ran these tests only on the CPU. Each number is an average inference time, where lower is better, with the last row providing an overall score where higher is better.
| UL Procyon Average | AMD Ryzen 9 9950X (Zen5, 16c, 32t) |
AMD Ryzen 9 9900X (Zen5, 12c, 24t) | AMD Ryzen 9 7950X (Zen4, 16c, 32t) | AMD Ryzen 5 9600X (Zen5, 6c, 12t) |
| MobileNet V3 | 1.03ms | 1.17ms | 1.09ms | 0.53ms |
| ResNet 50 | 5.59ms | 5.23ms | 5.90ms | 6.35ms |
| Inception V4 | 14.86ms | 15.48ms | 18.56ms | 18.47ms |
| DeepLab V3 | 21.49ms | 27.28ms | 23.36ms | 24.76ms |
| YOLO V3 | 26.83ms | 32.63ms | 35.31ms | 45.25ms |
| REAL-ESRGAN | 2,029.39ms | 2,053.09ms | 2,032.24ms | 2,512.66ms |
| Overall Score (Higher is better) |
232 | 211 | 206 | 211 |
Blackmagic RAW
The Blackmagic RAW Speed Test performance benchmarking tool measures a system’s capabilities in handling video playback and editing using the Blackmagic RAW codec. It evaluates how well a system can decode and play back high-resolution video files, providing frame rates for both CPU- and GPU-based processing.
| Blackmagic RAW (Higher is Better) | AMD Ryzen 9 9950X PBO (Zen5, 16c, 32t) |
AMD Ryzen 9 9950X (Zen5, 16c, 32t) |
AMD Ryzen 9 9900X (Zen5, 12c, 24t) | AMD Ryzen 9 7950X (Zen4, 16c, 32t) | AMD Ryzen 5 9600X (Zen5, 6c, 12t) |
| 8K CPU | 101 FPS | 101 FPS | 98 FPS | 111 FPS | 52 FPS |
| 8K OPENCL | 119 FPS | 120 FPS | 134 FPS | 48 FPS | 119 FPS |
Closing Thoughts
The transition from Zen4 to Zen5 with the AMD Ryzen 9 9950X and 9900X brings noticeable improvements in specific workloads, particularly those that benefit from architectural enhancements such as AVX-512 support and the updated memory overclocking capabilities. The non-PBO performance gains of the Ryzen 9 9950X over its predecessor, the 7950X, are present but perhaps not as substantial as some may have hoped, especially considering the generational leap. The benchmarks reflect that while the Zen5 architecture offers meaningful upgrades, the performance uplift in everyday tasks is modest compared to what we witnessed in the jump from Zen3 to Zen4.
The incentive to upgrade might be less compelling for users already on an AM5 platform, especially those with a 7950X unless their specific workloads can fully leverage the new architectural features. However, for those from lower-tier CPUs or older platforms, the 9950X and 9900X offer a robust combination of performance and efficiency that justifies the investment.
I specifically want to call out the BBP Benchmark here in the conclusion as an illustration of what Software Optimization is, and why it is important.
| Benchmark | AMD Ryzen 9 9950X PBO (Zen5, 16c, 32t) | AMD Ryzen 9 9950X (Zen5, 16c, 32t) | AMD Ryzen 9 7950X (Zen4, 16c, 32t) |
| 1 BBP | Total Time: 0.326 seconds | Total Time: 0.409 seconds | Total Time: 0.633 seconds |
| 10 BBP | Total Time: 3.76 seconds | Total Time: 4.401 seconds | Total Time: 7.127 seconds |
| 100 BBP | Total Time: 41.503 seconds | Total Time: 48.752 secondsCPU | Total Time: 79.306 seconds |
Ultimately, the Ryzen 9 9950X and 9900X stand as solid choices in AMD’s lineup, showcasing Zen5’s evolutionary progress. Yet, for many, especially those already enjoying the benefits of a 7950X, the need to upgrade may not feel urgent unless their use cases demand the cutting-edge enhancements that Zen5 brings to the table.
TL;DR: If you have a 7700X or lower or any AM4 platform and are willing to spend the coin on the flagship upgrade, it’s a no-brainer. For those complaining about gaming performance or whatever, all I have to say is, “What is Workload Optimization for $100, Alex?”
Engage with StorageReview
Newsletter | YouTube | Podcast iTunes/Spotify | Instagram | Twitter | TikTok | RSS Feed