
Good for read-heavy workloads, but weak write performance limits versatility in AI and data-intensive environments.
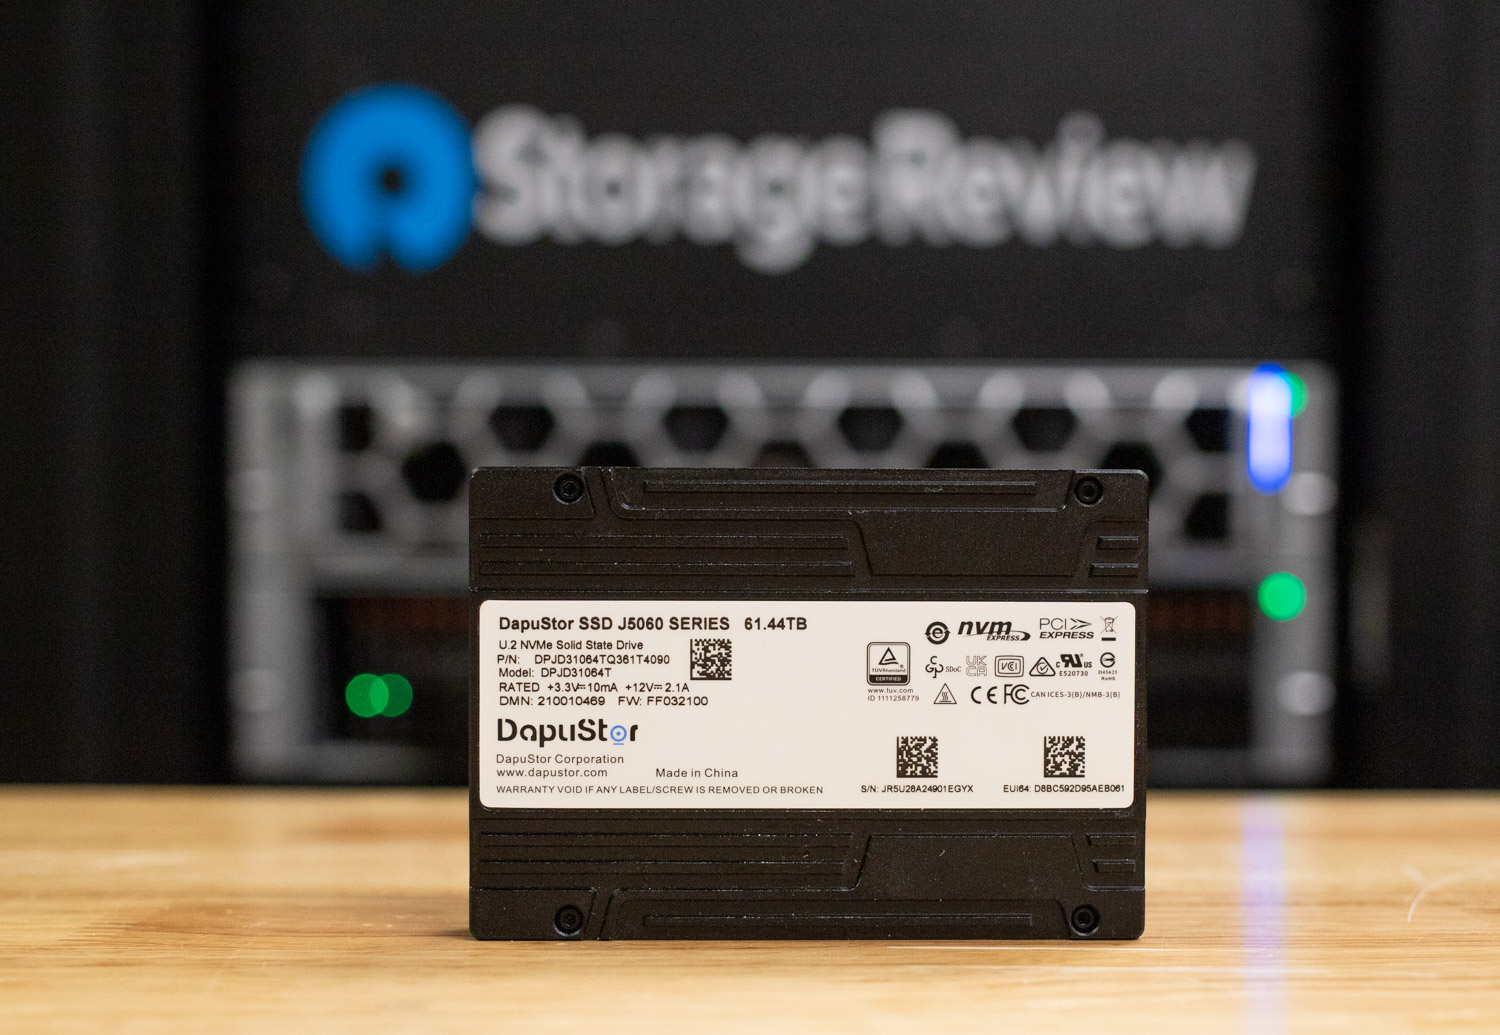
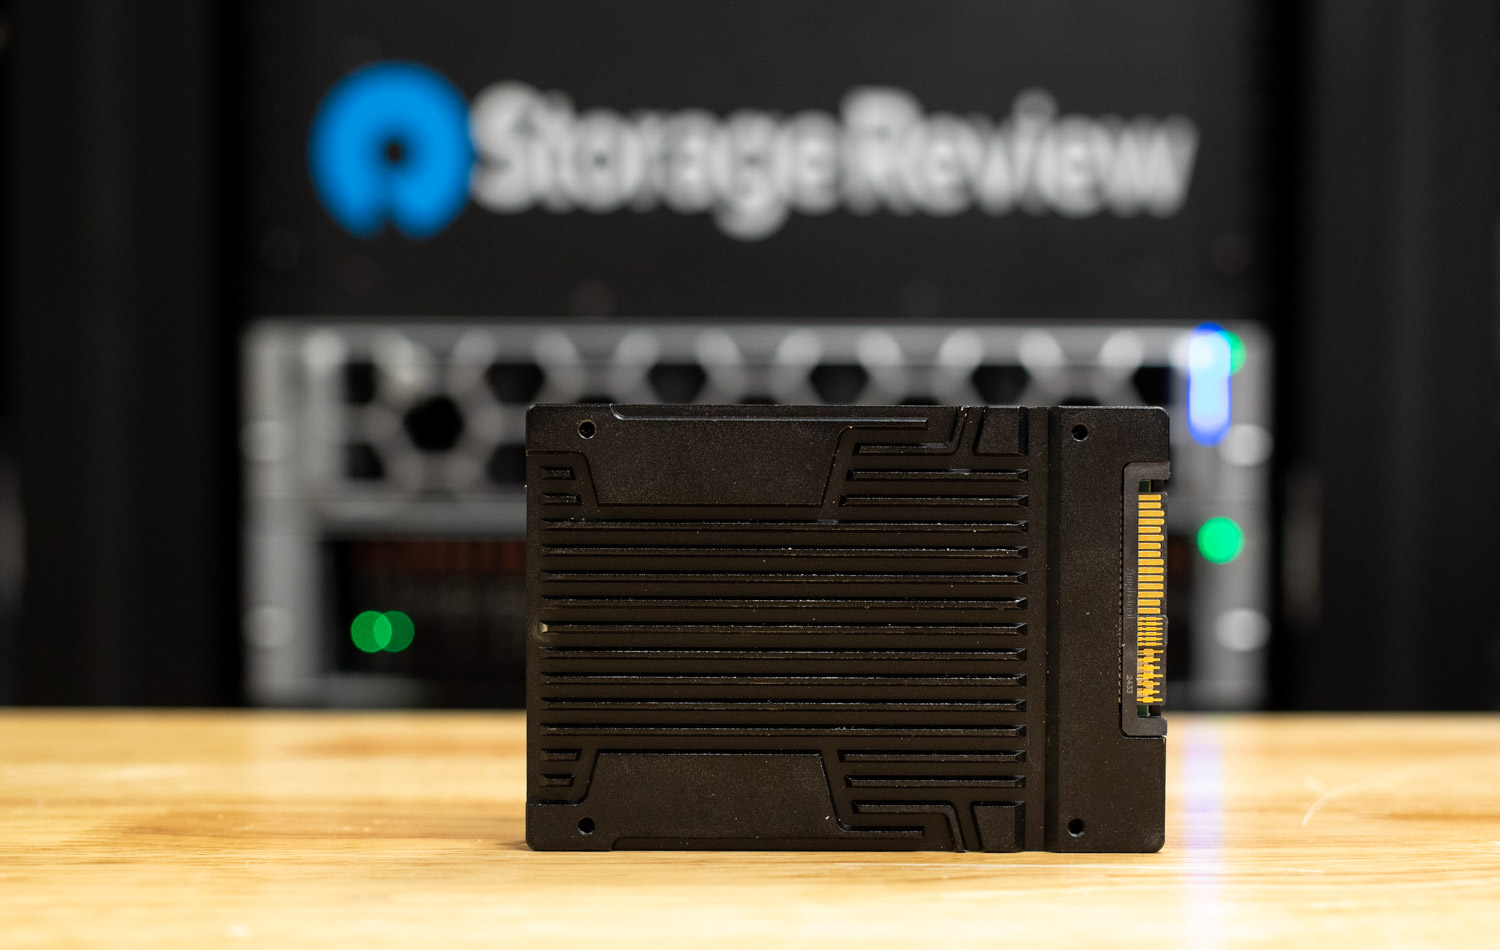
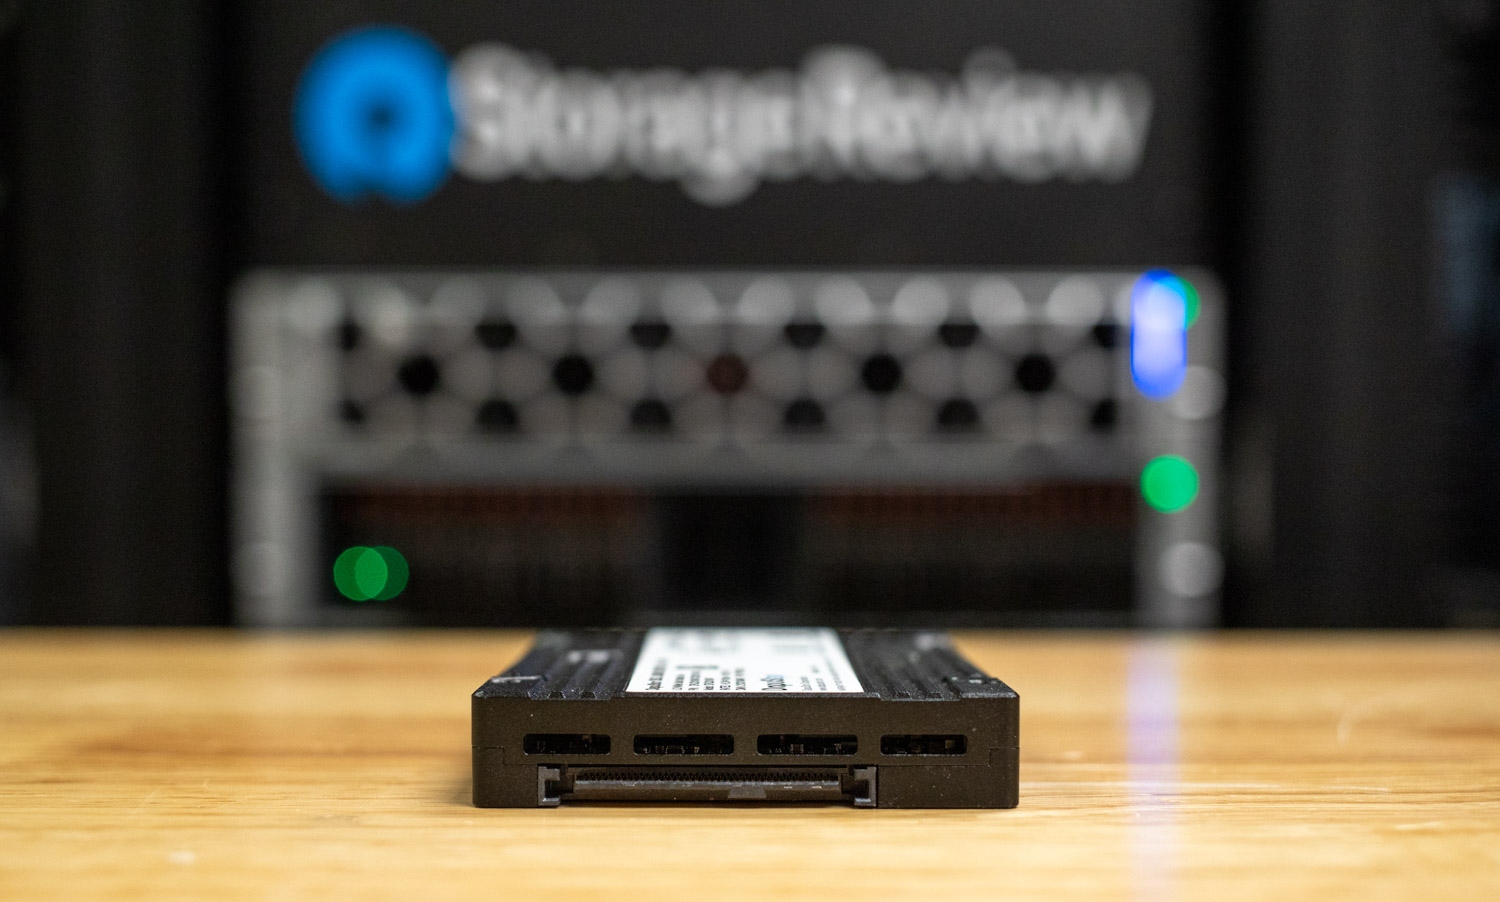
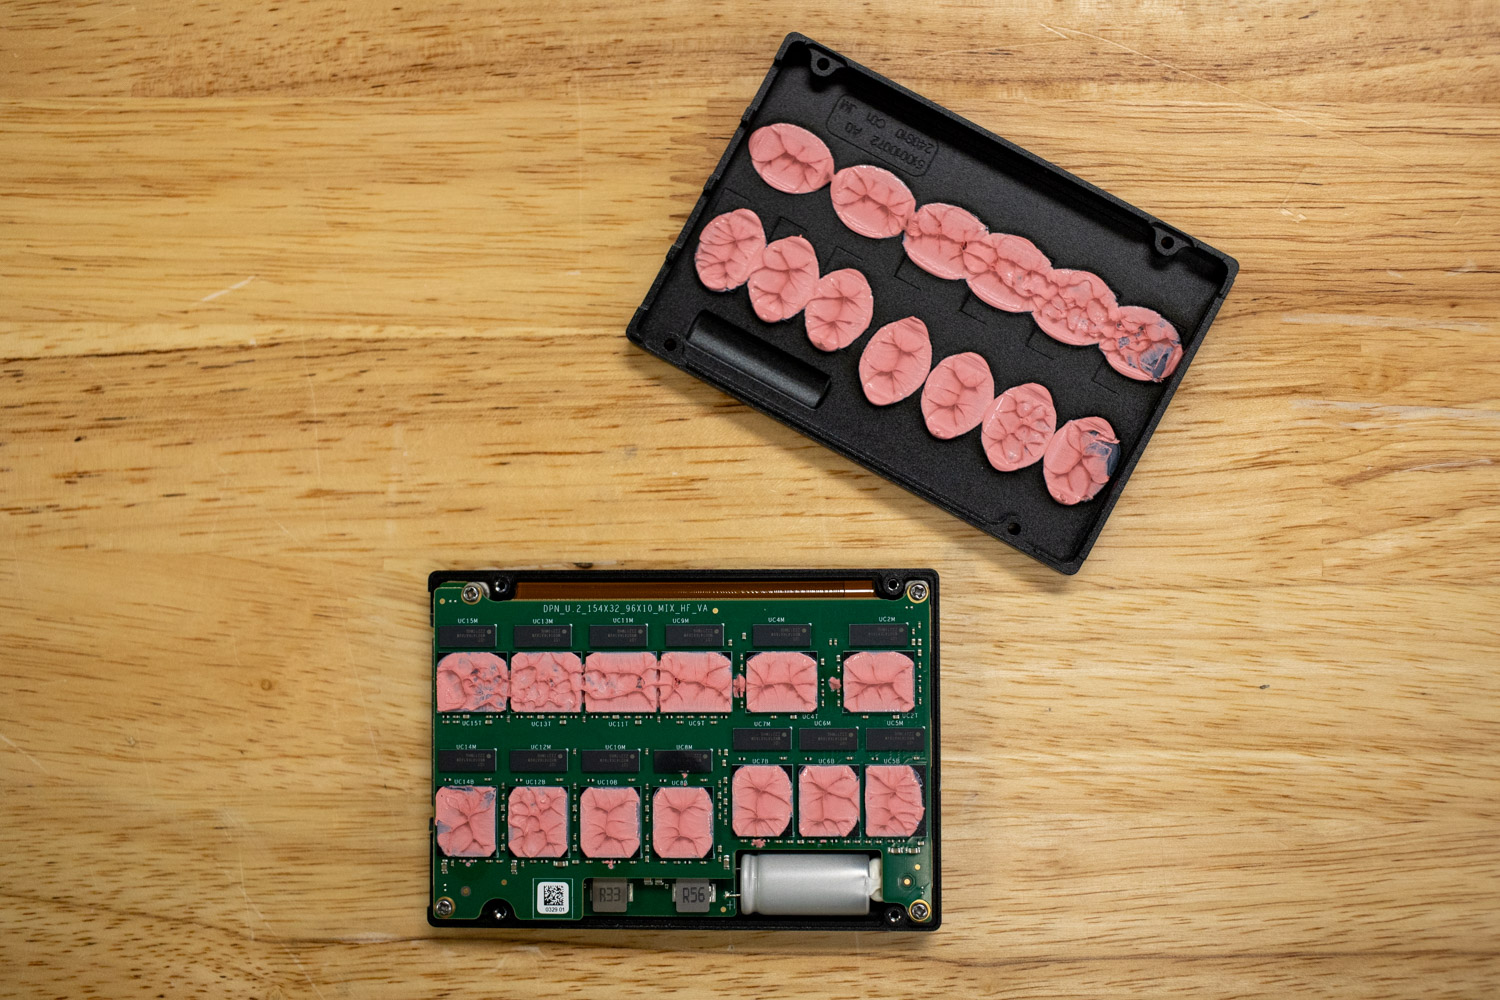
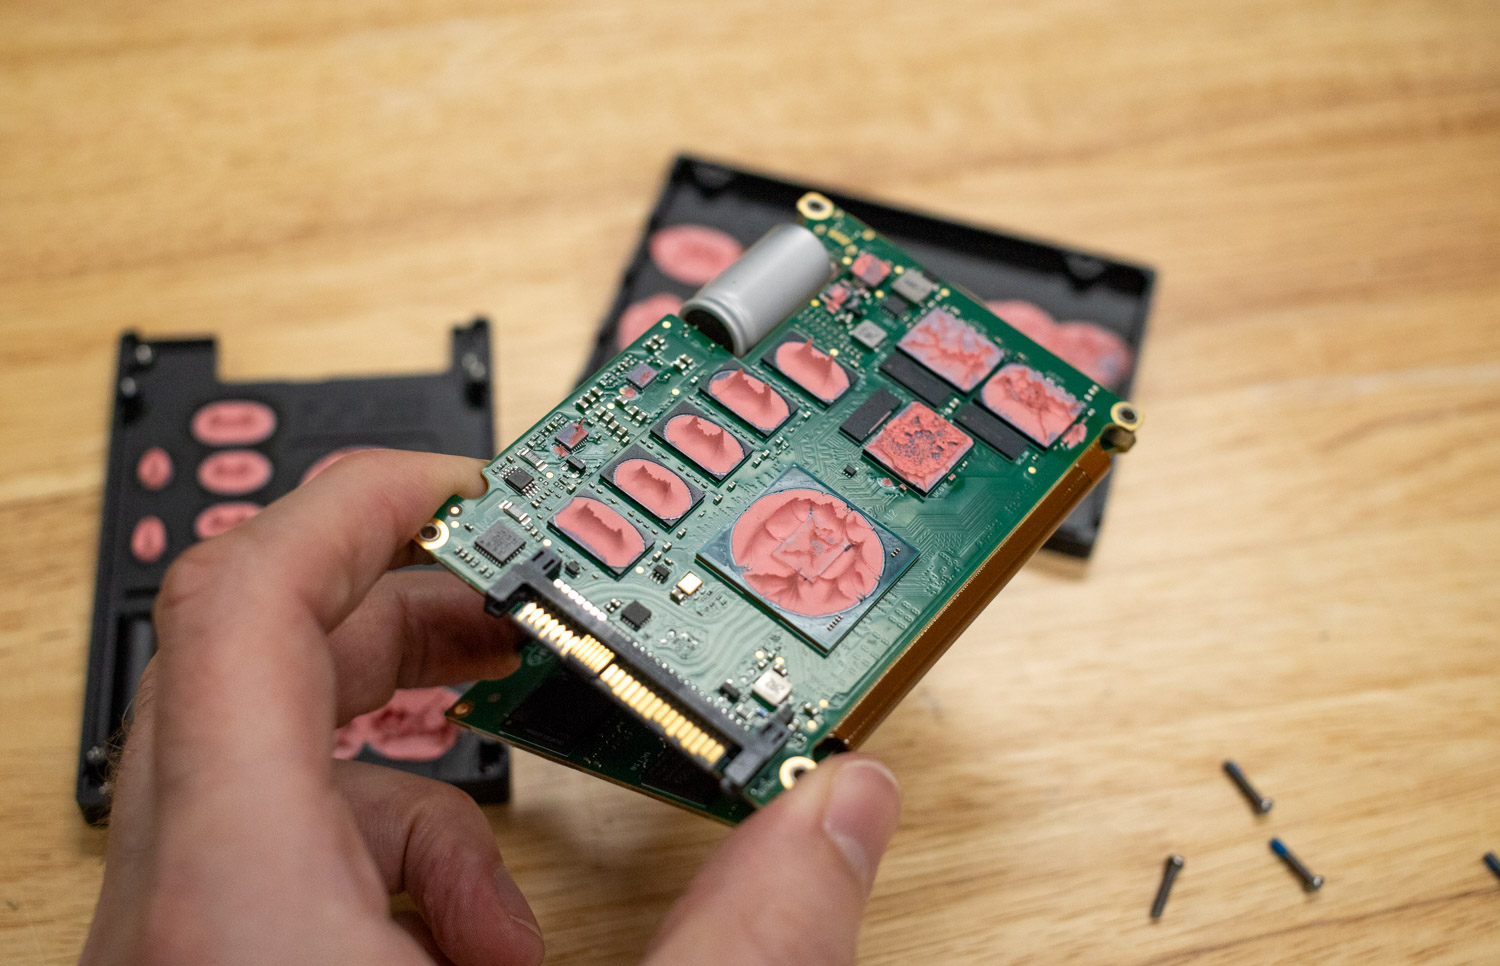
The DapuStor J5060 SSD is a high-capacity, enterprise-focused NVMe drive built to address the increasing demand for dense, power-efficient storage in data-heavy environments. It’s based on 3D Enterprise QLC NAND Flash and supports the PCIe 4.0 x4 interface with NVMe 1.4a, housed in a standard U.2 15mm form factor. The drive is positioned for workloads where read performance and cost-per-terabyte are prioritized, making it potentially suitable for applications like cloud infrastructure, AI inference, big data platforms, and intelligent manufacturing pipelines where write operations are relatively infrequent or predictable.
DapuStor J5060 Features and Performance Profile
With capacities scaling up to 61.44TB, the J5060 provides an interesting solution for organizations looking to consolidate storage while keeping physical density and power draw in check. This capacity level in a single U.2 drive is particularly relevant for hyperscale and enterprise environments managing multi-petabyte datasets, where rack space and energy efficiency are real constraints. The J5060 includes enterprise-grade features such as dual-port support, advanced power-loss protection, and flash-level voltage optimization to help ensure data integrity and stability across high-availability deployments.
Regarding its performance, the J5060 is specced for read-heavy workloads. It is quoted up to 7,300MB/s sequential read throughput and supports up to 1.5 million 4K random read IOPS, which is strong for a QLC-based drive. However, its write performance is significantly more limited, with a spec of just 30K IOPS for 16KB random writes, and this limitation is consistent throughout our workload testing. The drive’s write bandwidth is rated at 3,000MB/s. However, that does not hold up well under sustained or high-depth write operations, which may impact its suitability for mixed or write-intensive tasks.
Using QLC NAND enables DapuStor to deliver these high capacities at a lower cost, but with trade-offs. Endurance is rated at just 0.5 DWPD (Drive Writes Per Day) over five years, making the J5060 best suited for read-centric applications with low to moderate write volumes. Workloads that involve frequent checkpointing, transaction logging, or active caching may stress the drive’s endurance and reveal limitations in write performance.
For power, the drive draws approximately 12 watts during reads, up to 23 watts during writes, and just 5 watts at idle. These figures align well with modern enterprise data center expectations, especially for high-density deployments where power-per-terabyte is a growing concern.
In this review, we focus on the 61.44TB model and will examine its real-world performance profile through a series of synthetic and application-aligned workloads.
DapuStor J5060 Specifications
| J5060 | |
|---|---|
| Capacity (TB) | 61.44 |
| Form Factor | U.2 15mm |
| Interface | PCIe 4.0 x4, NVMe 1.4a, Dual-port supported |
| Read/Write Bandwidth (128K) MB/s | 7400 / 3000 |
| Random Read/Write (4KB) K IOPS | 1500 / 30 (16KB) |
| 4K Random Latency (Typ.) R/W µs | 105 (4KB) / 33 (16KB) |
| 4K Sequential Latency (Typ.) R/W µs | 7 (4KB) / 12 (16KB) |
| Typical Power (W) | 23 |
| Idle Power (W) | 5 |
| Flash Type | 3D Enterprise QLC NAND Flash |
| Endurance | 0.5 DWPD |
| MTBF | 2 million hours |
| UBER | 1 sector per 10^17 bits read |
| Warranty | 5 yrs |
DapuStor J5060 Performance
Checkpointing
To evaluate the Dapustor J5060 SSD’s real-world performance in AI training environments, we utilized the Data and Learning Input/Output (DLIO) benchmark tool. Developed by Argonne National Laboratory, DLIO is specifically designed to test I/O patterns in deep learning workloads. It provides insights into how storage systems handle checkpointing, data ingestion, and model training challenges. The chart below illustrates how both drives handle the process across 99 checkpoints. When training machine learning models, checkpoints are essential for saving the model’s state periodically to prevent loss of progress during interruptions or power failures. This storage demand requires robust performance, especially under sustained or intensive workloads.
The platform chosen for this work was our Dell PowerEdge R760 running Ubuntu 22.04.02 LTS. We used DLIO benchmark version 2.0 from the August 13, 2024, release. Our system configuration is outlined below:
- 2 x Intel Xeon Gold 6430 (32-Core, 2.1GHz)
- 16 x 64GB DDR5-4400
- 480GB Dell BOSS SSD
- Serial Cables Gen5 JBOF
- 61.44TB Dapustor J5060
- 61.44TB Solidigm D5-P5336
To ensure our benchmarking reflected real-world scenarios, we based our testing on the LLAMA 3.1 405B model architecture, implementing checkpointing through torch.save() to capture model parameters, optimizer states, and layer states. Our setup simulated an 8-GPU system, implementing a hybrid parallelism strategy with 4-way tensor parallel and 2-way pipeline parallel processing distributed across the eight GPUs. This configuration resulted in checkpoint sizes of 1,636 GB, representative of modern large language model training requirements.
Overall, the Dapustor J5060 demonstrated solid consistency during the initial phase of testing, with times hovering around 575.66 seconds for the first 33 checkpoints. The 5060J was able to maintain higher performance before the drive was filled the first time. On the other hand, the Solidigm P5336, while generally slower than the J5060 early on, demonstrated much consistent performance as testing continued.
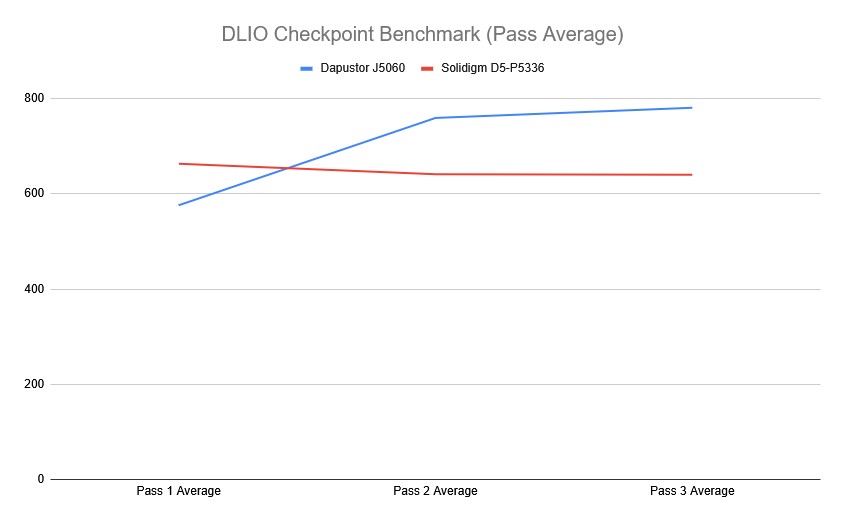
When we consider the overall averages, the Dapustor J5060 posted a time of 769.44 seconds, while the Solidigm P5336 finished with 640.17 seconds. This puts the Solidigm P5336 ahead in terms of saving checkpoints faster.
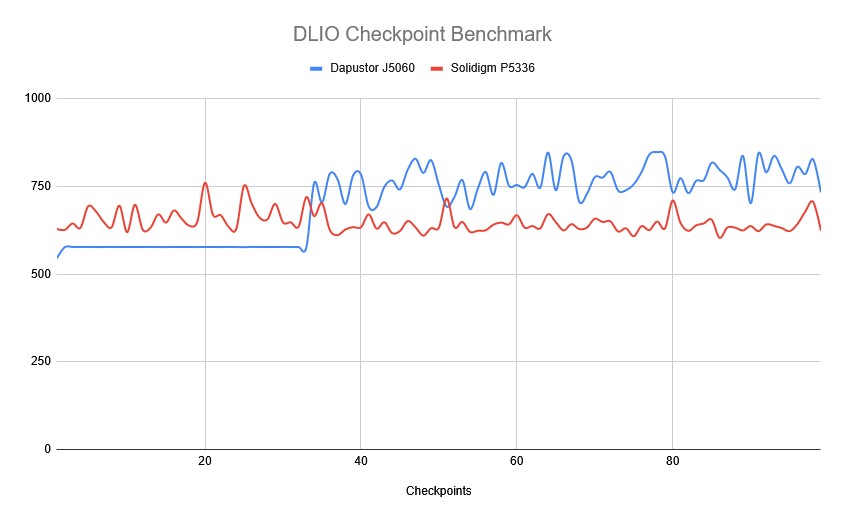
Overall, the Dapustor J5060 handles shorter operations well but falters past 30 minutes of sustained writes. Meanwhile, the Solidigm P5336 is the better drive for consistent performance throughout prolonged tasks. This weaker write performance from the Dapustor J5060 is evident when its checkpointing speed deteriorates as the test continues.
GPU Direct Storage
GPU Direct Storage is a technology that enables direct data transfer between storage devices and GPUs, bypassing the CPU and system memory. In traditional data transfer, data is read from storage into the CPU’s memory and then copied to the GPU’s memory. This process involves multiple data copies, leading to increased latency and reduced performance. The CPU acts as a bottleneck, needing to handle the data transfer between storage and the GPU. GDS eliminates this bottleneck by directly allowing storage devices to transfer data to and from the GPU’s memory.
We systematically tested every combination of the following parameters in both read and write workloads:
- Block Sizes: 1M, 128K, 16K
- IODepth: 128, 64, 32, 16, 8, 4, 1
As we review our GDSIO results, we examine the read and write performance of the 61.44TB Dapustor J5060 and Solidigm P5336.
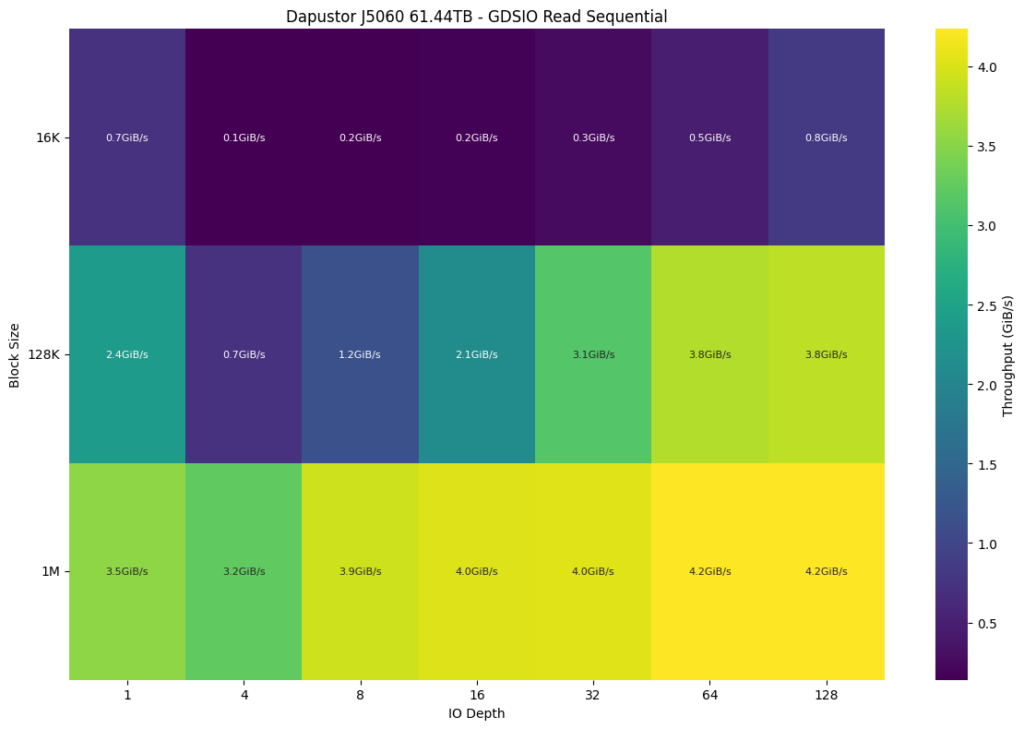
GDSIO Sequential Read Performance
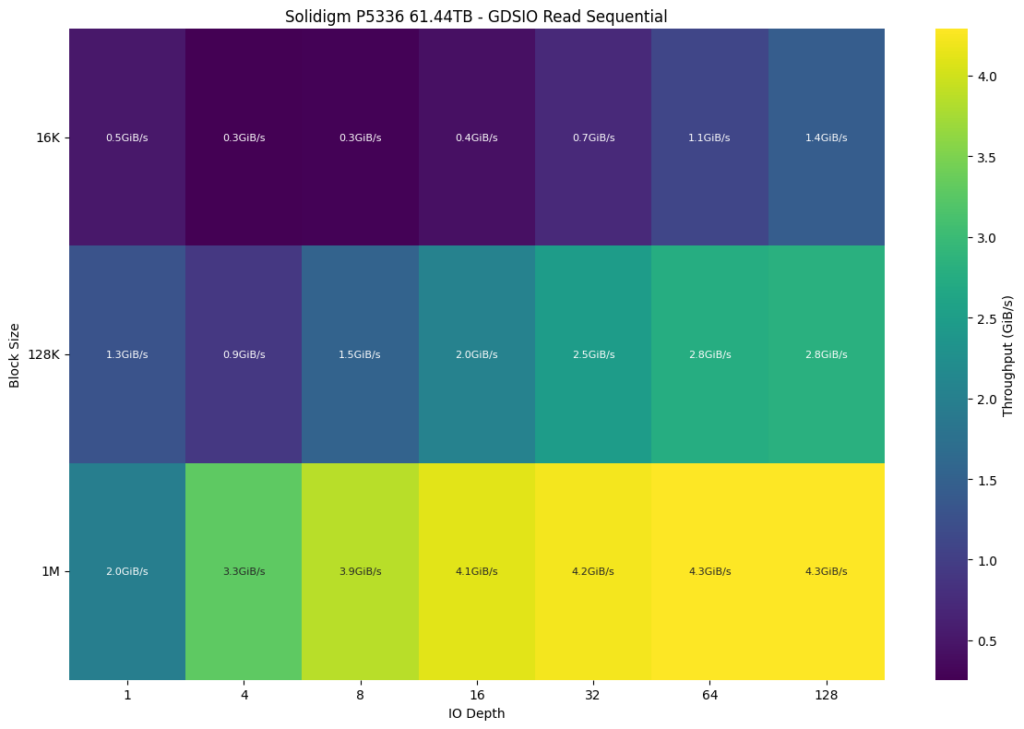
The Dapustor J5060 achieves a peak read throughput of 4.2 GiB/s at a 1M block size with IO depths of 64 and 128. At the smallest block size (16K), performance ranges from 0.1 GiB/s to 0.8 GiB/s as IO depth increases. This shows a clear preference for larger block sizes with high IO depths for optimal throughput. The peak performance is achieved at large block sizes, indicating the drive’s efficiency in handling bulk data transfers.
Comparatively, the Solidigm P5336 reached a similar maximum throughput of 4.3 GiB/s at the same block size (1M) but achieved that performance earlier at IO depth 32 and maintained it consistently at higher IO depths. This suggests slightly better efficiency in handling large block sizes at a broader range of IO depths for the Solidigm P5336.
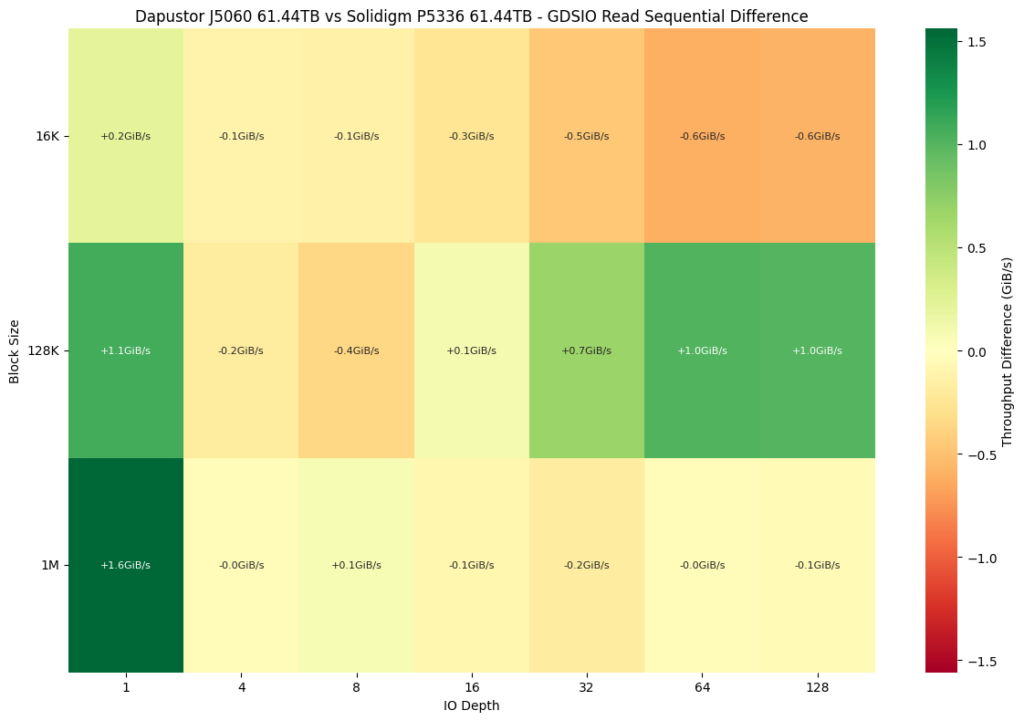
To give a better comparative view, we have a differential chart comparing both drives. A greener shade block shows an advantage of the Dapustor SSD, while a block moving to the red side of the spectrum shows a weakness. Here, the J5060 outperforms the P5336 in the 128K block size with the exception of the 4 through 8 IO depths. However, throughput drops are noted at higher IO depths with block sizes 16K and 1M, indicating less efficiency in those scenarios.
In the sequential read latency comparison, the Solidigm P5336 consistently maintains lower latency than the Dapustor J5060 across nearly all block sizes and IO depths. At a 16K block size, the gap becomes more pronounced as queue depth increases: the J5060 peaks at 2329 μs at depth 128, while the P5336 stays lower at 1365 μs. At 128K, Solidigm again leads across most depths, with the exception at high loads (4,080 μs on the J5060 versus 5539 μs on the P5336) at depth 128. At the 1M block size, both drives see latency climb as expected, but the P5336 remains slightly better controlled, with 29,138 μs versus 29,512 μs at the highest queue depth.

GDSIO Sequential Write Performance
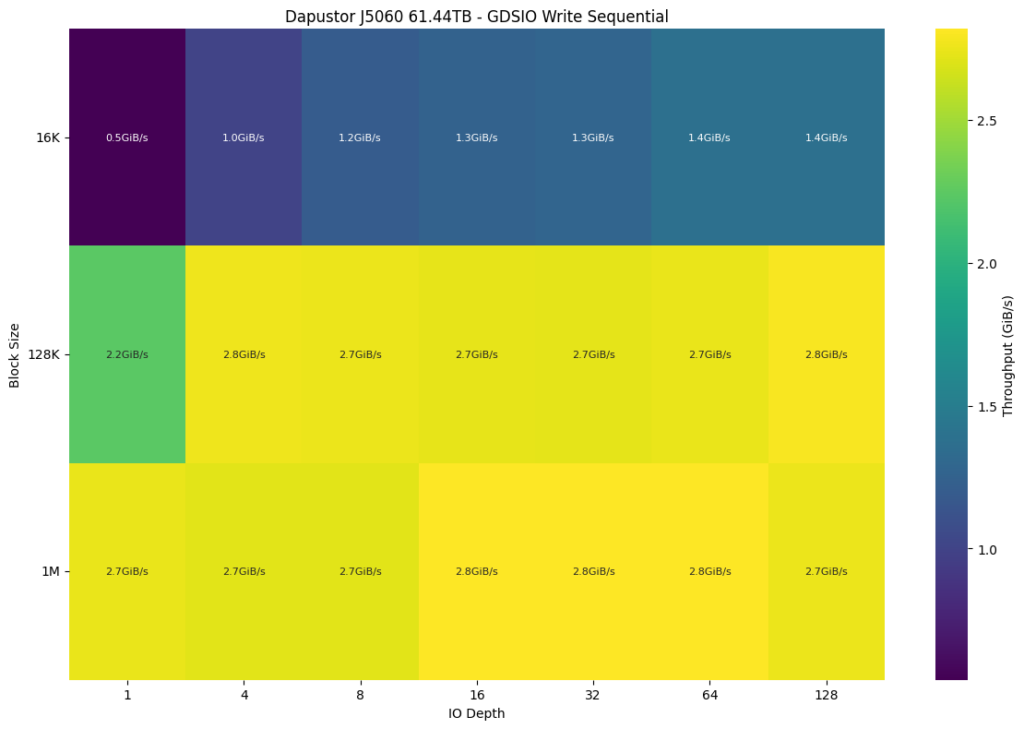
The Dapustor J5060 shows a consistent write throughput of 2.7 to 2.8 GiB/s for 128K and 1M block sizes across all IO depths (except 128K, 1 IO depth size, which posted 2.2GiB/s. For 16K block sizes, performance ranges from 0.5 GiB/s to 1.4 GiB/s, depending on IO depth, peaking at 1.4 GiB/s at higher IO depths.
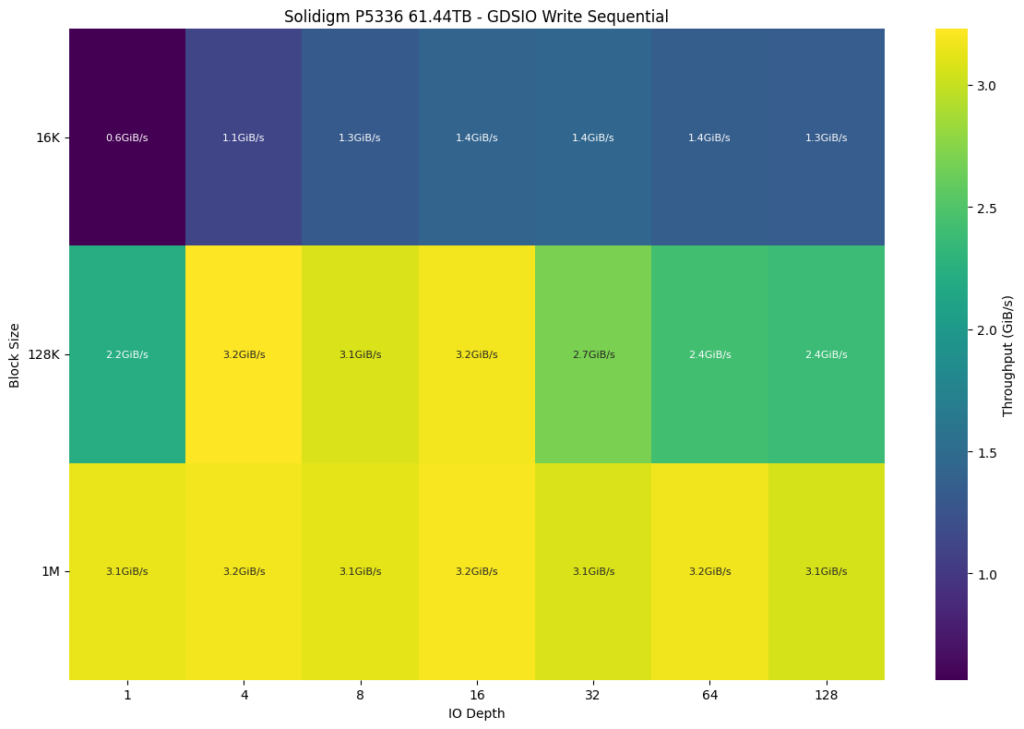
In comparison, the Solidigm P5336 performs better during 128K and 1M block sizes, peaking at 3.2GiB/s. For smaller block sizes (16K), the Solidigm P5336 also shows higher performance with a peak of 1.4 GiB/s at IO depths 16 to 64. This indicates that the Solidigm P5336 is slightly more efficient with smaller block sizes during write operations.
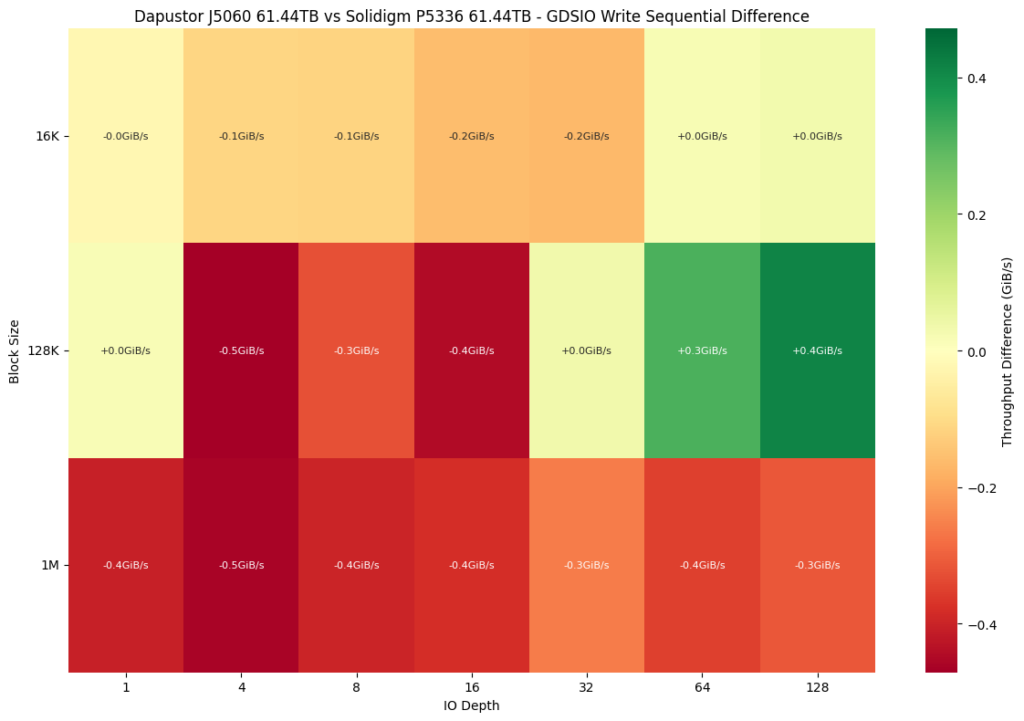
Moving to a differential view, we see a larger gap opening between the Dapustor J5060 and the write performance of the Solidigm P5336. Our throughput comparison shows the J5060 falling behind the P5336 in most areas, particularly with large block sizes (1M) across all IO depths. Throughput drops reach -0.5 GiB/s at the 4 IO depths. While there are performance gains at higher IO depths with the 128K block sizes, they are not significant enough to offset the broader underperformance.
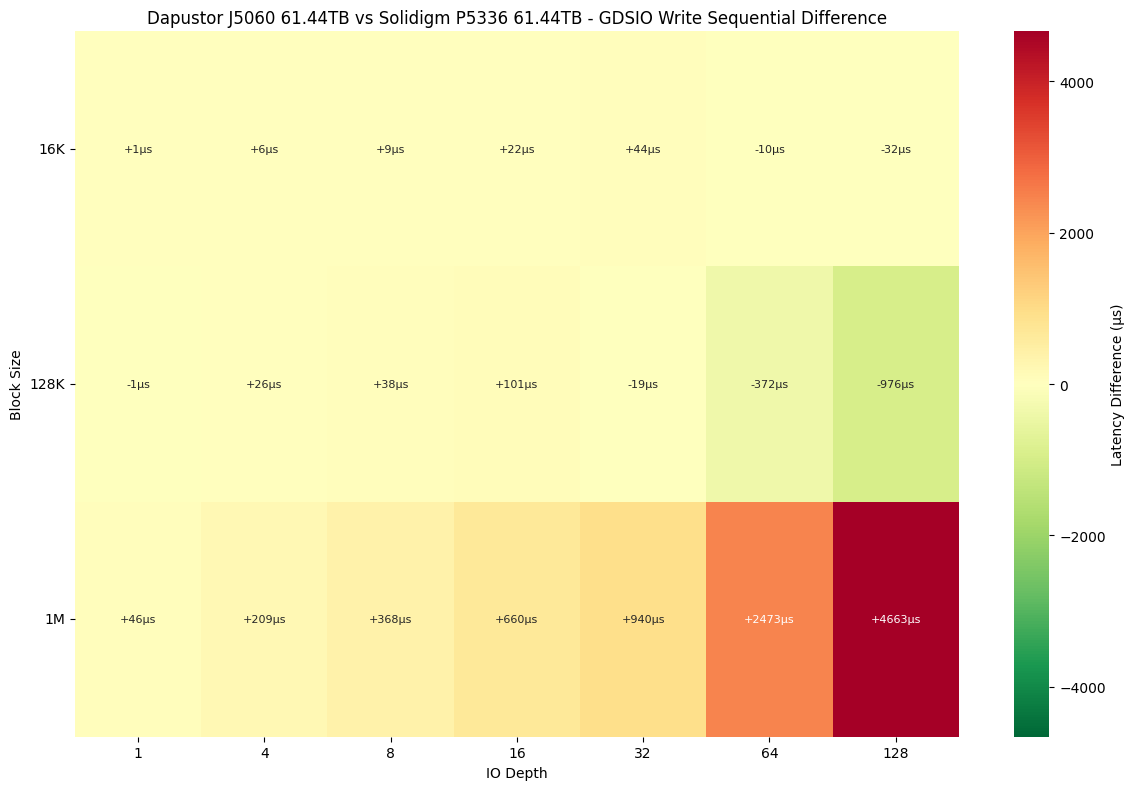
When comparing sequential write latency between the Dapustor J5060 and Solidigm P5336, both drives show similar behavior at smaller block sizes like 16K, with Solidigm holding a slight edge at lower IO depths, while Dapustor closes the gap at higher depths (64 and 128). At 128K block sizes, Solidigm again leads at shallow queue depths, but Dapustor consistently delivers lower latency as IO depth increases, indicating better scaling under load. However, with 1M block sizes, Solidigm maintains a clear latency advantage across all IO depths, showing significantly faster response times under heavy sequential write workloads. Overall, Solidigm performs more consistently, while Dapustor’s strength is more visible at mid-sized blocks and deeper queues.
FIO Workload Summary
Flexible I/O Tester (FIO) is an industry-standard benchmarking tool used to measure the performance of storage devices under a wide variety of workload scenarios. Trusted for its versatility and reliability, FIO simulates real-world conditions, providing insights into an SSD’s capabilities and performance limits. StorageReview leverages FIO to offer comprehensive analyses, measuring throughput, latency, and IOPS across workload patterns, block sizes, and queue depths.
Workloads applied:
- 128K Sequential Read and Write
- 64K Random Reads and Writes
- 16K Random Reads and Writes
- 4K Random Reads and Writes
These workloads represent a broad spectrum of enterprise use-cases, including large sequential transfers, intensive random I/O typical in databases, and small-block random accesses commonly seen in virtualized environments.
This performance section summarizes the Dapustor J5060’s performance across key synthetic workloads, including sequential and random read/write operations at varying block sizes and queue depths. Metrics are extracted directly from parsed fio output and include bandwidth (MB/s), IOPS, and latency percentiles up to 99.9999%, offering insight into both throughput and tail behavior under load.
128K Sequential Read and Write Performance
| Drive | Thread/IO Depth | BW (MB/s) | IOPS | 99.0% | 99.9% | 99.99% |
|---|---|---|---|---|---|---|
| Dapustor J5060 | 1T/64Q | 7,482 | 57,081 | 1.66 ms | 2.02 ms | 2.83 ms |
| Solidigm P5336 | 1T/64Q | 7,479 | 57,057 | 1.51 ms | 1.66 ms | 1.81 ms |
| Dapustor J5060 | 1T/16Q | 3,023 | 23,063 | 0.69 ms | 0.69 ms | 0.70 ms |
| Solidigm P5336 | 1T/16Q | 3,364 | 25,669 | 2.67 ms | 3.48 ms | 4.42 ms |
The Dapustor J5060 delivers impressive sequential read performance at 128K, reaching 7.48GB/s with tight latency control, even at higher percentiles. Compared to the Solidigm P5336, the J5060’s throughput is essentially identical (7.48GB/s vs. 7.47GB/s). However, Solidigm maintains a slight edge in latency consistency, showcasing marginally lower tail latency.
At 128K sequential writes (QD16), the J5060 achieves solid performance of 3,023MB/s with very low latency. Yet, the Solidigm P5336 surpasses this by a moderate margin, hitting 3,364MB/s, though at a notably higher latency, especially at the 99.99% percentile (4.42ms vs. Dapustor’s remarkably low 0.70ms). This indicates the J5060 is a stronger candidate for latency-sensitive sequential write scenarios.
64K Random Read and Write Performance
| Drive | IO Depth | BW (MB/s) | IOPS | 99.0% | 99.9% | 99.99% |
|---|---|---|---|---|---|---|
| Dapustor J5060 | 8T/32Q | 7,475 | 114,058 | 20.05 ms | 21.89 ms | 25.82 ms |
| Solidigm P5336 | 8T/32Q | 7,472 | 114,014 | 21.36 ms | 21.89 ms | 22.68 ms |
| Dapustor J5060 | 8T/32Q | 534 | 8,151 | 574.6 ms | 708.8 ms | 742.39 ms |
| Solidigm P5336 | 8T/32Q | 857 | 13,070 | 196.1 ms | 208.6 ms | 221.24 ms |
In 64K random reads (QD256), the Dapustor J5060 excels with throughput near 7.4GB/s and well-controlled latency. Solidigm’s results closely match (7.47GB/s), with slightly better maximum percentile latency. Both drives perform exceptionally here, with minimal practical differences.
Write performance at 64K random is where the J5060 noticeably struggles, with throughput dropping sharply to 534MB/s and latency rising significantly (742.39ms at 99.99%). In comparison, the Solidigm P5336 significantly outperforms the J5060, delivering 857MB/s and drastically lower latency (221.24ms at the same percentile), making it far better suited for applications sensitive to latency and sustained write throughput.
16K Random Read and Write Performance
| Drive | IO Depth | BW (MB/s) | IOPS | 99.0% | 99.9% | 99.99% |
|---|---|---|---|---|---|---|
| Dapustor J5060 | 8T/32Q | 7,430 | 453,461 | 5.28 ms | 6.39 ms | 8.16 ms |
| Solidigm P5336 | 8T/32Q | 7,431 | 453,527 | 5.01 ms | 5.21 ms | 5.47 ms |
| Dapustor J5060 | 8T/32Q | 531 | 32,404 | 143.65 ms | 149.94 ms | 181.40 ms |
| Solidigm P5336 | 8T/32Q | 847 | 51,724 | 57.9 ms | 65.8 ms | 71.8 ms |
At the 16K random read workload (QD256), the Dapustor achieves excellent results with 453K IOPS and controlled latency. The Solidigm P5336 essentially mirrors this performance, slightly edging out the Dapustor in latency (5.47ms vs. 8.16ms at 99.99%), suggesting slightly better latency consistency for Solidigm in heavy random read scenarios.
The Dapustor SSD’s 16K random write performance drops significantly to 32K IOPS, and latency increases to 181.4ms (99.99%). Here again, Solidigm significantly outpaces the Dapustor drive, delivering 51.7K IOPS and a dramatically improved latency profile (71.8ms at 99.99%), underscoring Solidigm’s advantage for latency-sensitive random write workloads.
4K Random Read and Write Performance
| Drive | IO Depth | BW (MB/s) | IOPS | 99.0% | 99.9% | 99.99% |
|---|---|---|---|---|---|---|
| Dapustor J5060 | 8T/32Q | 6,941 | 1,694,464 | 1.43 ms | 1.58 ms | 1.79 ms |
| Solidigm P5336 | 8T/32Q | 3,994 | 975,108 | 2.31 ms | 2.41 ms | 2.64 ms |
| Dapustor J5060 | 8T/32Q | 131 | 31,923 | 143.65 ms | 145.75 ms | 179.31 ms |
| Solidigm P5336 | 8T/32Q | 197 | 48,030 | 58.5 ms | 64.2 ms | 68.7 ms |
The 4K random read scenario is a highlight for the Dapustor J5060, with peak performance exceeding 1.69 million IOPS at QD256, combined with impressively low latency. In comparison, the Solidigm P5336 lags significantly behind, managing only 975K IOPS with notably higher latency at all percentiles. For intensive small-block random reads, the Dapustor J5060 is clearly the superior choice.
Unfortunately, the J5060’s 4K random write performance severely drops off, producing just 131MB/s and 31.9K IOPS with high latency (179.31ms at 99.99%). The Solidigm SSD more comfortably handles this scenario, delivering 197MB/s, 48K IOPS, and far lower tail latency (68.7ms at 99.99%). Despite Solidigm also experiencing latency spikes, it remains a much stronger drive for demanding 4K random write workloads.
Conclusion
Ultimately, the DapuStor J5060 is a high-capacity enterprise QLC SSD designed for read-intensive workloads where storage density and cost per terabyte take priority over sustained write performance. With capacities up to 61.44TB and a PCIe Gen4 interface, it’s best suited for environments like content delivery networks, cloud archives, or AI inference systems that rely on large sequential reads and infrequent writes.
With that target in mind, we put the J5060 through various tests to see how it holds up in practice, particularly against the Solidigm P5336. The J5060 delivers solid sequential read performance and offers high-density storage that might work well in read-heavy environments. In some cases, particularly at lower IO depths and larger block sizes, the J5060 outperforms the Solidigm P5336. Its latency and throughput in these scenarios show that it’s been built to prioritize large block read efficiency.
However, performance takes a huge hit when looking at write activity. Across nearly every write metric (including IOPS, latency, and throughput), the J5060 consistently underperforms. This weakness is most visible under sequential write pressure at high IO depths and large block sizes, where latency is quite high and throughput flattens. Even during AI-related checkpointing workloads, the J5060 starts strong but quickly degrades in performance, signaling issues with sustained write consistency.
For organizations with read-heavy, capacity-driven needs, the J5060 offers clear value, but its limitations make it a tougher sell for mixed or write-intensive workloads.
Engage with StorageReview
Newsletter | YouTube | Podcast iTunes/Spotify | Instagram | Twitter | TikTok | RSS Feed