
Dell PowerEdge R770 review: Intel Xeon 6 CPUs, OCP DC-MHS modularity, impressive performance, flexibility, and AI-ready in a dense 2U chassis.
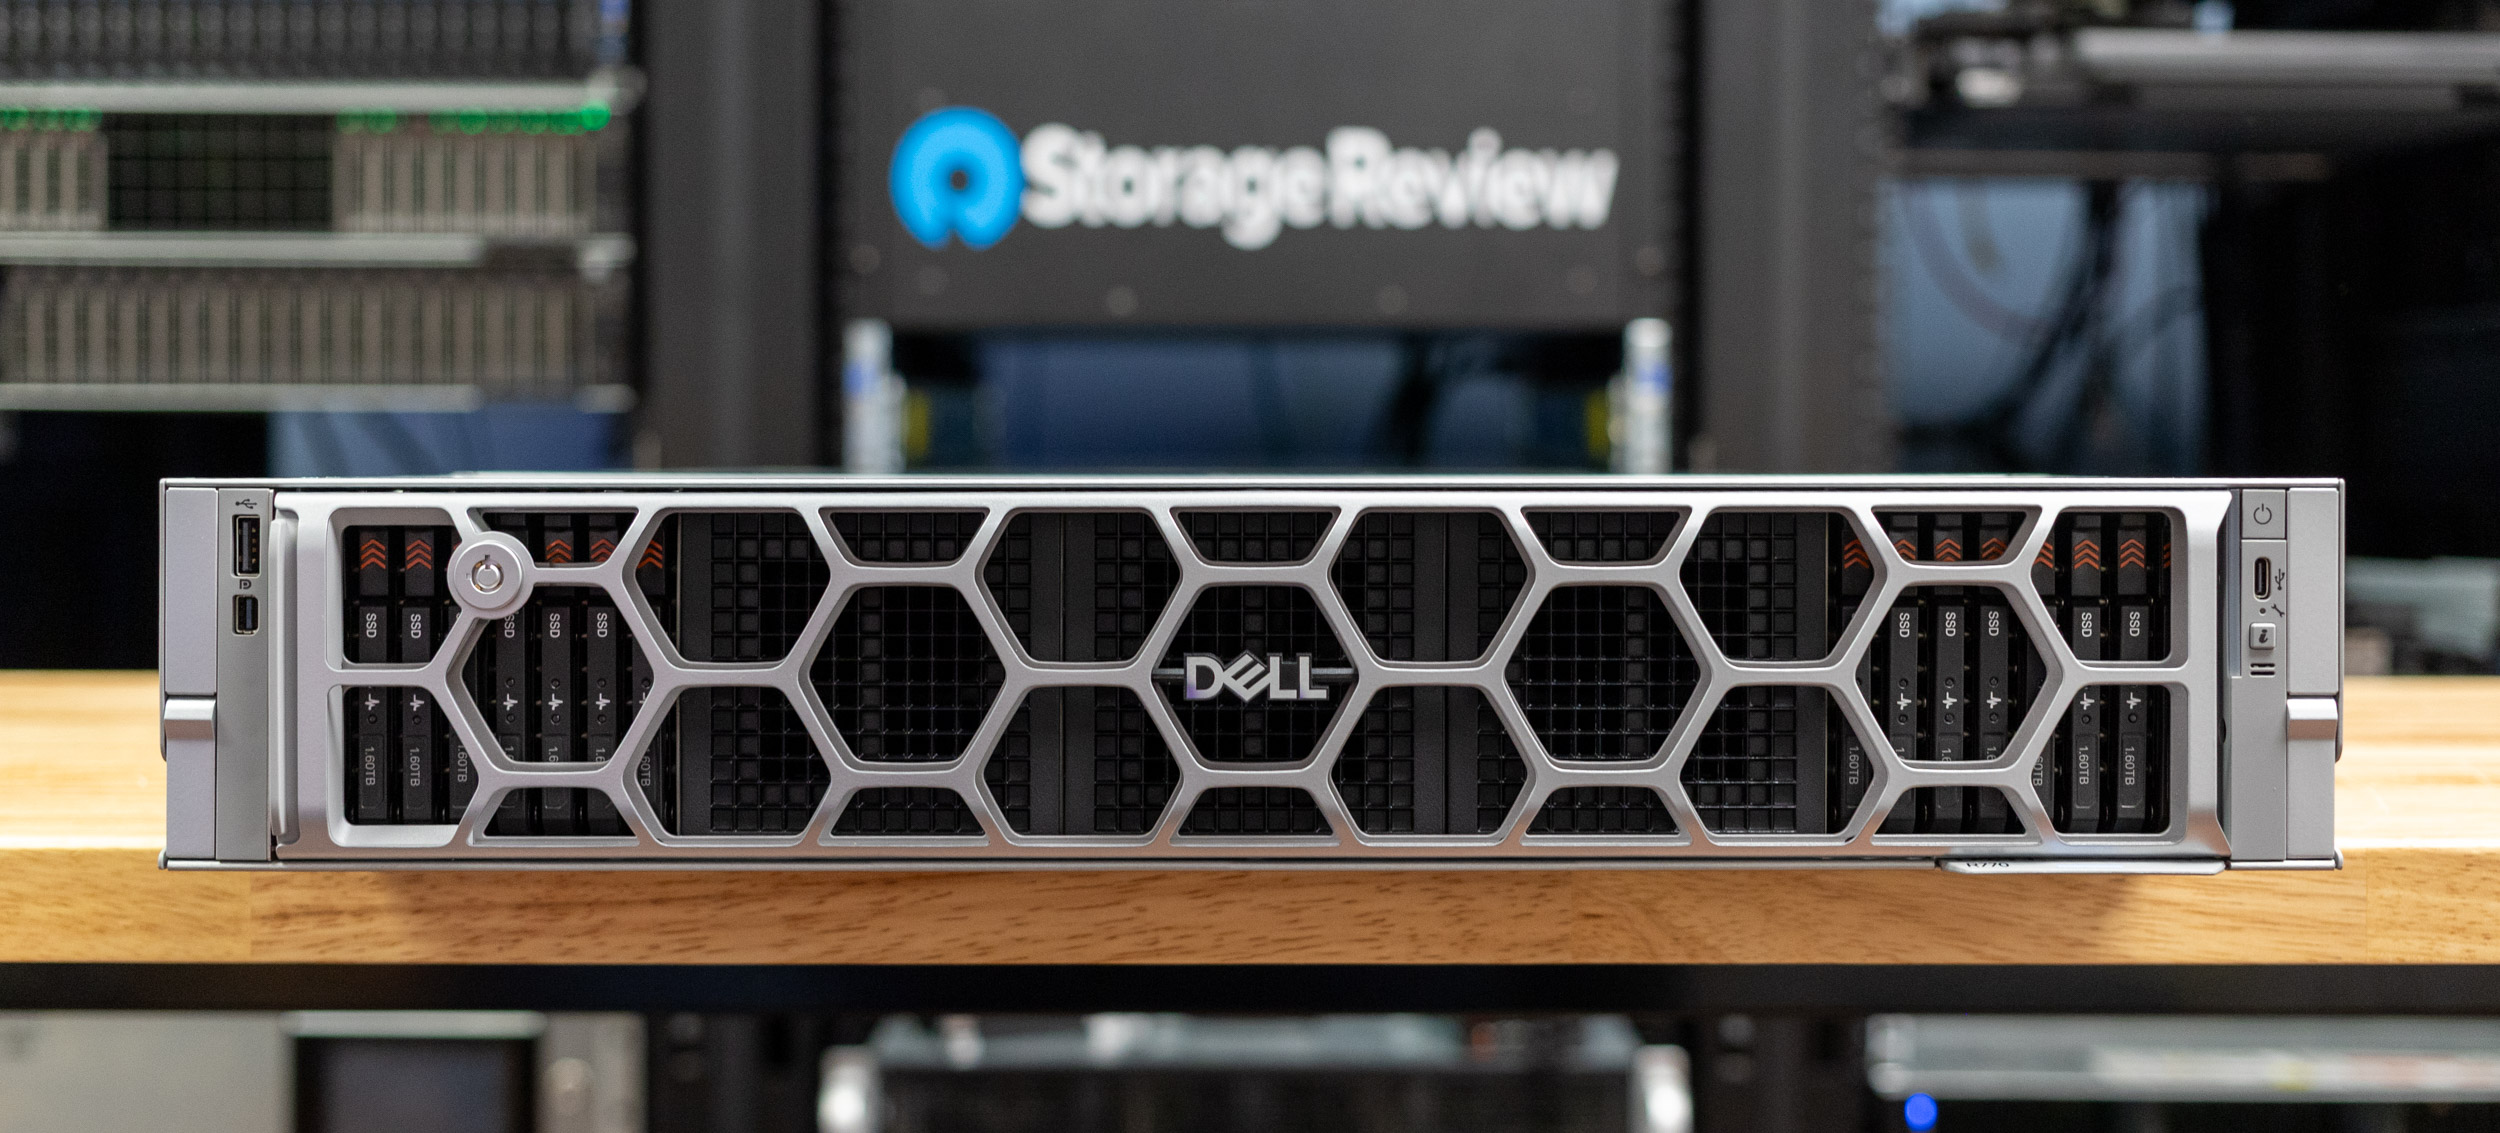
Dell’s PowerEdge R7x0 series servers have long been a cornerstone of data centers, renowned for their exceptional build quality, thoughtful design, performance, density, and reliability in the versatile 2U form factor. These servers have consistently evolved to meet changing demands. Now, with the introduction of the Dell PowerEdge R770, the series takes a significant leap forward.
The R770 debuts Intel’s new Xeon 6 processor family, featuring the Xeon 6500 and 6700 P and E core processors. It marks Dell’s first full adoption of the OCP Data Center Modular Hardware System (DC MHS) standard in its mainstream server line. Together, these two changes promise a significant evolution in capability and design philosophy.
Meeting Modern Data Center Demands
The launch of the R770 comes when data centers face mounting pressure. Workloads are increasingly diverse and demanding. The relentless growth of data fuels the need for robust analytics and databases. From training complex models to deploying real-time inference, artificial intelligence is no longer a niche application but a core business driver requiring substantial compute power and specialized acceleration.
Simultaneously, there’s an intense focus on energy efficiency and optimizing the total cost of ownership. Furthermore, the industry is increasingly looking towards open standards to foster innovation, enhance interoperability, and potentially reduce vendor lock-in. The R770, with its new processor options and adoption of OCP DC MHS, is designed to address these challenges head-on.
Intel Xeon 6 P-Core Processors
The R770 processor utilizes the Intel Xeon 6 series processors, including the 6700 and 6500 series, incorporating the Performance and Efficiency cores built on the Socket E2 (LGA4710-2) platform. For this review, we specifically focus on the P series SKUs.
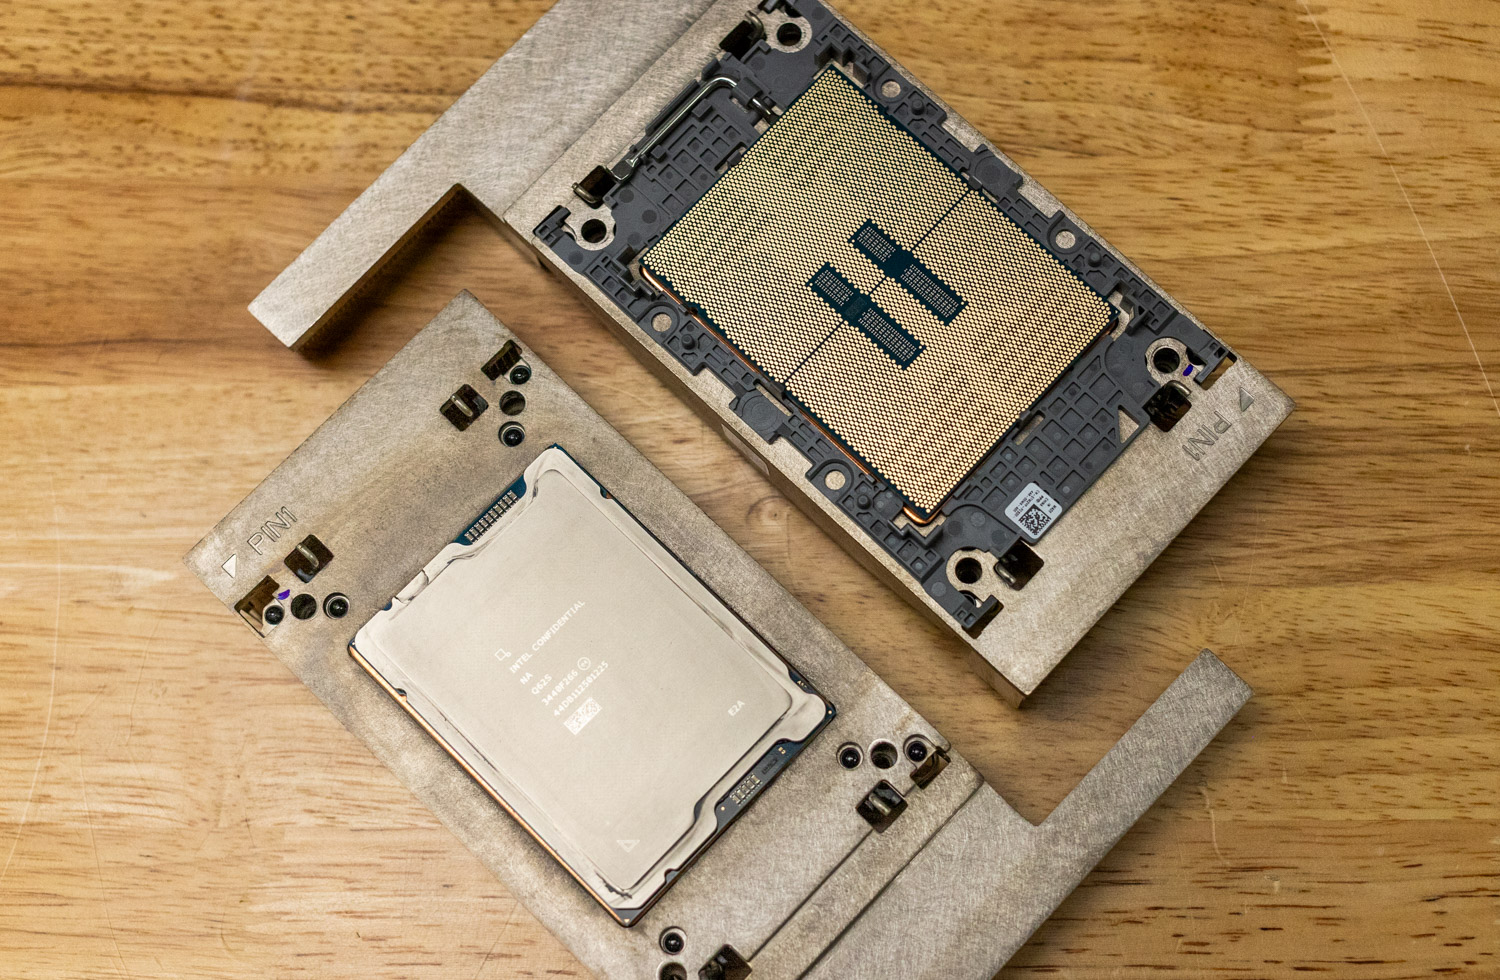
Intel constructs these processors using a tile-based design, combining I/O tiles with one or two compute tiles. This allows for scalability within the series, with configurations reaching up to 86 P-cores (XCC) using two compute tiles, down to 48 P-cores (HCC) or 16 P-cores (LCC) with single compute tiles.
Compared to previous-gen Sapphire and Emerald Rapids Processors, a key differentiator for these processors is the universal availability of built-in accelerators across all Xeon 6 processors. This includes Intel QuickAssist Technology for crypto and compression, Intel Data Streaming Accelerator for data movement, Intel In-Memory Analytics Accelerator for database and analytics acceleration, and Intel Dynamic Load Balancer for network processing efficiency.
Memory and I/O bandwidth also see substantial upgrades. The Xeon 6700/6500 P-core series supports 8-channel DDR5 memory. They also pave the way for Multiplexed Rank DIMM (MRDIMM), which delivers speeds up to 8,800 MT/s. On the I/O front, these processors support PCIe 5.0 and CXL 2.0. In dual-socket configurations, the platform can offer up to 88 PCIe lanes per socket (totaling 176 lanes).
And despite the P-core and E-core differentiation, the Xeon 6 family maintains consistency in instruction sets, BIOS, drivers, OS/application support, and RAS features, simplifying integration and management across different deployment types. The P-core variants are aimed at workloads where per-core performance, AI acceleration, high memory bandwidth, and substantial I/O are paramount; think demanding databases, HPC simulations, advanced analytics, and a wide range of AI applications.
Dell PowerEdge R770 Specifications
| Specification | Dell PowerEdge R770 |
| Processor | Two Intel Xeon 6 processors with up to 144 E-cores or 86 P-cores per processor |
| Memory | 32 DDR5 DIMM slots, supports RDIMM 8 TB max, speeds up to 6400 MT/s, supports registered ECC DDR5 DIMMs only |
| Storage Controllers | Internal Boot: Boot Optimized Storage Subsystem (BOSS-N1 DC-MHS): HWRAID 1, 2 x M.2 NVMe SSDs or M.2 Interposer board (DC-MHS): 2 x M.2 NVMe SSDs or USB, Internal controllers: Front PERC H965i, Front PERC H975i, Front PERC H365i |
| Front and Rear Bays |
|
| Hot Swap Power Supplies |
|
| Cooling Options | Air cooling and Direct Liquid Cooling (DLC is a rack solution and requires rack manifolds and a cooling distribution unit (CDU) to operate) |
| Fans | High-performance Silver (HPR SLVR) fans/High-performance Gold (HPR GOLD) fans, up to 6 hot swappable fans |
| Dimensions and Weight | Height – 86.8 mm (3.42 inches), Width – 482 mm (18.97 inches), Weight – 28.53 kg (62.89 pounds), Depth (for rear I/O configuration) – 802.40 mm (31.59 inches) with bezel, 801.51 mm (31.56 inches) without bezel, Depth (for front I/O configuration) – 814.52 mm (32.07 inches) without bezel |
| Form Factor | 2U rack server |
| Embedded Management | iDRAC, iDRAC Direct, iDRAC RESTful API with Redfish, RACADM CLI, iDRAC Service Module (iSM), NativeEdge Endpoint, NativeEdge Orchestrator |
| Bezel | Optional security bezel |
| Security | Cryptographically signed firmware, Data at Rest Encryption (SEDs with local or external key management), Secure Boot, Secured Component Verification (Hardware integrity check), Silicon Root of Trust, System Lockdown, System Lockdown (requires iDRAC10 Enterprise or Datacenter), Chassis Intrusion Detection, TPM 2.0 FIPS, CC-TCG certified |
| Network Options |
|
| GPU Options | Up to 6 x 75 W FHHL or up to 2 x 350 W DWFL |
| Ports | Front Ports: 1 x USB 2.0 Type C port, 1 x USB 2.0 Type A port (optional), 1 x Mini-DisplayPort (optional), 1 x DB9 Serial (with front I/O configuration), 1 x Dedicated ethernet port for iDRAC management; Rear Ports: 1 x Dedicated ethernet port for iDRAC management, 1 x VGA, 2 x USB 3.1 Type A ports; Internal Ports: 1 x USB 3.1 Type A port |
| PCIe |
|
| Operating Systems and Hypervisors | Canonical Ubuntu Server LTS, Microsoft Windows Server with Hyper-V, Red Hat Enterprise Linux, SUSE Linux Enterprise Server, VMware with vSphere |
Dell PowerEdge R770 Embracing Modularity with OCP DC MHS

Source from Server/DC-MHS – OpenComputer
The Dell PowerEdge R770 introduces notable advancements and flexibility in its physical design and component architecture, adopting the Open Compute Project’s Data Center Modular Hardware System (OCP DC MHS) standard.
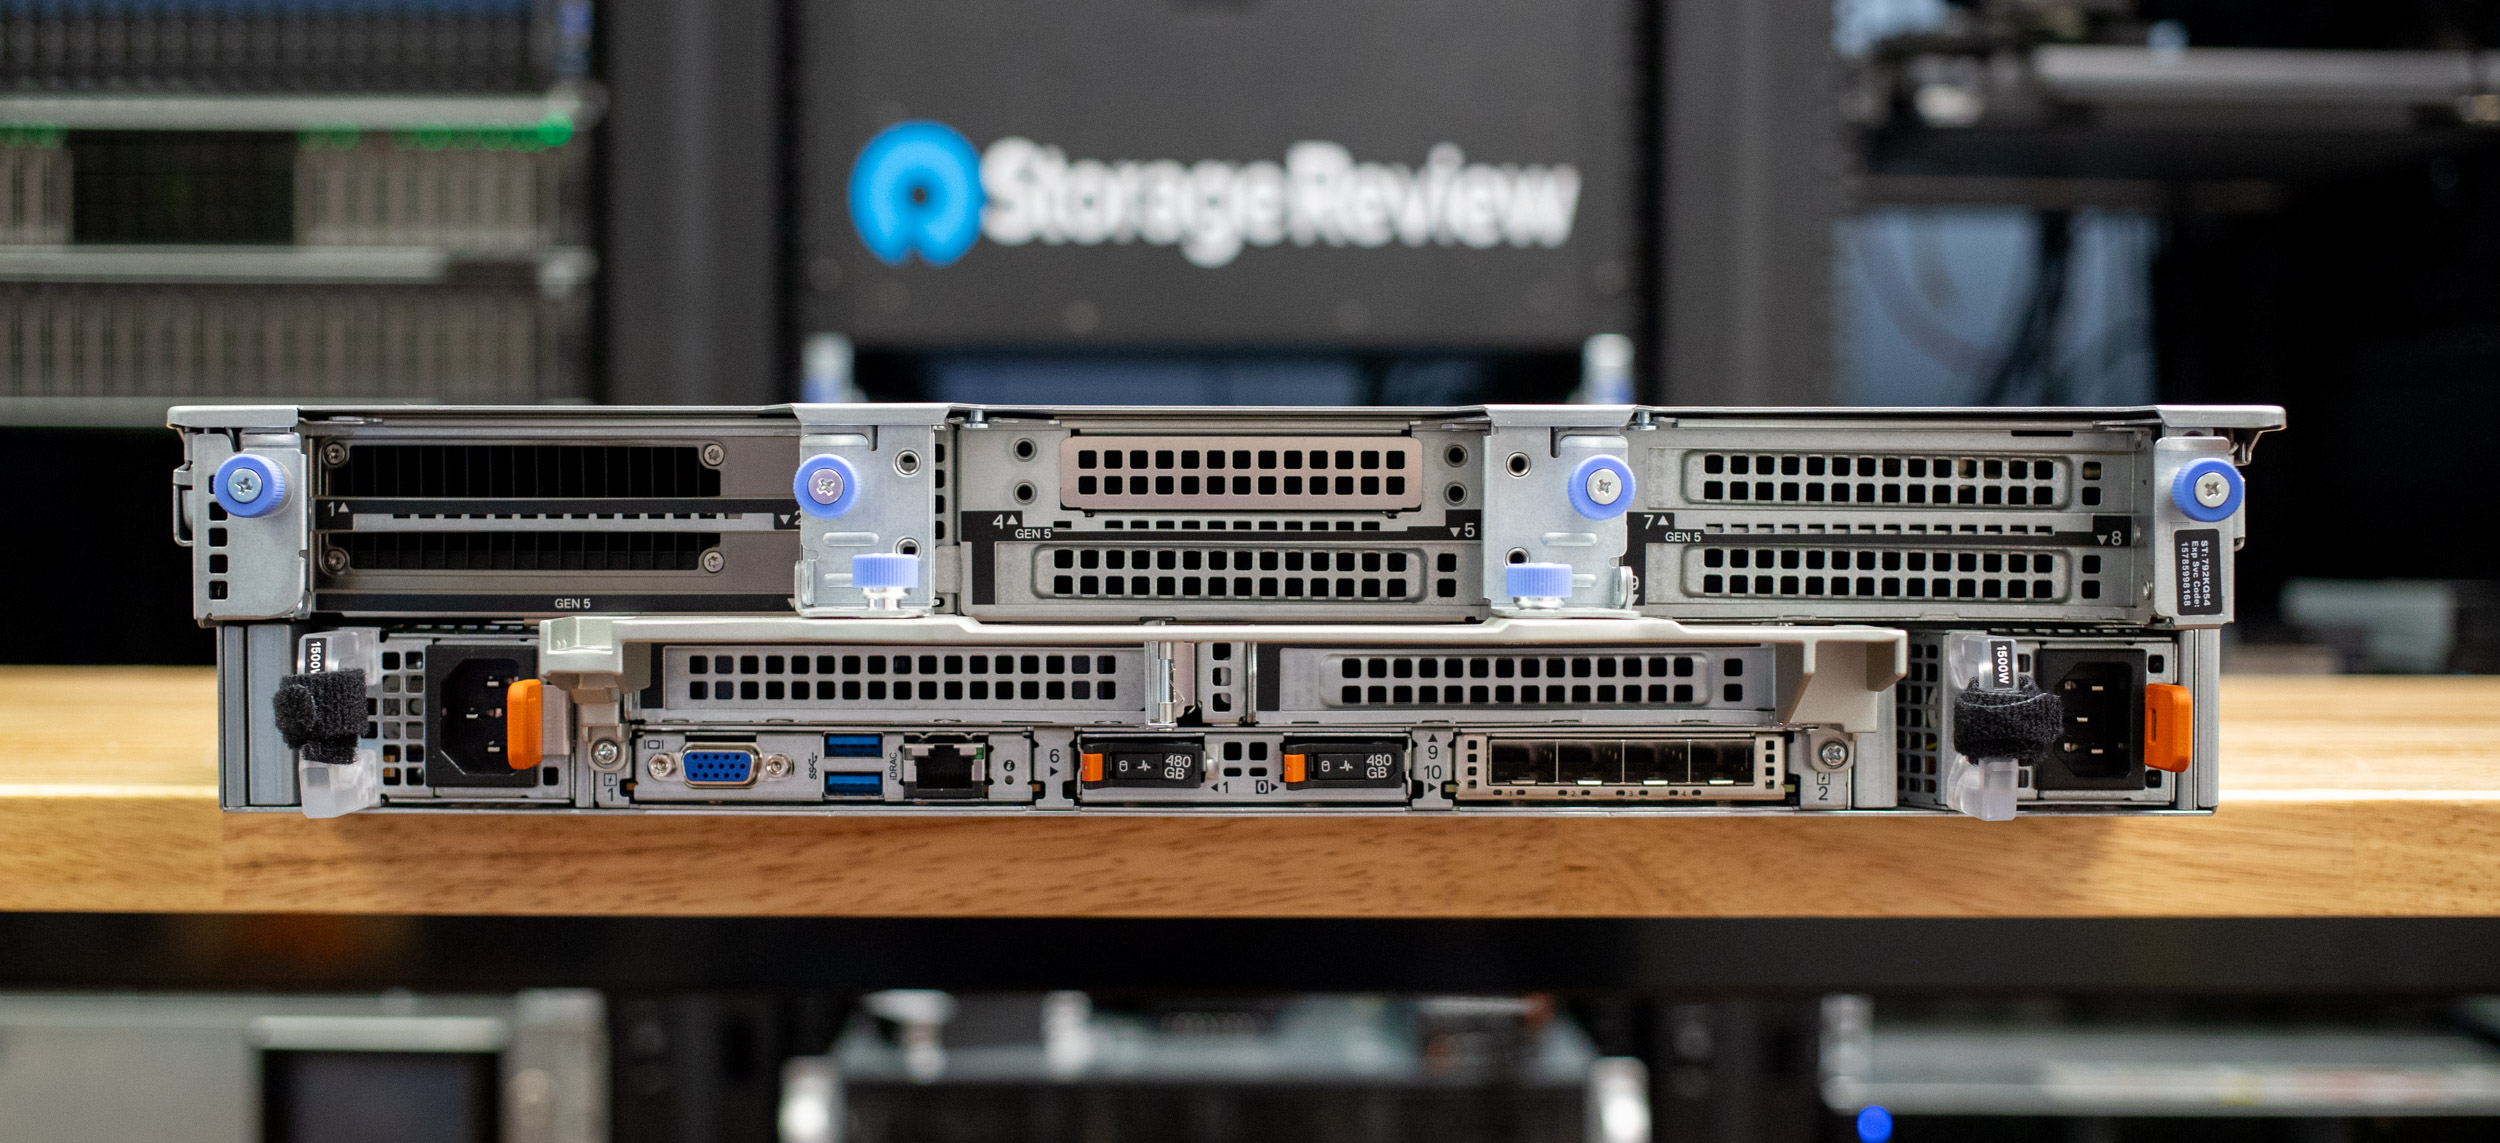
Continuing the legacy of the R7x0 series, the R770 offers extensive configuration options to cater to diverse deployment needs. A significant first for this line is the choice between a traditional Rear I/O configuration and a Front I/O Cold Aisle Accessible configuration, providing greater flexibility for different data center layouts and serviceability requirements. Storage options are equally versatile, ranging from compute-focused nodes with minimal or no local storage to high-density configurations supporting a remarkable 40 E3.S drives for storage-centric workloads.
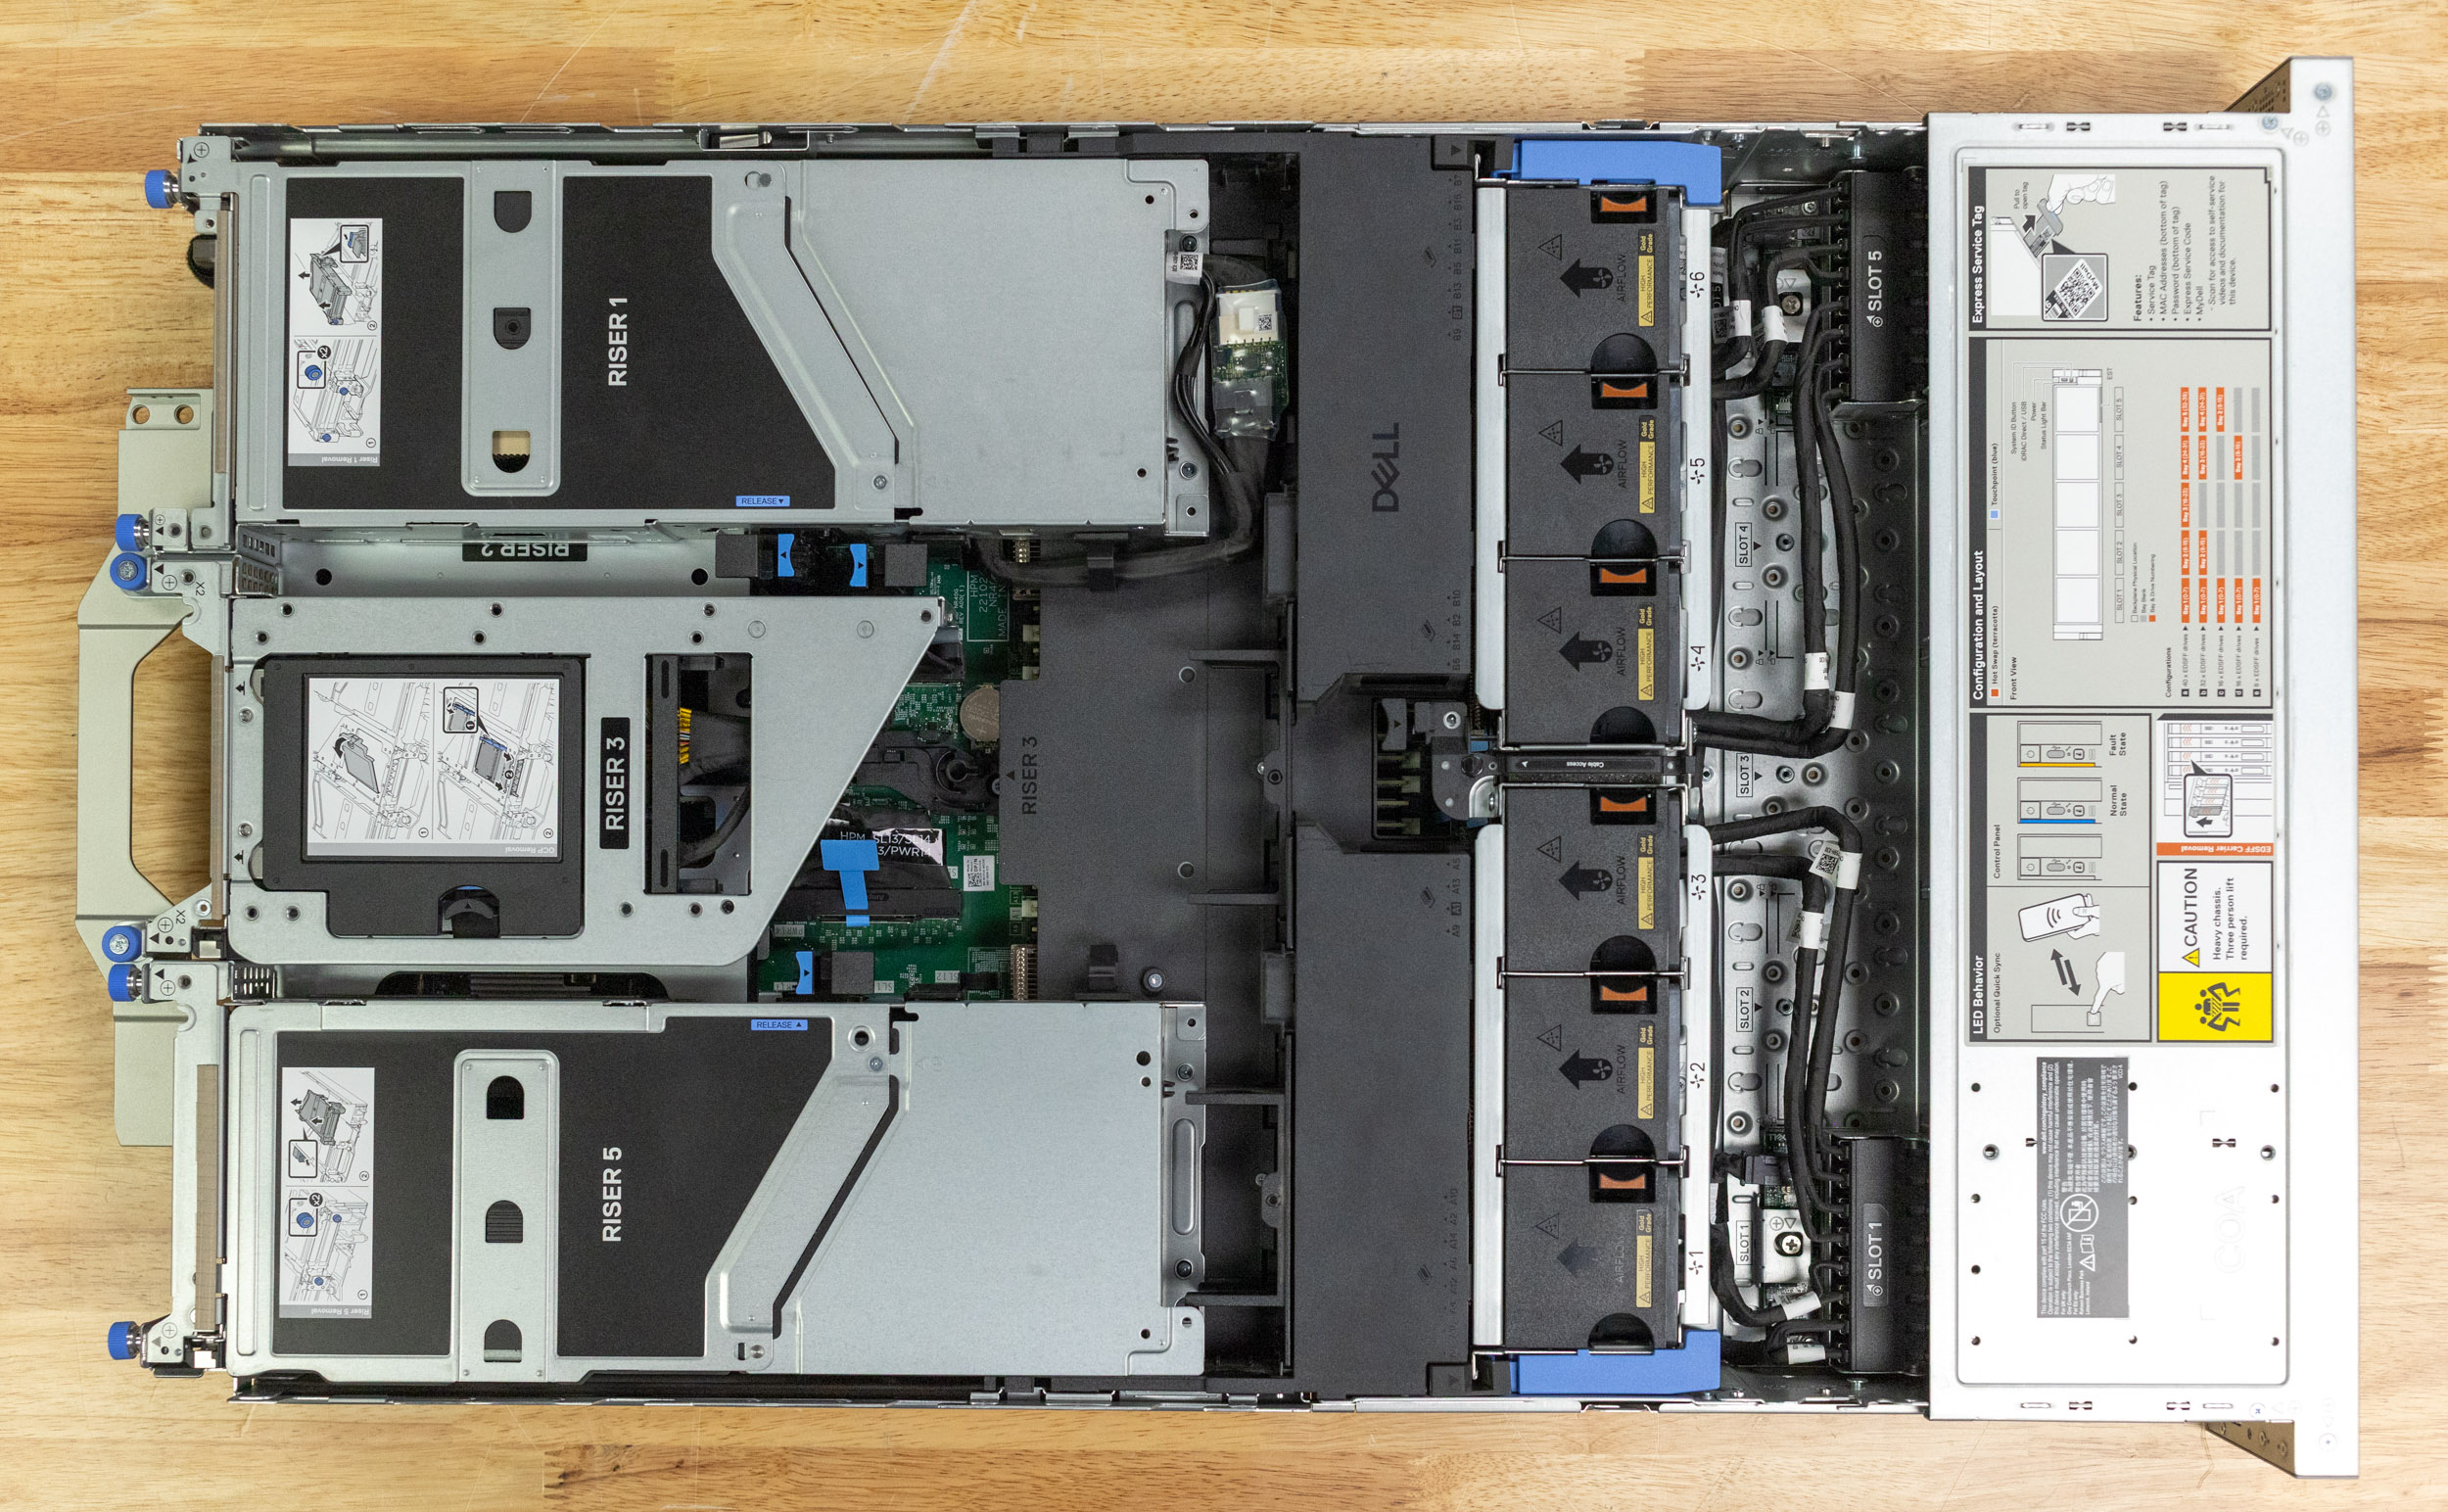
To address the growing need for accelerated computing, particularly for AI and HPC, the R770 boasts robust expansion capabilities. Depending on the chassis and riser configuration, the server can accommodate up to six Gen 5 x16 Full-Height, Full-Length (FHFL) PCIe cards. Furthermore, it supports the installation of two dual-width GPUs, making it a capable platform for a wide range of tasks. Networking flexibility is provided via OCP 3.0 mezzanine slots, supporting either x8 or x16 cards based on the configuration.
Dell has also implemented several design refinements aimed at improving serviceability and reliability. A prime example is the evolution of the Boot Optimized Storage Solution (BOSS) card. Previously attached via cables and built into the PCIe riser, the BOSS controller in the R770 is now implemented as an OCP-standardized card that interfaces directly with the motherboard, eliminating cabling complexity. This new BOSS controller also features faster NVMe M.2 drives and incorporates heatsinks to ensure optimal operating temperatures and performance for the boot devices. Another subtle but practical enhancement for technicians is the move from traditional jumpers to more user-friendly DIP switches for functions like clearing the NVRAM.
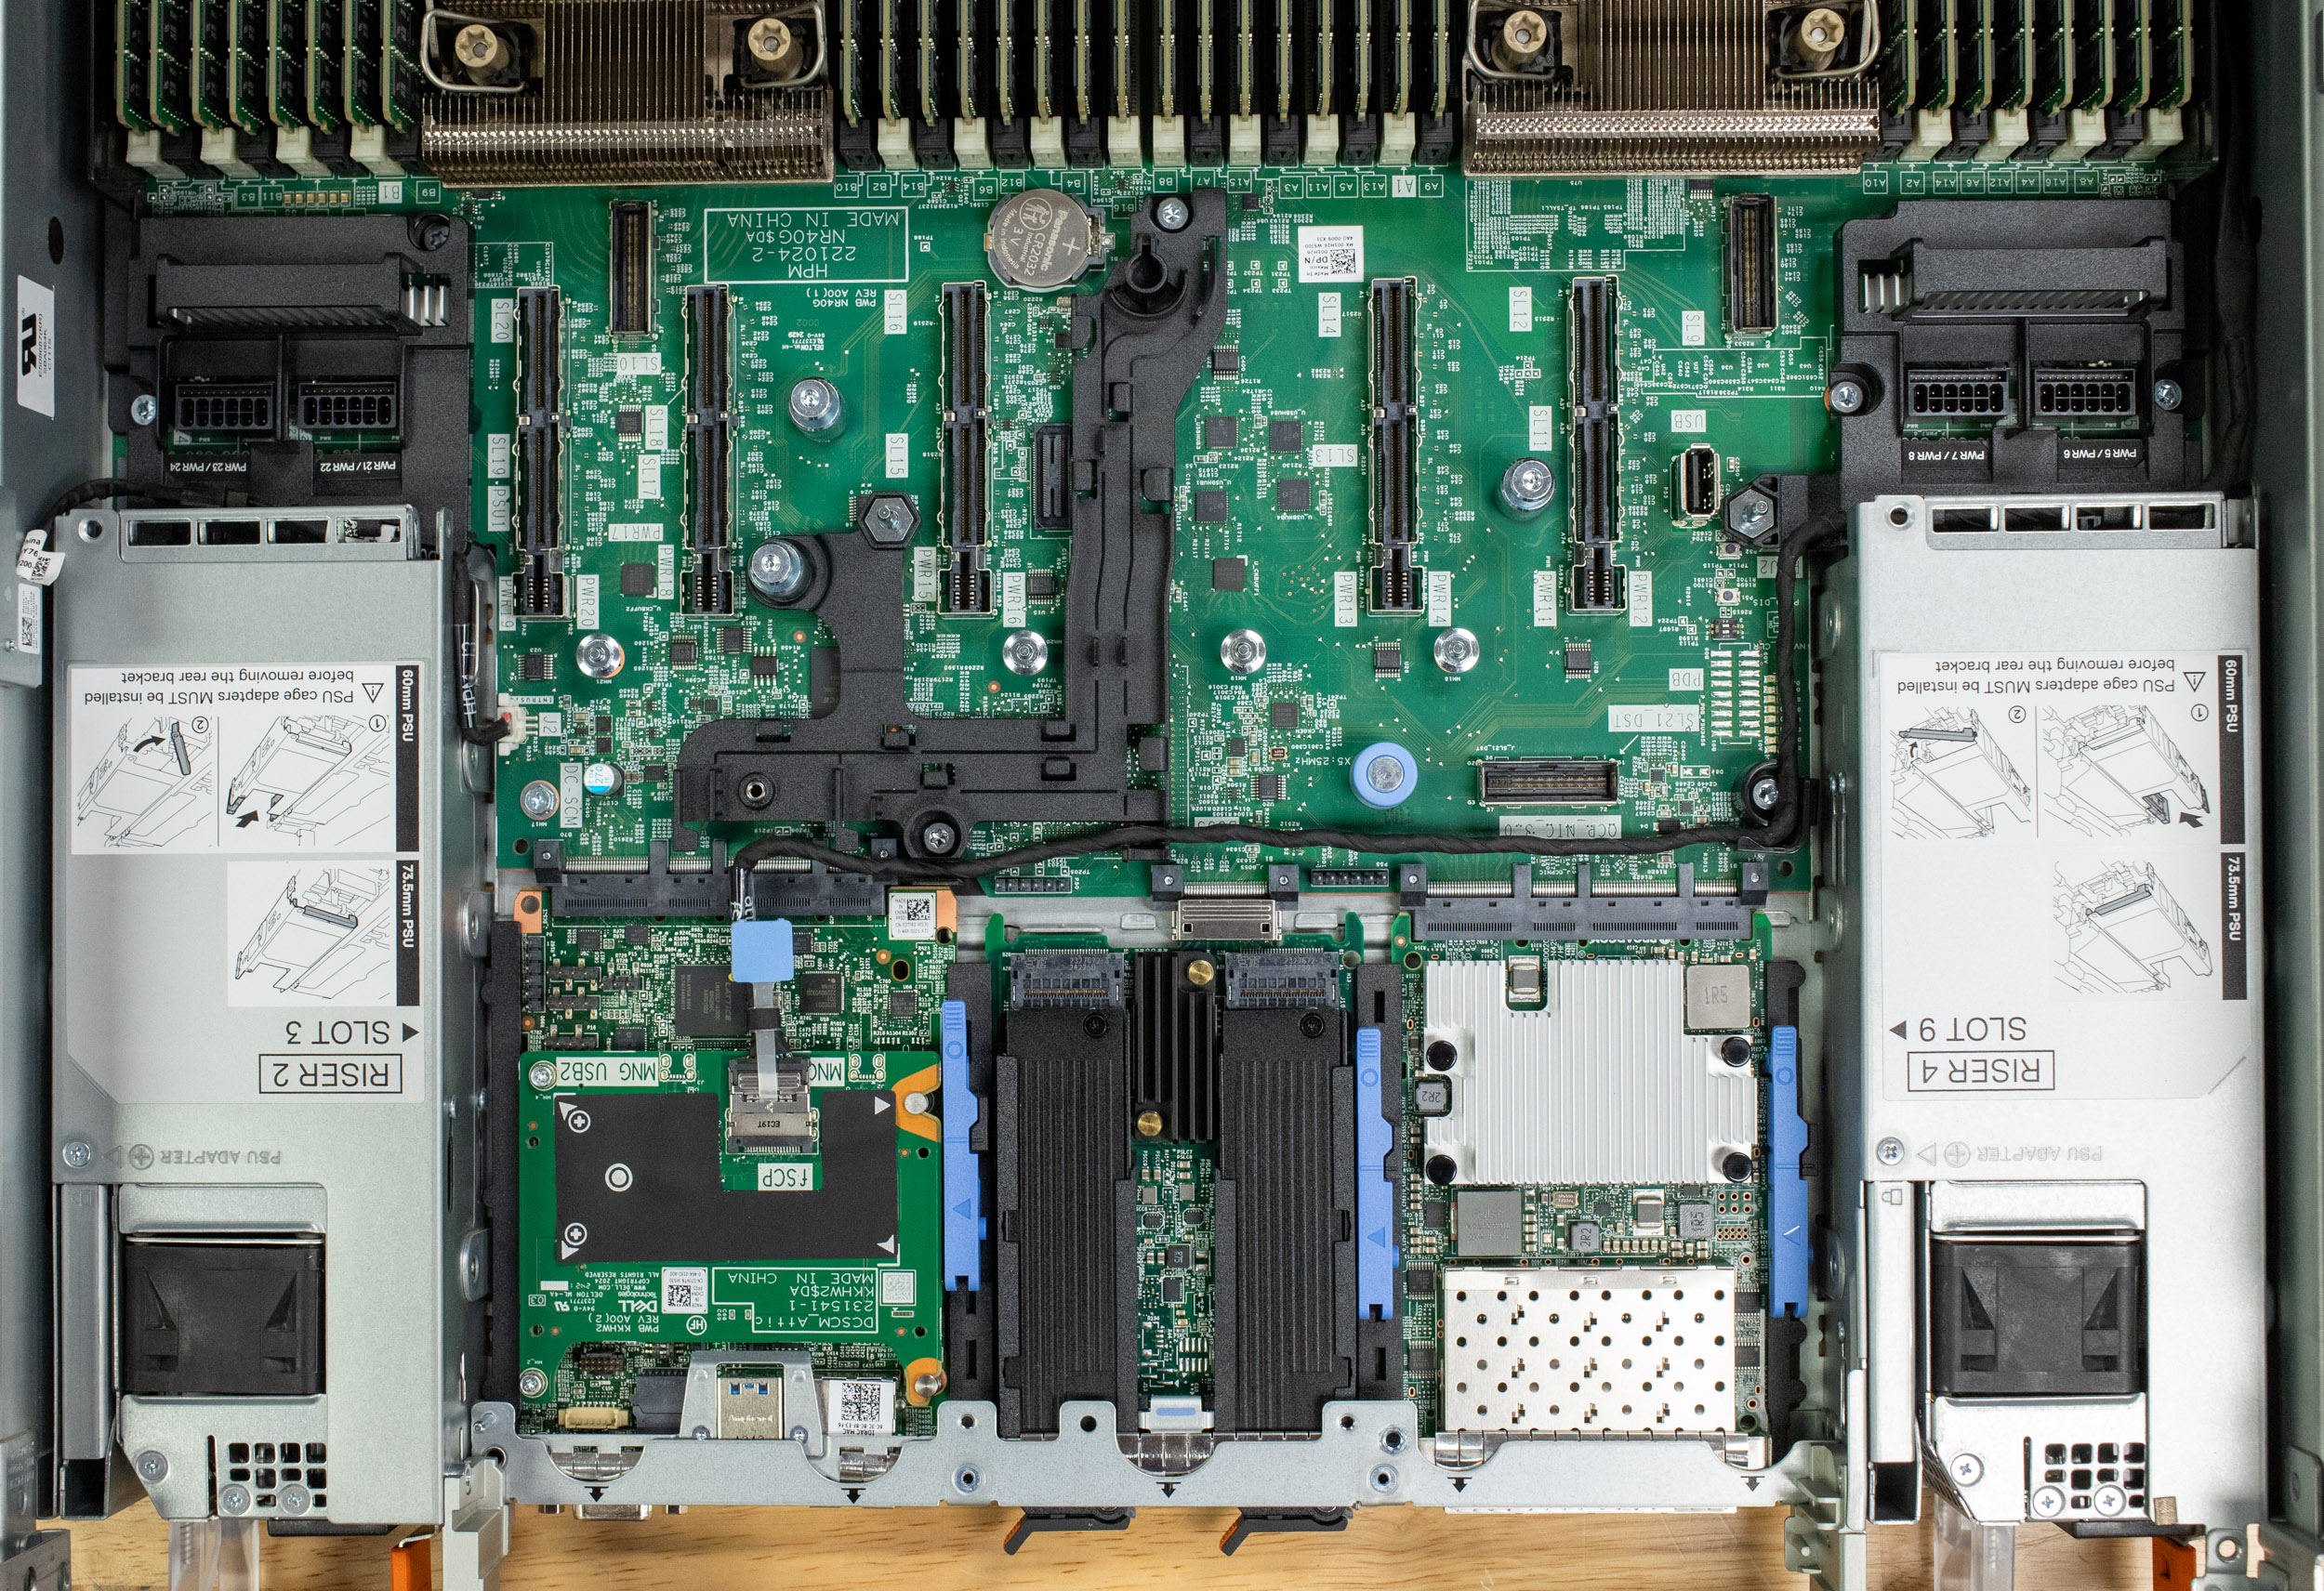
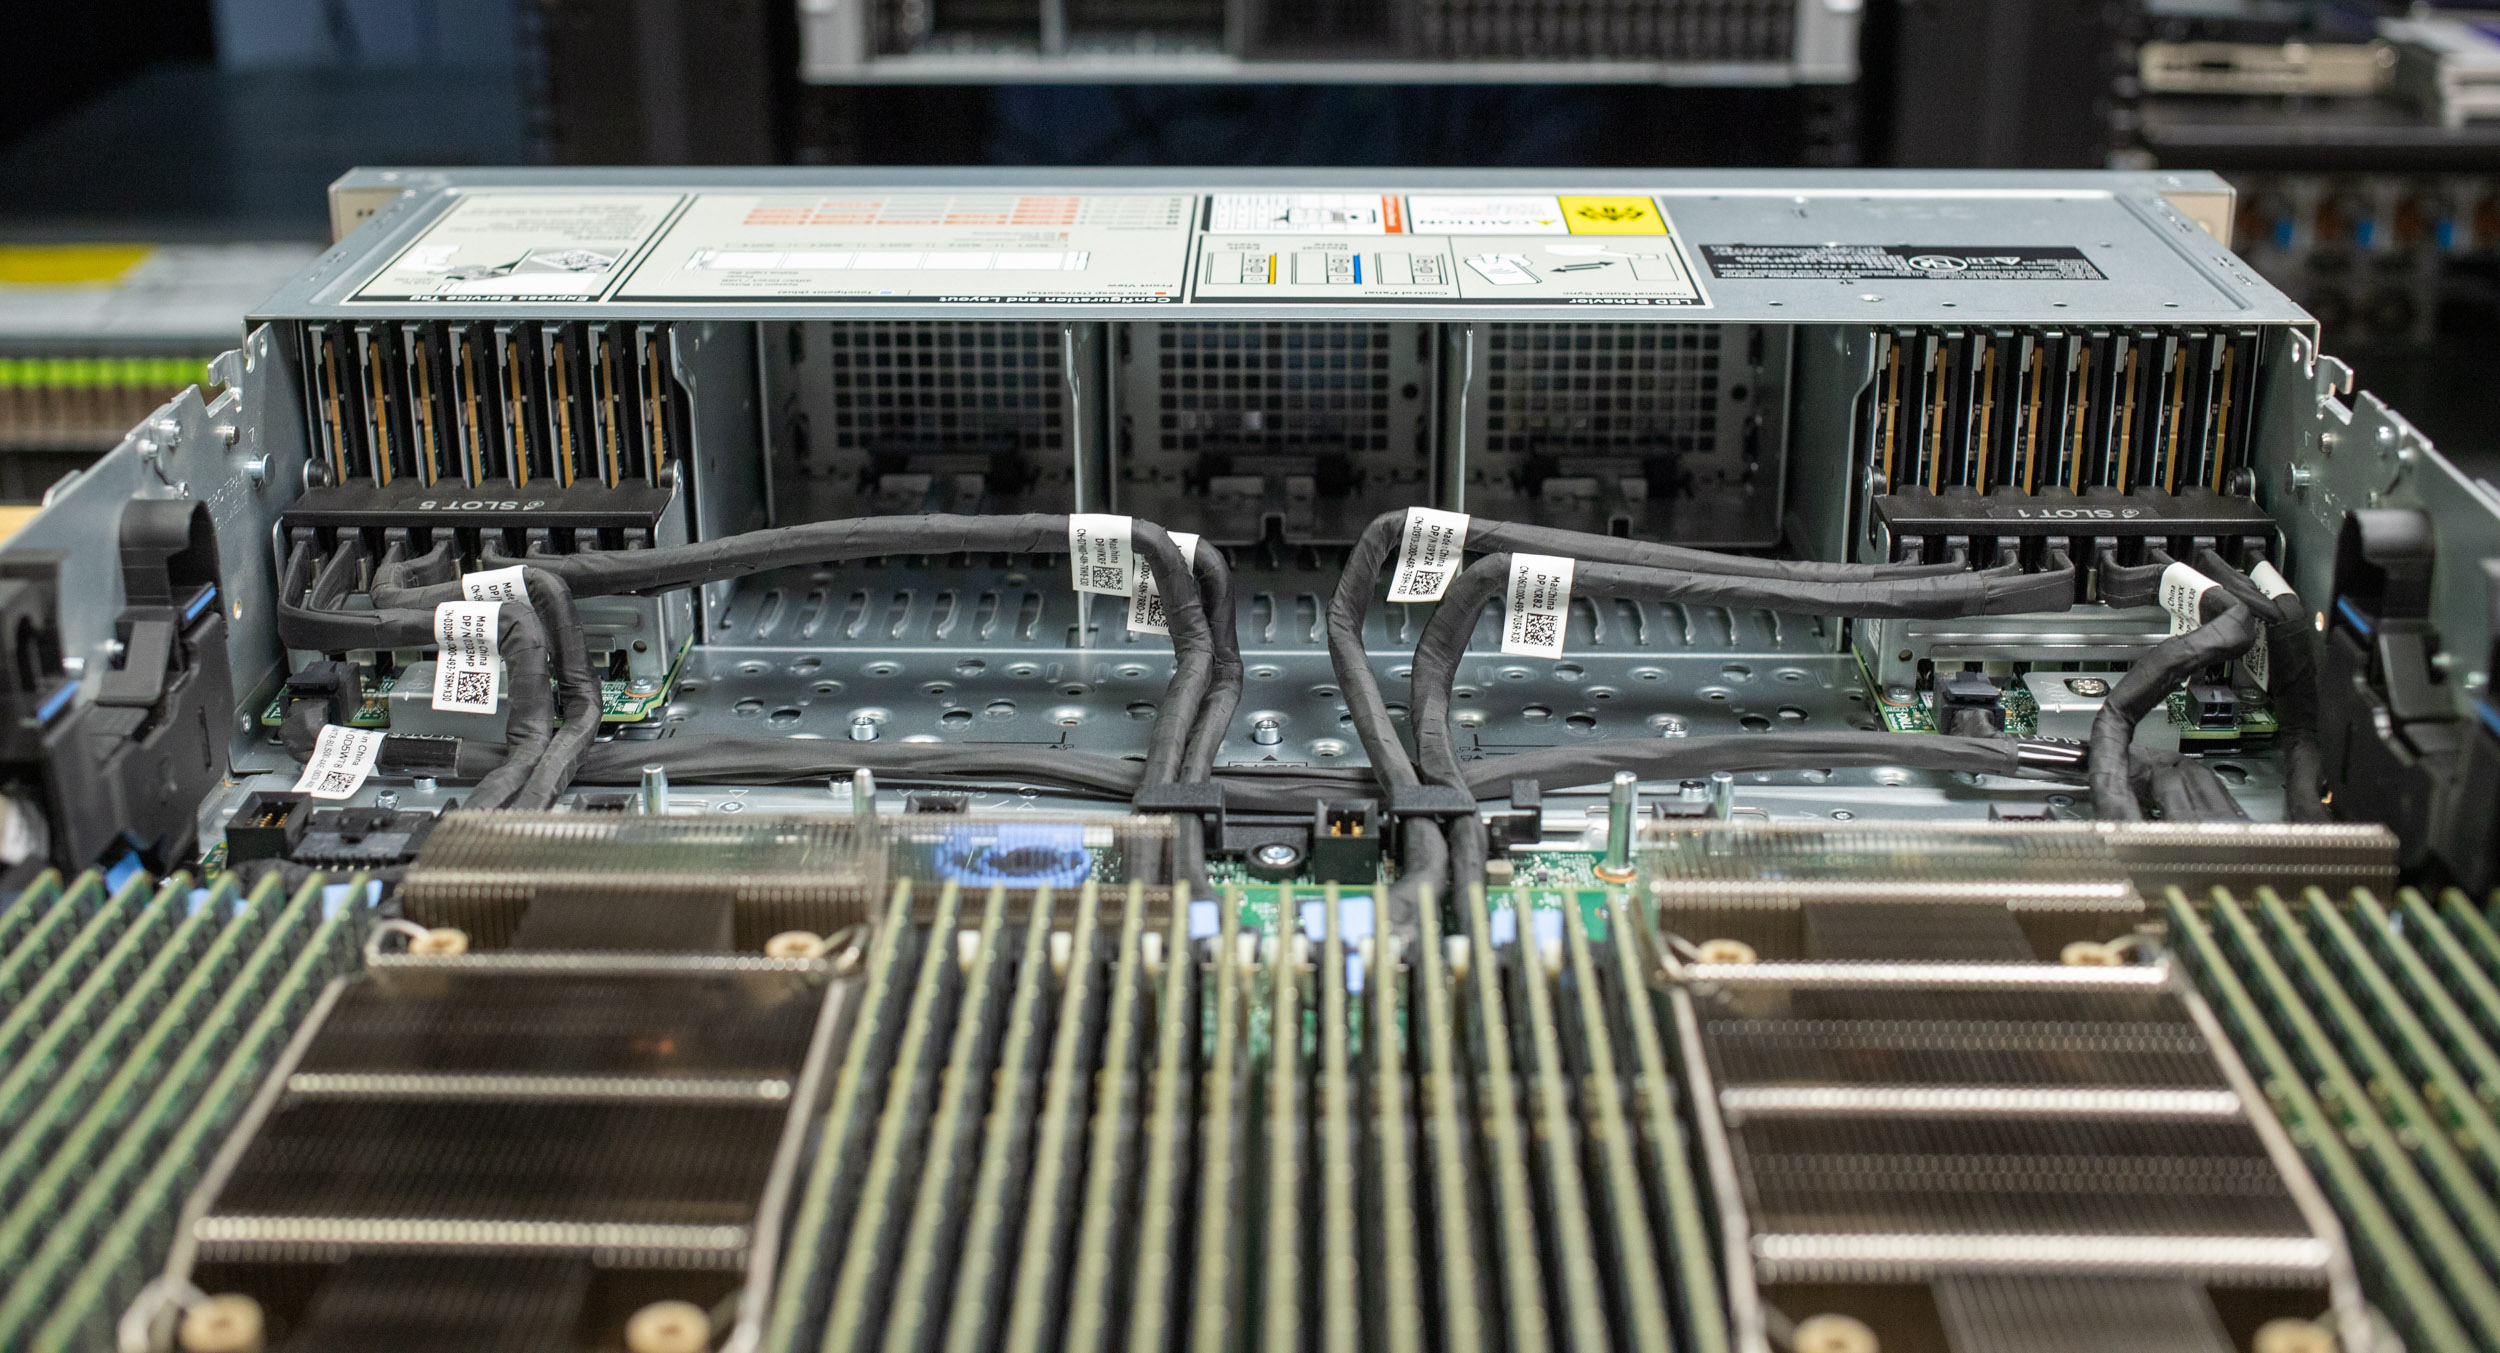
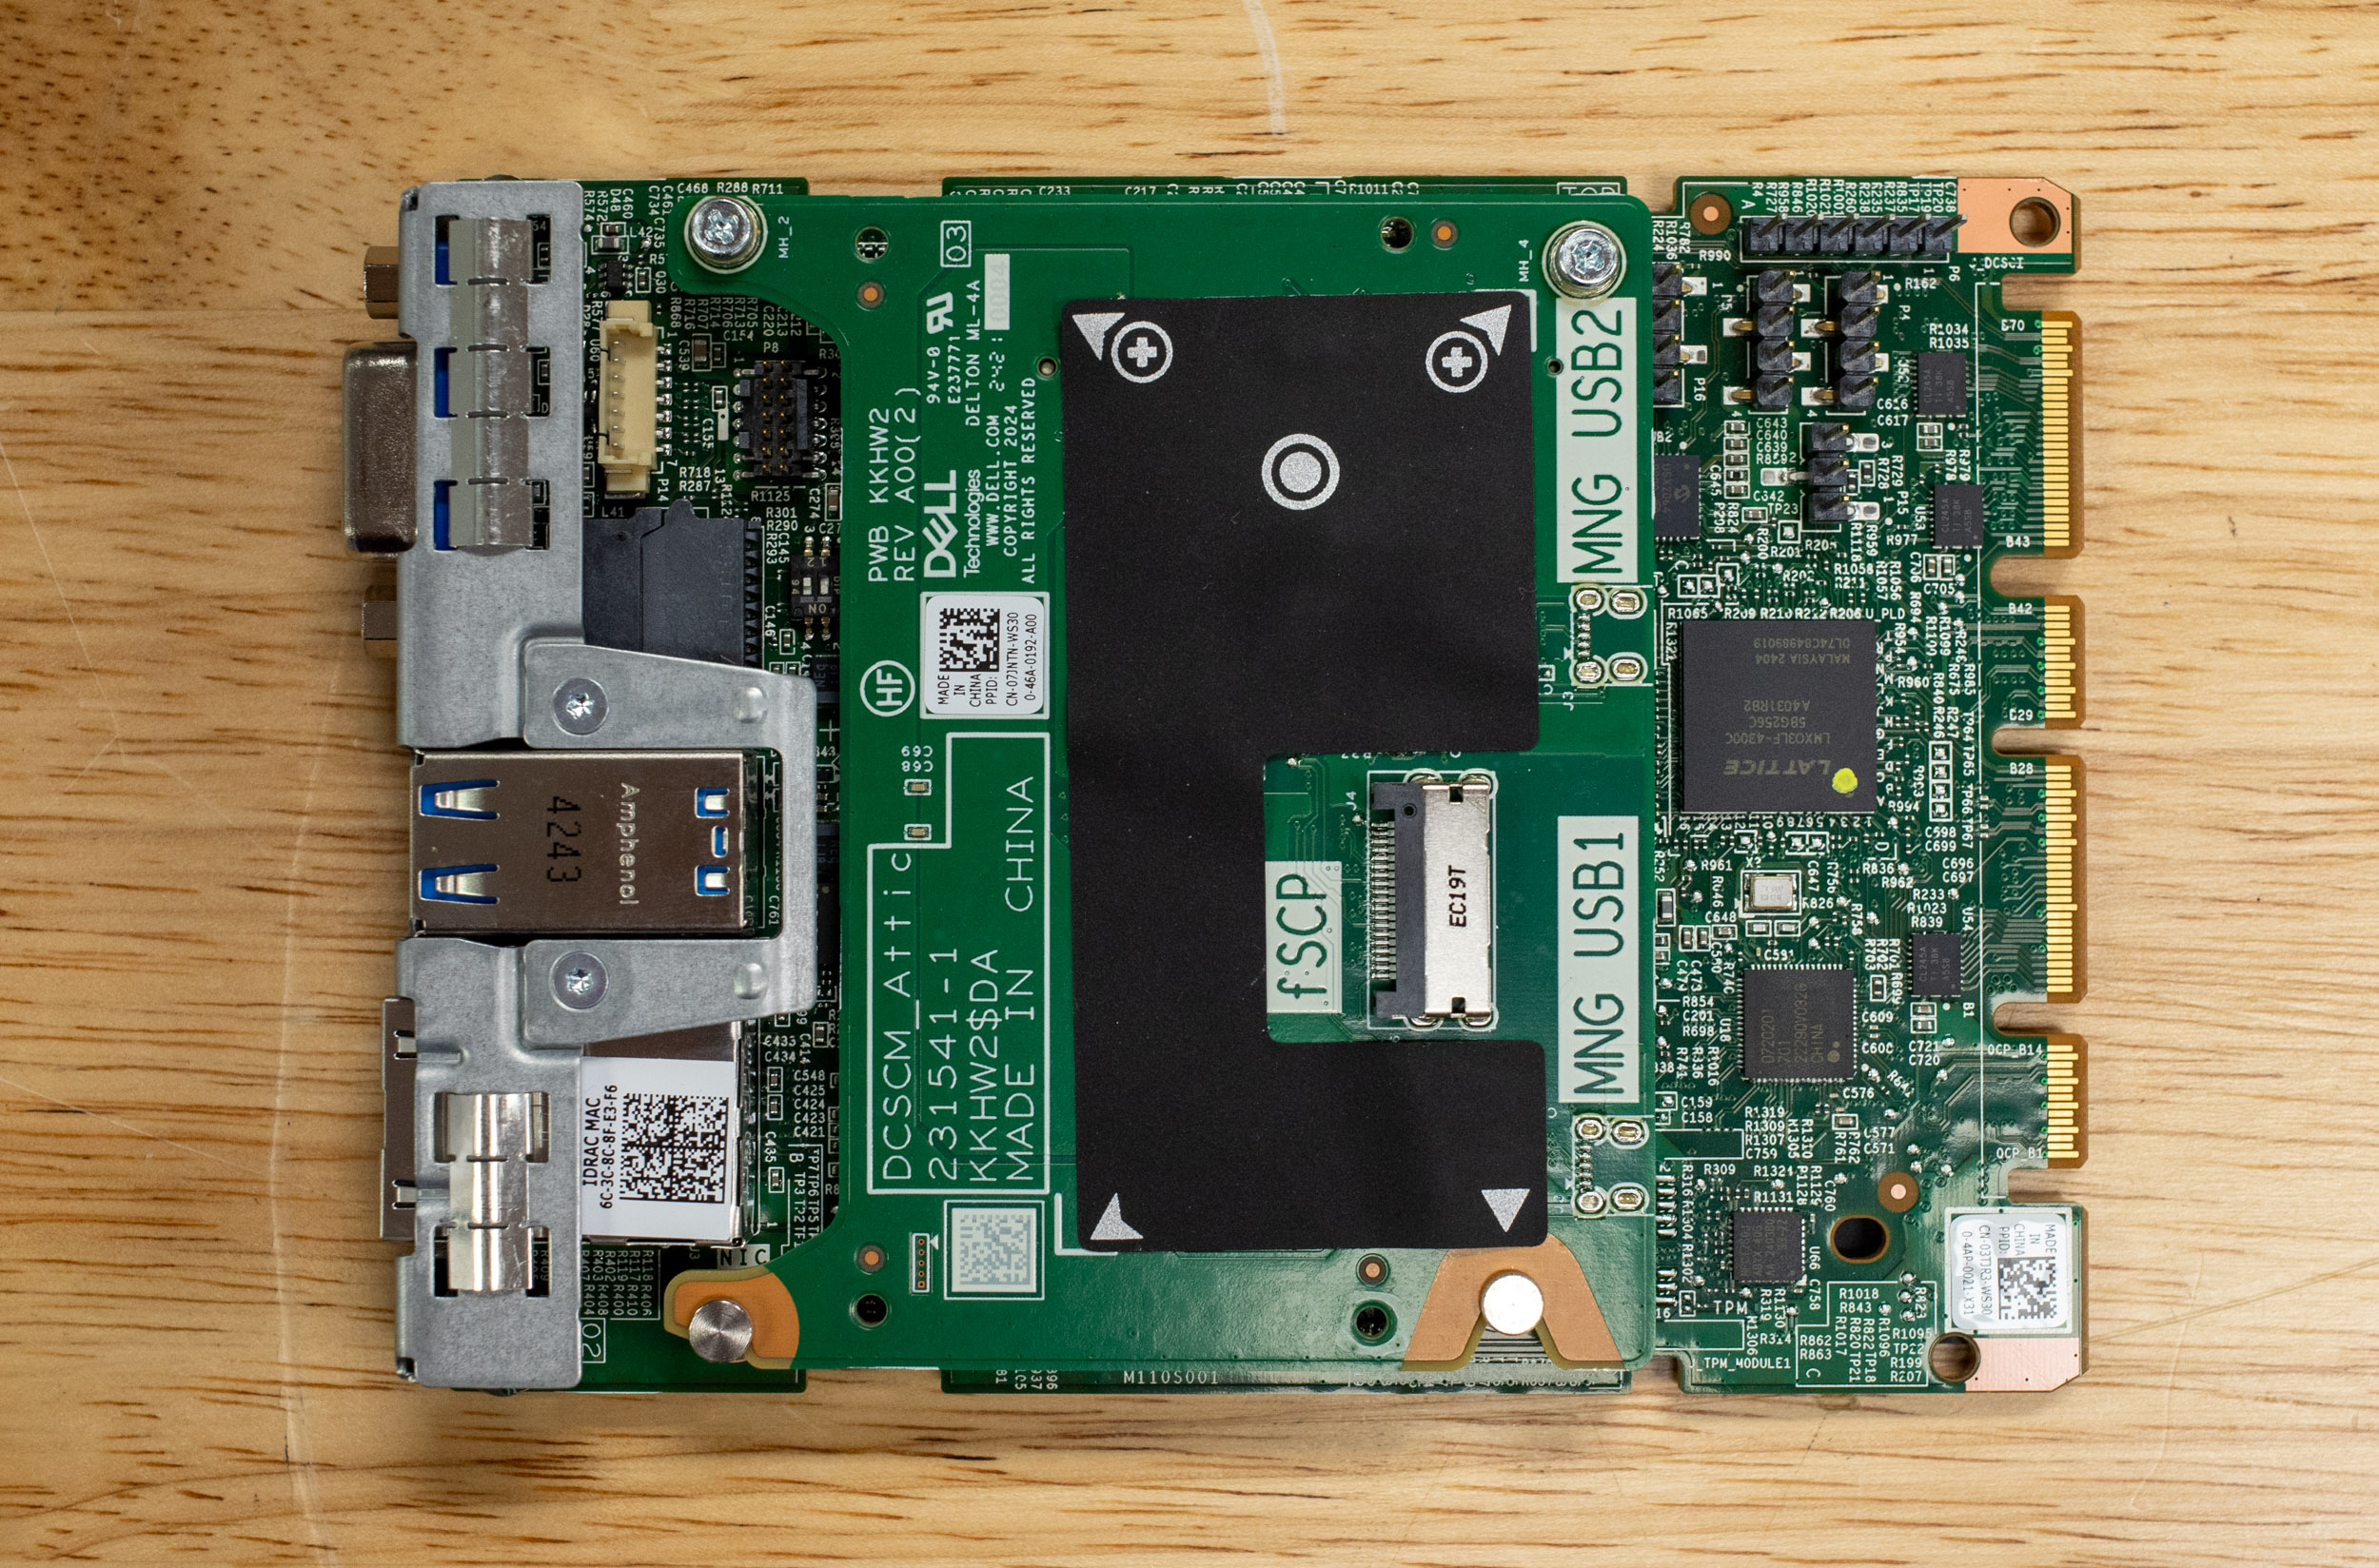
The most profound architectural shift is the complete adoption of the OCP DC MHS standard. Dell began incorporating OCP elements in previous generations, notably by adopting OCP 3.0 network adapter slots. The R770 takes this much further. Key components now adhere to OCP specifications, including Host Processor Modules (HPM), commonly known as the motherboard, which includes parts like the riser slots, now M-XIO connectors. The M-XIO connector provides a standardized interface for riser cards, enhancing flexibility and upgradeability. The iDRAC is also implemented as an OCP DC-SCM (Server Control Module).
Moreover, the R770 introduces the new PICPWR power connector for peripheral connections such as GPUs and backplanes. This connector is a significant addition, simplifying power delivery and incorporating inline power monitoring.


This deep integration standardizes interfaces and form factors across various subsystems. While Dell emphasizes that users should stick to validated components for guaranteed compatibility and support, the underlying standardization makes many parts inherently more user-serviceable and potentially interchangeable across compliant systems in the future.
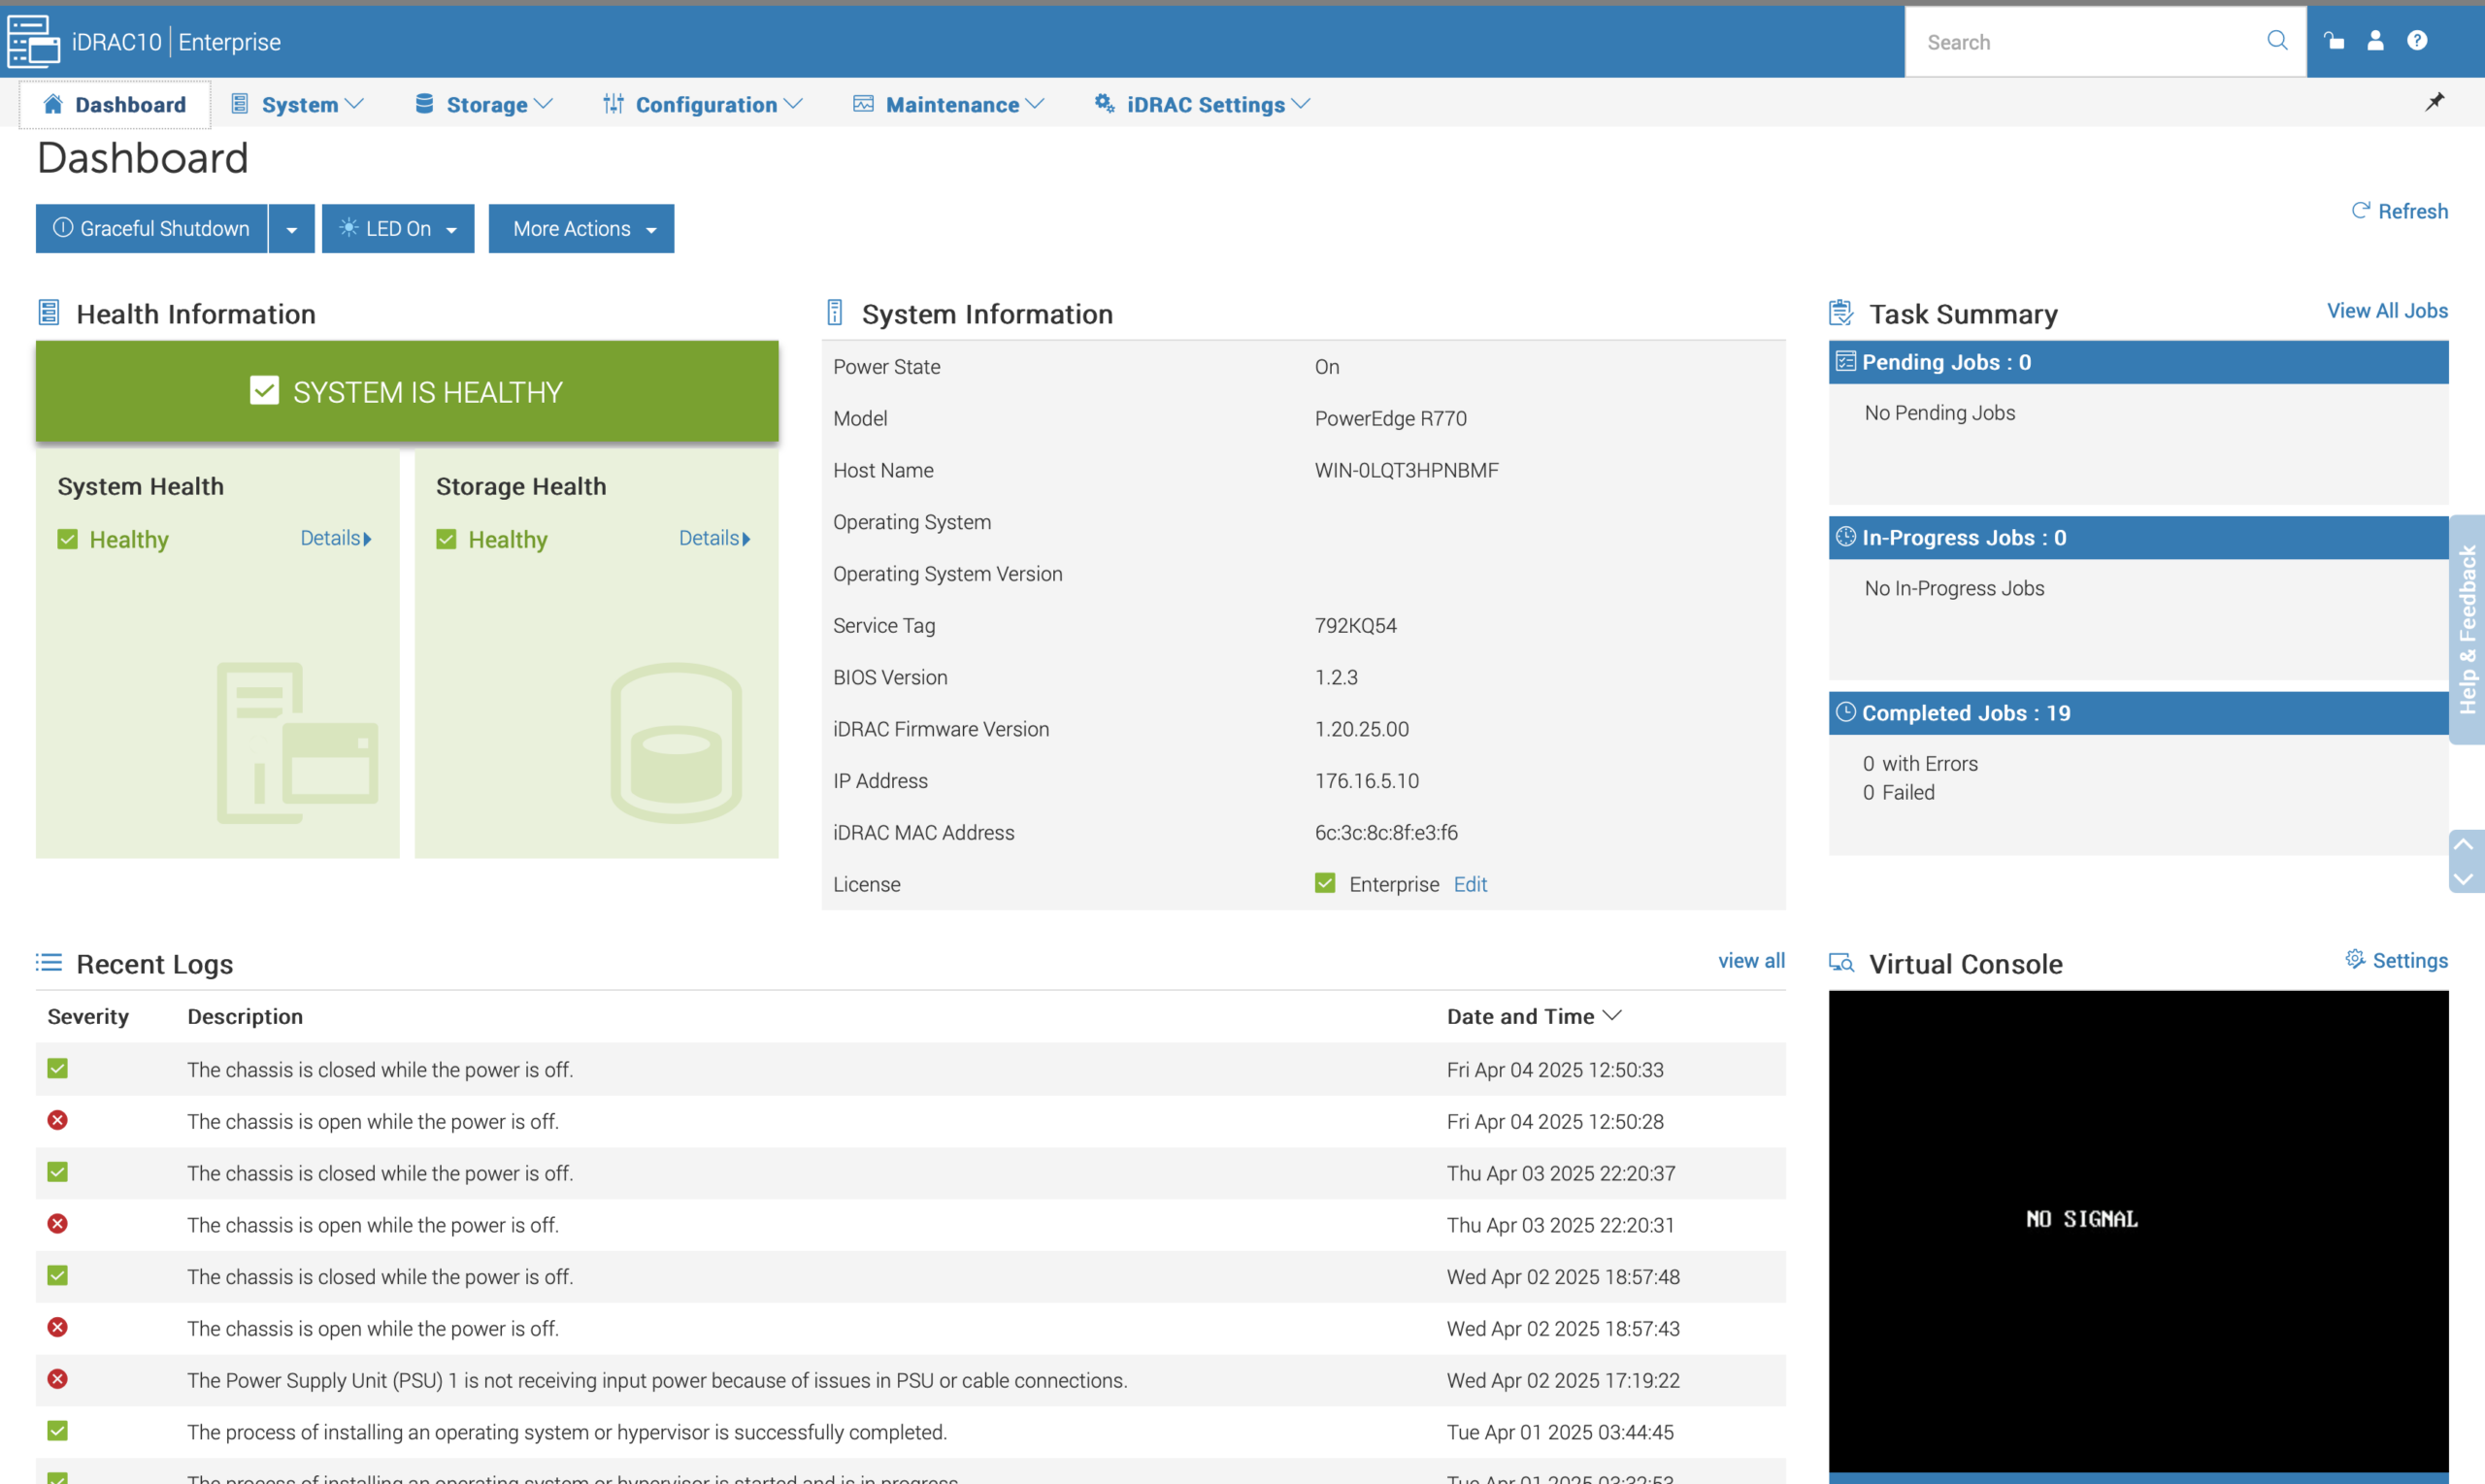
Management and iDRAC
The Dell PowerEdge R770 builds on the already feature-rich and beloved iDRAC 9 with the next-generation iDRAC 10, which enhances system administration through seamless integration with the Data Center Secure Control Module (DC-SCM). This integration allows for streamlined firmware updates and configuration management, ensuring consistent and scalable operations across data centers. iDRAC 10 also supports advanced automation and monitoring capabilities, empowering IT administrators to efficiently manage large-scale deployments without compromising performance or reliability.
Security is a cornerstone of the R770’s management features, with Dell implementing robust pre-boot and boot verification mechanisms. Leveraging silicon-based Root of Trust technology, iDRAC 10 ensures that all firmware, including BIOS and iDRAC, is cryptographically verified before execution. This immutable hardware-based security measure protects against malware tampering and supply chain attacks, providing a secure foundation for system operations. Additionally, the R770 incorporates quantum-safe booting protocols to mitigate emerging cryptographic threats, further solidifying its role in safeguarding critical infrastructure.

Dell’s commitment to supply chain security is evident in the R770’s design, which employs a comprehensive chain-of-trust authentication process. Each hardware component undergoes rigorous verification using cryptographic signatures embedded during manufacturing. This process ensures only authorized firmware and components are utilized, mitigating risks associated with unauthorized modifications or counterfeit parts.
Building Blocks of AI Factories
The R770 can be ordered with many GPU and Chassis configurations, making it a versatile platform for a wide range of AI workloads. This flexibility and its robust storage and networking capabilities make it an attractive choice for organizations deploying AI solutions in AI Factories. AI factories refer to the infrastructure and tools required to create, train, and deploy AI models at scale. These factories are essential for developing advanced systems like autonomous vehicles and robotics, as they provide the computational power and data pipelines needed to process massive datasets efficiently.
Developing autonomous vehicles and robotic systems requires extensive training data that reflects real-world scenarios. NVIDIA’s Cosmos NIM is a significant advancement in this field, offering developers a powerful toolkit to accelerate the creation and deployment of physical AI systems like World Foundational Models.
Understanding World Foundation Models
World foundation models (WFMs) are sophisticated neural networks that simulate real-world environments and predict accurate outcomes based on various inputs. Unlike traditional AI models focused on specific tasks, WFMs understand the dynamics of the physical world, including physics and spatial properties. They can generate videos from text prompts, images, or other input data while accurately representing motion, force, and spatial relationships.
NVIDIA Cosmos NIMs: A Stepping Stone to World Foundational Models
NVIDIA’s Cosmos NIMs are a crucial step towards achieving World Foundational Models. They enable organizations and AI labs to generate synthetic training data, efficiently scaling the necessary data to train these AI models. We deployed the Cosmos Predict model, a generalist model that generates world states from text or video prompts and synthesizes continuous motion by predicting frames.
These are some interesting results we were able to make with Cosmos with just a single image of our lab. Although not flawless, what it could make from just a single image is very impressive.
The R770’s ability to support high-performance GPUs, such as the NVIDIA H100, and its robust storage and networking capabilities make it an attractive choice for organizations looking to deploy AI solutions.
By leveraging the R770’s capabilities, organizations can efficiently train and deploy AI models like Cosmos NIM, accelerating the development of autonomous vehicles and robotic systems. The R770’s performance and scalability make it an ideal platform for handling the large amounts of data required for AI model training, and its versatility enables it to support a wide range of AI workloads.
GPU Direct Storage
GPU Direct Storage is a technology that enables direct data transfer between storage devices and GPUs, bypassing the CPU and system memory. In traditional data transfer, data is read from storage into the CPU’s memory and then copied to the GPU’s memory. This process involves multiple data copies, leading to increased latency and reduced performance. The CPU acts as a bottleneck, needing to handle the data transfer between storage and the GPU. GDS eliminates this bottleneck by directly allowing storage devices to transfer data to and from the GPU’s memory.
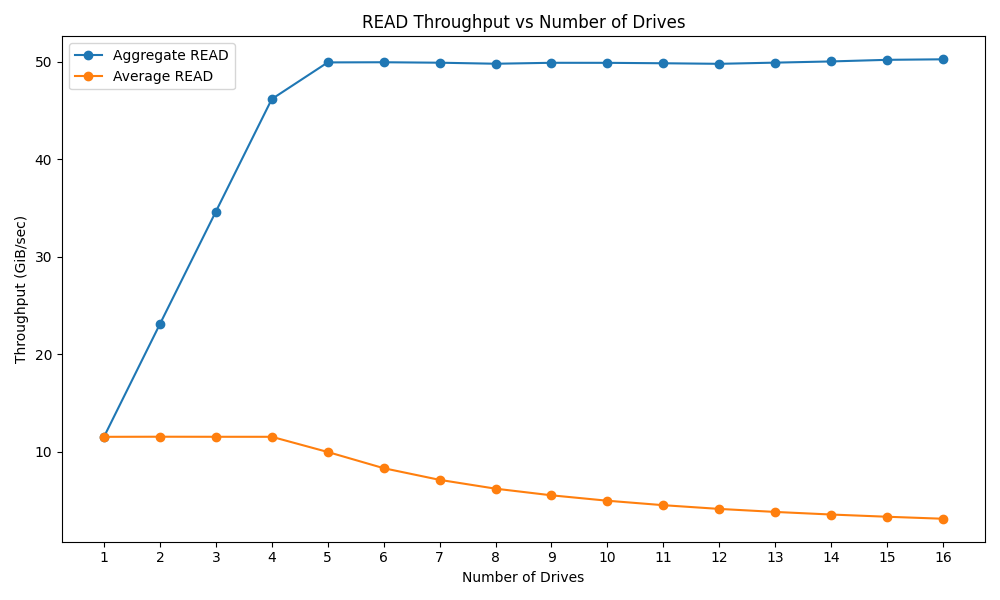
We conducted a GDSIO workload analysis on a storage system consisting of 16 drives, incrementally increasing the number of drives used to understand the storage performance and its ability to saturate a PCIe Gen 5 GPU.
The GDSIO Read chart illustrates how increasing the number of KIOXIA CD8P SSDs impacts aggregate and average read throughput in the r770. Initially, as the number of drives increases from one to four, aggregate read throughput scales rapidly, reaching around 50.2 GiB/sec. This suggests that the system can saturate the PCIe Gen 5 x16 with just three to four drives for data loading. Beyond five drives, aggregate throughput plateaus, indicating that additional drives do not significantly improve. Meanwhile, the average read throughput per drive remains steady up to 4 drives, but then declines as more drives are added. This decline in per-drive performance is because more drives share the available PCIe bus bandwidth, and individual drive reads are reduced.
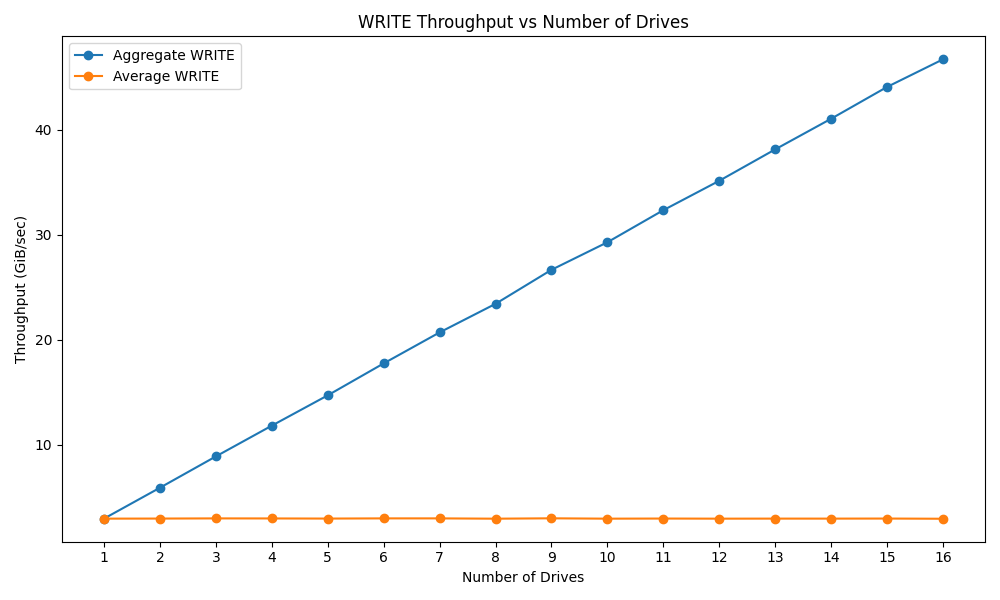
In contrast, the write performance of these drives is much lower than their read performance. It took all 16 drives to achieve a write bandwidth of 46.7GiB/s, with the average write for the drives staying almost constant. Given these are the lower write-performance capacities in the KIOXIA CD8 portfolio, high-capacity versions or other PCIe Gen5 SSDs will fare better.
Benchmarking Dell PowerEdge R770
On to the benchmarks, the R770 is Dell’s flagship mainline system and, as such, will be deployed in many diverse environments. So we ran a comprehensive set of benchmarks for this platform to give an idea of how the platform performs in different environments. The Lenovo ThinkSystem SR630 V4 was compared in some tests to show the difference between the top-end E-core and P-core CPUs.
System Configuration
- CPU: 2x Intel Xeon 6787P (86 cores each)
- RAM: 32x Micron 64 GB Dual-Rank DDR5 6400 MT/s Total Memory: 2TB
- Power Supplies: 2x Delta 1500W
- GPU: 1x NVIDIA H100 for the TGI benchmark, 1x NVIDIA L4 for the remaining tests
- NIC: DELL BRCM 4P 25G SFP 57504S OCP NIC
- BOSS Card: BOSS-N1 DC-MHS Disks 0 & 1 SK hynix 480 GB Dell NVMe ISE PE9010 RI M.2 480GB
- Disks: 0-5 in Backplane 1: Samsung 6.4 TB, Dell NVMe PM1745 MU E3.S 6.4TB
AI Workload Performance
Text Generation Inference Benchmark
Text Generation Inference (TGI) is a high-performance LLM inference server developed by Hugging Face. It is designed to optimize the deployment and consumption of LLMs, making it an ideal choice for production environments. TGI supports various open-source LLMs and offers features like tensor parallelism, token streaming, and continuous batching, which enhance its performance and efficiency.

Text Generation Inference – QwQ 32B
The benchmarking feature of TGI is used to evaluate its performance under different configurations and workloads. TGI’s benchmarking feature provides a more accurate representation of real-world performance, as it considers the complexities of serving LLMs in a production setting.
Generating text using LLMs involves two primary stages: the prefill stage and the decode stage. The prefill stage is the initial step, where the LLM processes the input prompt to generate the necessary intermediate representations. This stage is computationally intensive, as it involves processing the entire input prompt in a single forward pass through the model.
During the prefill stage, the input prompt is tokenized and converted into a format that the LLM can process. The LLM then computes the KV cache, which stores information about the input tokens. The KV cache is a critical data structure that facilitates the generation of output tokens.
In contrast, the decode stage is an autoregressive process where the LLM generates output tokens one at a time, building upon the intermediate representations generated during the prefill stage. The decode stage relies heavily on the KV cache generated during the prefill stage, which provides the necessary context for generating coherent and contextually relevant output tokens.
Prefill Stage
As the batch size increases from 1 to 32, the latency for all three models increases; DeepSeek-R1-Distill-Qwen-32 B’s latency increases from 29.97 ms at a batch size of 1 to 76.95 ms at a batch size of 32. Similarly, the latency for GEMMA-3-27B-IT and Qwen/QwQ-32B increases from 51.84 ms and 29.90 ms to 79.58 ms and 76.30 ms, respectively.
In contrast, the token rate improves significantly as the batch size increases. At a batch size of 1, the token rates for the three models range from 192.95 to 334.46 tokens per second. At a batch size of 32, surging to 4158.67, 4021.40, and 4194.13 tokens per second for DeepSeek-R1-Distill-Qwen-32B, GEMMA-3-27B-IT, and Qwen/QwQ-32B, respectively.
| Batch Size | DeepSeek-R1-Distill-Qwen-32B | GEMMA-3-27B-IT | Qwen/QwQ-32B | |||
|---|---|---|---|---|---|---|
| Latency (ms) | Token Rate | Latency (ms) | Token Rate | Latency (ms) | Token Rate | |
| 1 | 29.97 | 333.64 | 51.84 | 192.95 | 29.90 | 334.46 |
| 2 | 30.21 | 662.09 | 52.55 | 380.61 | 29.95 | 667.80 |
| 4 | 32.40 | 1234.72 | 52.62 | 760.12 | 32.12 | 1245.47 |
| 8 | 36.98 | 2163.46 | 52.66 | 1519.19 | 36.69 | 2180.66 |
| 16 | 51.63 | 3125.50 | 60.96 | 2624.64 | 51.29 | 3147.61 |
| 32 | 76.95 | 4158.67 | 79.58 | 4021.40 | 76.30 | 4194.13 |
Decode Stage
Unlike the prefill stage, the latency during the decode stage remains relatively stable across different batch sizes. For example, DeepSeek-R1-Distill-Qwen-32 B’s latency ranges from 27.14 ms to 29.52 ms as the batch size increases from 2 to 32.
The token rate during the decode stage improves with increasing batch size, although not as dramatically as during the prefill stage. At a batch size of 1, the token rate is around 36-37 tokens per second for DeepSeek-R1-Distill-Qwen-32B and Qwen/QwQ-32B, and 33.96 tokens per second for GEMMA-3-27B-IT. At a batch size of 32, the token rates increase to 1083.83, 873.39, and 1084.89 tokens per second, respectively.
| Batch Size | DeepSeek-R1-Distill-Qwen-32B | GEMMA-3-27B-IT | Qwen/QwQ-32B | |||
|---|---|---|---|---|---|---|
| Latency (ms) | Token Rate | Latency (ms) | Token Rate | Latency (ms) | Token Rate | |
| 1 | 27.24 | 36.71 | 29.45 | 33.96 | 27.24 | 36.71 |
| 2 | 27.14 | 73.70 | 30.80 | 64.93 | 27.14 | 73.69 |
| 4 | 27.50 | 145.46 | 31.33 | 127.65 | 27.47 | 145.62 |
| 8 | 27.91 | 286.61 | 32.54 | 245.83 | 27.90 | 286.78 |
| 16 | 28.31 | 565.07 | 34.71 | 460.92 | 28.44 | 562.56 |
| 32 | 29.52 | 1083.83 | 36.64 | 873.39 | 29.50 | 1084.89 |
This is as expected since the prefill stage computes initial hidden states and key-value caches for the entire input prompt, which can saturate the GPU well because large, batched operations can be run simultaneously. After processing the prompt, the model generates new tokens, generally one at a time. At each step, the model takes the previous token and the cached hidden states and produces the next token. Because this stage effectively proceeds token by token, the batch size is often small, so the GPU is frequently underutilized.
Procyon AI Computer Vision Benchmark
Using real-world machine-vision tasks, the Procyon AI Computer Vision Benchmark evaluates AI inference performance across CPUs, GPUs, and AI accelerators. It supports multiple inference engines like TensorRT, OpenVINO, SNPE, Windows ML, and Core ML, providing insights into efficiency, compatibility, and optimization.
The Procyon AI Computer Vision Benchmark results also showcase strong AI inference performance. The system achieved low inference times, with MobileNet V3 at 20.64 ms and ResNet 50 at 22.42 ms. Inception V4 and DeepLab ran at 65.23 ms and 41.37 ms, respectively, handling more complex vision workloads effectively. YOLO V3, a key object detection model, processed in 37.80 ms, making it well-suited for real-time AI applications. REAL-ESRGAN, a computationally intensive super-resolution model, recorded 1,159.22 ms, which gave us an overall AI Computer Vision score of 81.
| AI Computer Vision (Lower duration is better)(Higher Score is better) | Dell PowerEdge R770 (2x Intel Xeon 6787P | 2TB Ram) |
|---|---|
| MobileNet V3 Average Inference Time | 20.64 ms |
| ResNet 50 Average Inference Time | 22.42 ms |
| Inception V4 Average Inference Time | 65.23 ms |
| DeepLab Average Inference Time | 41.37 ms |
| YOLO V3 Average Inference Time | 37.80 ms |
| REAL-ESRGAN Average Inference Time | 1,159.22 ms |
| AI Computer Vision Overall Score | 81 |
Hammer DB TPROC-C
We also evaluated the performance of four popular open-source databases—MariaDB 11.4.4, MySQL 8.4.4, MySQL 5.7.44, and PostgreSQL 17.2—using the HammerDB TPROC-C benchmark to simulate OLTP workloads across 500 warehouses.
MariaDB emerged as the top performer, particularly in dual-socket configurations, where it scaled effectively and achieved the highest transaction throughput. MySQL 8.4.4 showed marked improvements over the legacy 5.7.44 version, highlighting enhancements in recent releases. PostgreSQL 17.2 delivered consistent performance but lagged slightly behind MariaDB and MySQL 8.4.4. MariaDB delivered 3.15 million TPM on a single socket and 5.8 million TPM on dual sockets, outperforming the rest in both scenarios.
Performance comparison Table (Transactions per minute, TPM)
| Database Engine | Single-socket TPM | Dual-socket TPM |
|---|---|---|
| MariaDB 11.4.4 | 3,150,000 | 5,800,000 |
| MySQL 8.4.4 | 2,850,000 | 5,150,000 |
| PostgreSQL 17.2 | 2,700,000 | 4,900,000 |
| MySQL 5.7.44 | 2,300,000 | 4,250,000 |
Despite the R770’s powerful hardware, including 86 cores per CPU (a mix of high and low-priority cores), none of the databases demonstrated significant performance gains when distributed across both sockets. This reflects the common preference of open-source databases for single-socket execution due to better core locality and reduced memory latency.
Given these results, the R770 is better suited for running multiple database instances in a virtualized environment rather than scaling up a single instance. The system’s architecture is ideal for supporting a high-density, mixed-database workload, utilizing both performance and efficiency cores to deliver consistent throughput across many instances.
7-Zip
The popular 7-Zip utility’s built-in memory benchmark measures the performance of a system’s CPU and memory during compression and decompression tasks, indicating how well the system can handle data-intensive operations.
In the 7-Zip benchmark, when it comes to compression tasks, the Dell system had a higher rating (266.425 GIPS) than the Lenovo (224.313 GIPS), with the Dell showing a slightly lower CPU usage. However, Lenovo outperformed Dell in decompression with a higher resulting rating (288.457 GIPS vs. 256.154 GIPS) and somewhat higher CPU usage. Dell had a marginally higher overall total rating of (261.290 GIPS), demonstrating better overall efficiency across both compression and decompression tasks.
| 7-Zip Compression & Decompression | Dell PowerEdge R770 (2x Intel Xeon 6787P | 2TB Ram) | Lenovo ThinkSystem SR630 V4 (2 x Intel Xeon 6780E | 512GB Ram) |
|---|---|---|
| Compressing – Current CPU Usage | 5267% | 5064% |
| Compressing – Current Rating/Usage | 5.061 GIPS | 4.341 GIPS |
| Compressing – Current Rating | 266.591 GIPS | 219.840 GIPS |
| Compressing – Resulting CPU Usage | 5270% | 5156% |
| Compressing – Resulting Rating/Usage | 5.056 GIPS | 4.350 GIPS |
| Compressing – Resulting Rating | 266.425 GIPS | 224.313 GIPS |
| Decompressing – Current CPU Usage | 5623% | 6184% |
| Decompressing – Current Rating/Usage | 4.586 GIPS | 4.688 GIPS |
| Decompressing – Current Rating | 257.909 GIPS | 289.879 GIPS |
| Decompressing – Resulting CPU Usage | 5627% | 6205% |
| Decompressing – Resulting Rating/Usage | 4.553 GIPS | 4.649 GIPS |
| Decompressing – Resulting Rating | 256.154 GIPS | 288.457 GIPS |
| Total – Total CPU Usage | 5448% | 5681% |
| Total – Total Rating/Usage | 4.804 GIPS | 4.500 GIPS |
| Total – Total Rating | 261.290 GIPS | 256.385 GIPS |
y-cruncher
y-cruncher is a popular benchmarking and stress-testing application that launched back in 2009. This test is multi-threaded and scalable, computing Pi and other constants up to the trillions of digits. Faster is better in this test. This software has been fantastic at testing high-core count platforms and showing compute advantages between single and dual-socket platforms.
The Y-cruncher benchmark results show a significant performance gap between the Dell PowerEdge R770, leveraging the P-core CPUs, and the Lenovo ThinkSystem SR630 V4 with E-core CPUs, particularly as the dataset size increases. This is less about which system is better and more about showing how the CPU types compare under this workload.
For smaller calculations, the Dell system was already ahead, computing 1 billion digits of Pi in 2.753 seconds, while the Lenovo took more than twice as long at 5.997 seconds. As the workload scaled up, the gap widened. At 10 billion digits, the Dell finished in 34.873 seconds, less than half the time of the Lenovo’s 81.046 seconds. By the 50 billion digit mark, Dell maintained its advantage, completing the task in 221.255 seconds, while Lenovo took 476.826 seconds, making Dell 53% faster.
At 100 billion digits, Lenovo could not complete the test, due to its current configuration of 512GB RAM. With 2TB of RAM, Dell handled the workload efficiently, finishing in 491.737 seconds.
| Y-cruncher (lower duration is better) | Dell PowerEdge R770 (2x Intel Xeon 6787P | 2TB Ram) | Lenovo ThinkSystem SR630 V4 (2 x Intel Xeon 6780E | 512GB Ram) |
|---|---|---|
| 1 Billion | 2.753 seconds | 5.997 seconds |
| 2.5 Billion | 7.365 seconds | 17.573 seconds |
| 5 Billion | 16.223 seconds | 37.793 seconds |
| 10 Billion | 34.873 seconds | 81.046 seconds |
| 25 Billion | 99.324 seconds | 220.025 seconds |
| 50 Billion | 221.255 seconds | 476.826 seconds |
| 100 Billion | 491.737 seconds |
Blender OptiX
An open-source 3D modeling application. This benchmark was run using the Blender Benchmark utility. The score is samples per minute, with higher being better.
The Blender benchmark results show a clear performance advantage for Dell PowerEdge R770 over the Lenovo ThinkSystem SR630 V4, particularly in CPU rendering. In the CPU Monster scene, Dell achieved 1,706.002 samples per minute, a 19% lead over Lenovo’s 1,432.09 samples per minute. The CPU Junkshop test further emphasized this gap, with the Dell reaching 1,169.370 samples per minute, outperforming the Lenovo’s 914.75 samples per minute by 28%. Similarly, Dell posted 791.475 samples per minute in the CPU Classroom test, while Lenovo lagged at 656.68 samples per minute, a 20% difference.
The lack of a GPU in the Lenovo system also meant it couldn’t participate in GPU-based rendering, where Dell’s NVIDIA L4 showed a score of 1,895.71 Samples/Min for Monster, 950.42 Samples/Min, and a Classroom score of 968.43 Samples/Min.
| Blender CPU Benchmark | Dell PowerEdge R770 (2x Intel Xeon 6787P | 2TB Ram) | Lenovo ThinkSystem SR630 V4 (2 x Intel Xeon 6780E | 512GB Ram) |
|---|---|---|
| CPU Monster (Blender 4.3) | 1,706.002 Samples/Min | 1432.09 Samples/Min |
| CPU Junkshop (Blender 4.3) | 1,169.370 Samples/Min | 914.75 Samples/Min |
| CPU Classroom (Blender 4.3) | 791.475 Samples/Min | 656.68 Samples/Min |
| GPU Monster (Blender 4.3) | 1,895.712 Samples/Min | (no gpu) |
| GPU Junkshop (Blender 4.3) | 950.424 Samples/Min | (no gpu) |
| GPU Classroom (Blender 4.3) | 968.432 Samples/Min | (no gpu) |
Cinebench R23
The Cinebench R23 benchmark tool evaluates a system’s CPU performance by rendering a complex 3D scene using the Cinema 4D engine. It measures single-core and multi-core performance, providing a comprehensive view of the CPU’s capabilities in handling 3D rendering tasks.
In Cinebench R23, the benchmark results highlight notable differences in CPU performance between the Dell PowerEdge R770 and the Lenovo ThinkSystem SR630 V4, especially considering the number of cores per processor. The Lenovo ThinkSystem SR630 V4, equipped with 2x Intel Xeon 6780E processors (144 cores per processor), outperformed the Dell in the CPU Multi-Core test with a score of 99,266 points, compared to the Dell’s 74,710 points. This difference reflects Lenovo’s advantage in multi-threaded workloads, thanks to its higher core count (288 total cores) compared to Dell’s 2x Intel Xeon 6787P processors (86 cores per processor), which limits its multi-core performance.
In the CPU Single-Core test, Dell performed better with a score of 1,272 points, surpassing Lenovo’s 894 points, highlighting Dell’s superior single-threaded efficiency despite its lower core count.
| Cinebench R23 | Dell PowerEdge R770 (2x Intel Xeon 6787P | 2TB Ram) | Lenovo ThinkSystem SR630 V4 (2 x Intel Xeon 6780E | 512GB Ram) |
|---|---|---|
| CPU Multi-Core | 74,710 pts | 99,266 pts |
| CPU Single-Core | 1,272 pts | 894 pts |
| MP Ratio | 58.74 x | 111.00 x |
Cinebench 2024
Cinebench 2024 extends R23’s benchmark capabilities by adding GPU performance evaluation. It continues to test CPU performance but also includes tests that measure the GPU’s ability to handle rendering tasks.
In this updated benchmark, the Dell PowerEdge R770 scored 12,996 points for GPU performance, highlighting its ability to handle GPU-accelerated rendering tasks. The Lenovo ThinkSystem SR630 V4 doesn’t have a dedicated GPU, so it did not register a GPU score.
In the CPU Multi-Core test, the Lenovo scored 2,884 points, slightly ahead of Dell’s 2,831 points, indicating a slight edge in multi-core performance for the Lenovo. For CPU Single-Core, the Dell outperformed the Lenovo, scoring 71 points, compared to the Lenovo’s 53 points, showcasing the Dell’s higher single-core performance despite having fewer cores.
| Cinebench R24 | Dell PowerEdge R770 (2x Intel Xeon 6787P | 2TB Ram) | Lenovo ThinkSystem SR630 V4 (2 x Intel Xeon 6780E | 512GB Ram) |
|---|---|---|
| GPU Score | 12,996 pts | |
| CPU Multi-Core | 2,831 pts | 2,884 pts |
| CPU Single-Core | 71 pts | 53 pts |
| MP Ratio | 39.77 x | 54.43 x |
Geekbench 6
Geekbench 6 is a cross-platform benchmark that measures overall system performance. The Geekbench Browser allows you to compare any system to it.
The Geekbench 6 benchmark results demonstrate obvious performance differences between the Dell PowerEdge R770 and the Lenovo ThinkSystem SR630 V4. In the CPU Single-Core test, the Dell outperformed the Lenovo with a score of 1,797, while the Lenovo scored 1,173, indicating a 53% improvement in single-core performance for the Dell.
In the CPU Multi-Core test, Dell again led with 15,880, while Lenovo scored 13,868, giving Dell a 14% advantage in multi-core performance. This suggests that Dell’s Intel Xeon 6787P processors provide superior overall computational power, especially in tasks that benefit from multiple cores.
The GPU OpenCL test highlighted Dell’s advantage further, with a score of 148,730 thanks to the NVIDIA L4 GPU.
| Geekbench 6 (Higher is better) | Dell PowerEdge R770 (2x Intel Xeon 6787P | 2TB Ram) | Lenovo ThinkSystem SR630 V4 (2 x Intel Xeon 6780E | 512GB Ram) |
|---|---|---|
| CPU Single-Core | 1,797 | 1,173 |
| CPU Multi-Core | 15,880 | 13,868 |
| GPU OpenCL Score | 148,730 | (no gpu) |
Blackmagic RAW Speed Test
The Blackmagic RAW Speed Test is a performance benchmarking tool designed to measure a system’s capabilities in handling video playback and editing using the Blackmagic RAW codec. It evaluates how well a system can decode and play back high-resolution video files, providing frame rates for both CPU- and GPU-based processing.
In the CPU-based test, the Dell PowerEdge R770 achieved 141 FPS, outperforming the Lenovo ThinkSystem SR630 V4, which scored 120 FPS. This indicates that the Dell system handles CPU-based video processing more efficiently than the Lenovo. For the GPU-based test, the Dell PowerEdge R770 scored 157 FPS, benefiting from the presence of an NVIDIA GPU.
| Blackmagic RAW Speed Test (higher is better) | Dell PowerEdge R770 (2x Intel Xeon 6787P | 2TB Ram) | Lenovo ThinkSystem SR630 V4 (2 x Intel Xeon 6780E | 512GB Ram) |
|---|---|---|
| FPS CPU | 141 FPS | 120 FPS |
| FPS CUDA | 157 FPS | 0 FPS (no GPU) |
Blackmagic Disk Speed Test
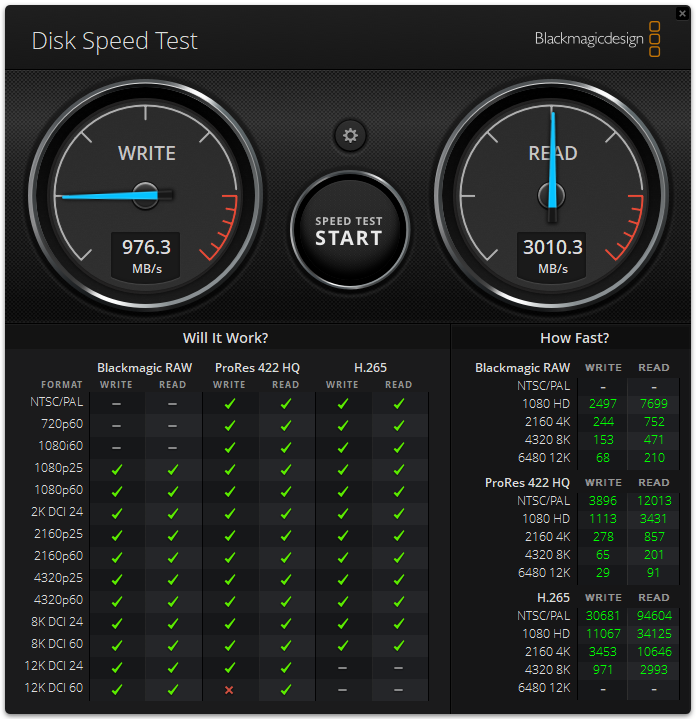
The Blackmagic Disk Speed Test benchmarks a drive’s read and write speeds, estimating its performance, especially for video editing tasks. It helps users ensure their storage is fast enough for high-resolution content, like 4K or 8K video.
In the Blackmagic speed test, the Dell PowerEdge R770 boss card with mirrored SK hynix 480GB Dell NVMe achieved a read speed of 3,010.3 MB/s and a write speed of 976.3 MB/s.
Conclusion
The Dell PowerEdge R770 really excites us, driven by its adoption of the Open Compute Project’s Data Center Modular Hardware System standard and cutting-edge hardware. The integration of OCP DC MHS brings numerous benefits, including enhanced modularity, improved serviceability, and potentially reduced costs through increased standardization. This design philosophy is evident in all aspects of the system, from implementing iDRAC as an OCP DC-SCM down to the ports.
The R770 also boasts impressive storage capabilities, supporting up to 40 E3.S drives in a single 2U chassis, making it an ideal solution for storage-intensive workloads. Additionally, the server’s flexibility is further enhanced by its support for various configurations, including a Front I/O Cold Aisle Accessible configuration, providing greater flexibility for different data center layouts and serviceability requirements.
With support for a broad list of GPUs and Intel’s Xeon 6 Performance core CPUs, the R770 is truly a powerhouse and versatile server platform well-suited to meet the demands of modern data centers. Its cutting-edge hardware, modular design, and robust security features make the R770 an attractive option for organizations looking to deploy AI, HPC, and traditional enterprise workloads.

Engage with StorageReview
Newsletter | YouTube | Podcast iTunes/Spotify | Instagram | Twitter | TikTok | RSS Feed