The Dell Precision 7865 is a high-end enterprise AMD workstation designed to address the most demanding desktop applications. Featuring up to a 64-core Ryzen Threadripper Pro and 1TB of RAM, it directly competes with single- and dual-CPU Intel workstations.
The Dell Precision 7865 is a high-end enterprise AMD workstation designed to address the most demanding desktop applications. Featuring up to a 64-core Ryzen Threadripper Pro and 1TB of RAM, it directly competes with single- and dual-CPU Intel workstations.
The Dell Precision 7865 is a monolith AMD workstation using Threadripper Pro processors. Its basic spec sheet is impressive, supporting 64 CPU cores on a single chip, two high-end GPUs, 1TB of RAM, and 56TB of total storage.
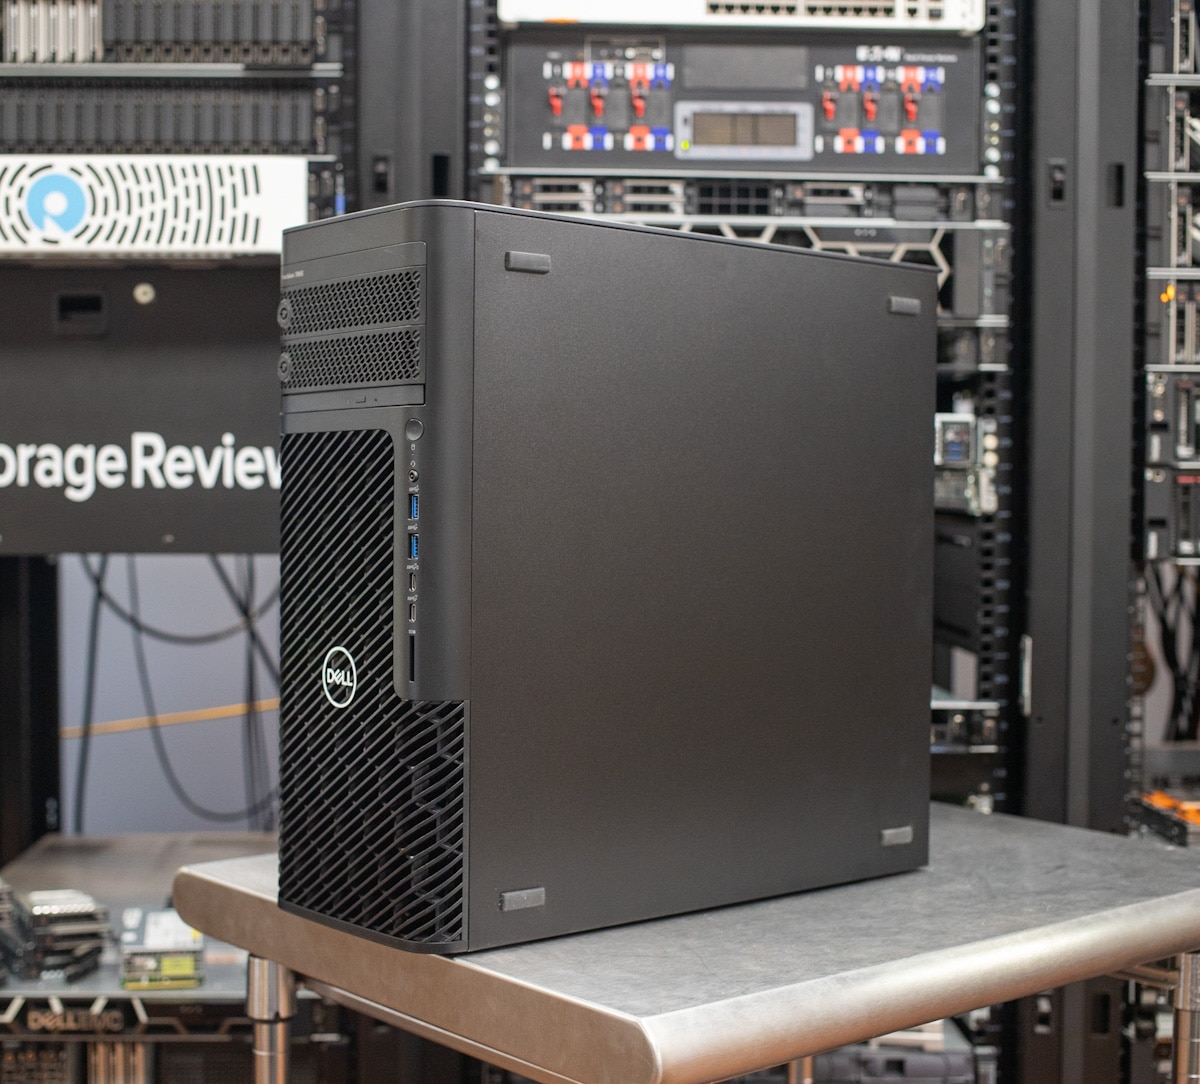
Dell Precision 7865
The Threadripper Pro 5000 series is offered in 12-, 16-, 24-, 32-, and 64-core increments, so it matches up nicely with Intel’s Xeon W-class offerings. Unlike the normal Threadripper, the Threadripper Pro is a manufacturer exclusive and only available to OEMs like Dell.
The Pro chips offer improved security features and more PCI Express lanes. Add in eight-channel ECC memory support, and the Threadripper Pro is much more capable than even the highest-end consumer desktop processors, AMD’s 16-core Ryzen 9 7950X and Intel’s Core i9-13900K.
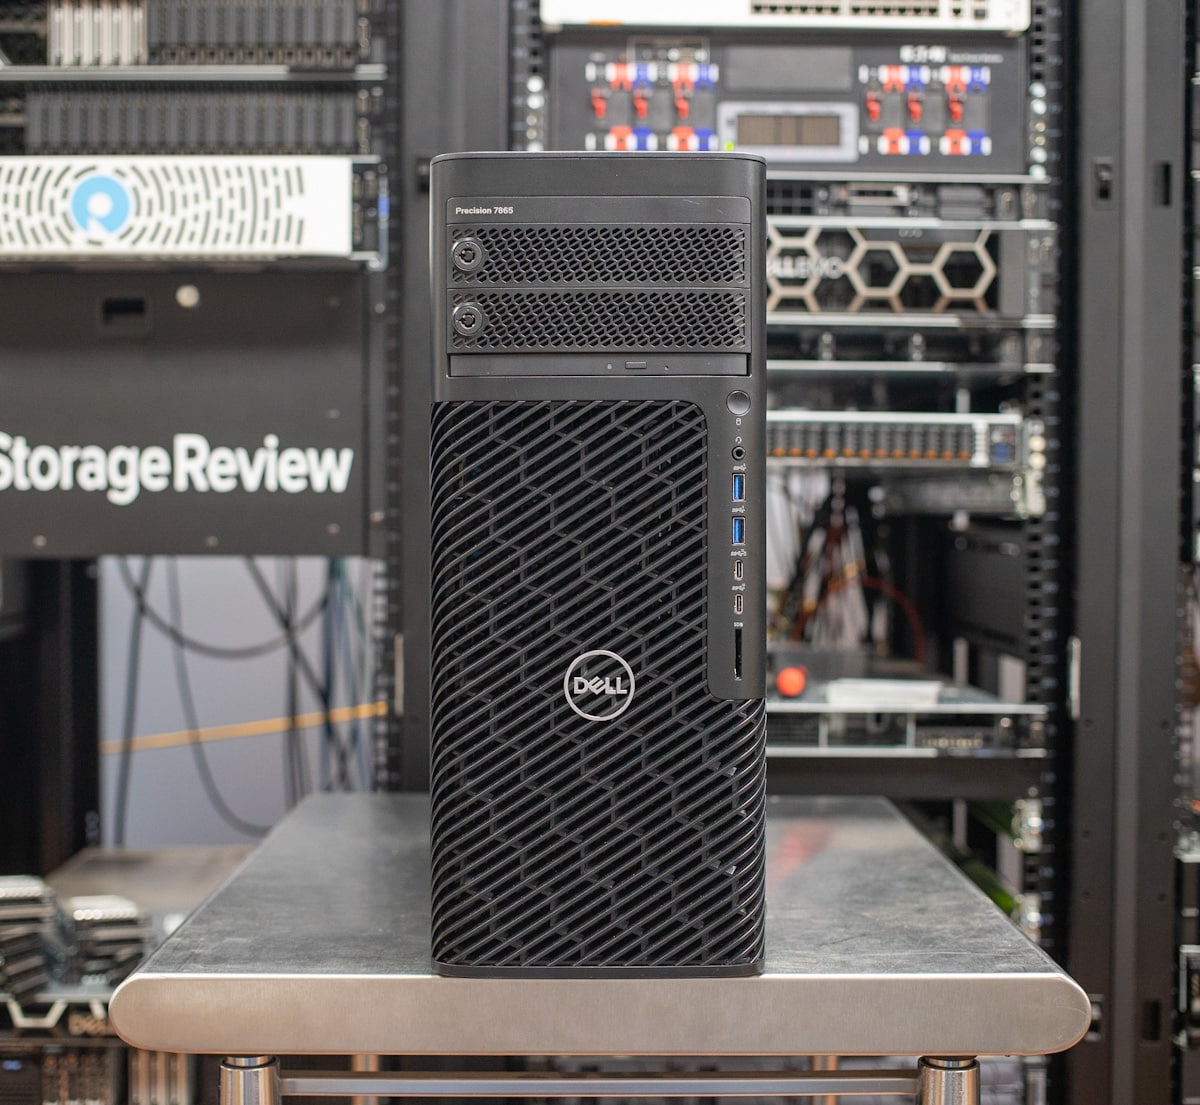
Dell Precision 7865 Front Bezel
The Precision 7865 can accommodate two 48GB NVIDIA RTX A6000 or 32GB AMD Radeon PRO W6800 graphics cards, thanks to its 1,350-watt power supply option. Cooling such powerful components is a challenge, but we’ll cover that later in the article. (In short, the Precision 7865 is up to the task.)
Storage options vary; Dell says up to 56TB of total storage can fit inside the Precision 7865. Options include two external flex bays for hot-swap drives, internal 3.5-inch bays, and PCI Express cards with M.2 slots.
The Precision 7865’s basic specifications are as follows:
| Component | Options |
| Processor |
|
| Chipset | AMD® WRX80 Premium |
| Operating System |
|
| Memory | Up to 1TB DDR4 (8 RDIMMs, 128GB per slot) |
| Primary Hard Drive | Up to 4TB Gen4 SSD or 8TB 3.5-inch HDD |
| Graphics |
|
| Optical Drive |
|
| Power Option | 1350W Platinum internal power supply unit |
| Ports | Front:
Rear:
|
| Slots |
|
| Dimensions | Height: 16.29in. (414.00mm) / 16.45in. (417.90mm) with rubber foot protruding
Width: 6.79in. (172.60mm) / 6.94in. (176.50mm) with rubber foot protruding Depth: 16.90in. (429.60mm) / 17.79in. (452.10mm) with lock structure protruding Weight:
|
| Hardware Security |
|
| Configuration Services |
|
| Systems Management |
|
| Add-In Cards |
|
Dell Precision 7865 Build and Design
At 16.3 x 6.9 by 17.8 inches (HWD), the Precision 7865 is a full-tower workstation. The front grate is plastic, but the rest of the tower is steel and very sturdy. The weight ranges from 35.5 to 48.2 pounds depending on the configuration. A top carry handle helps any movement tremendously.
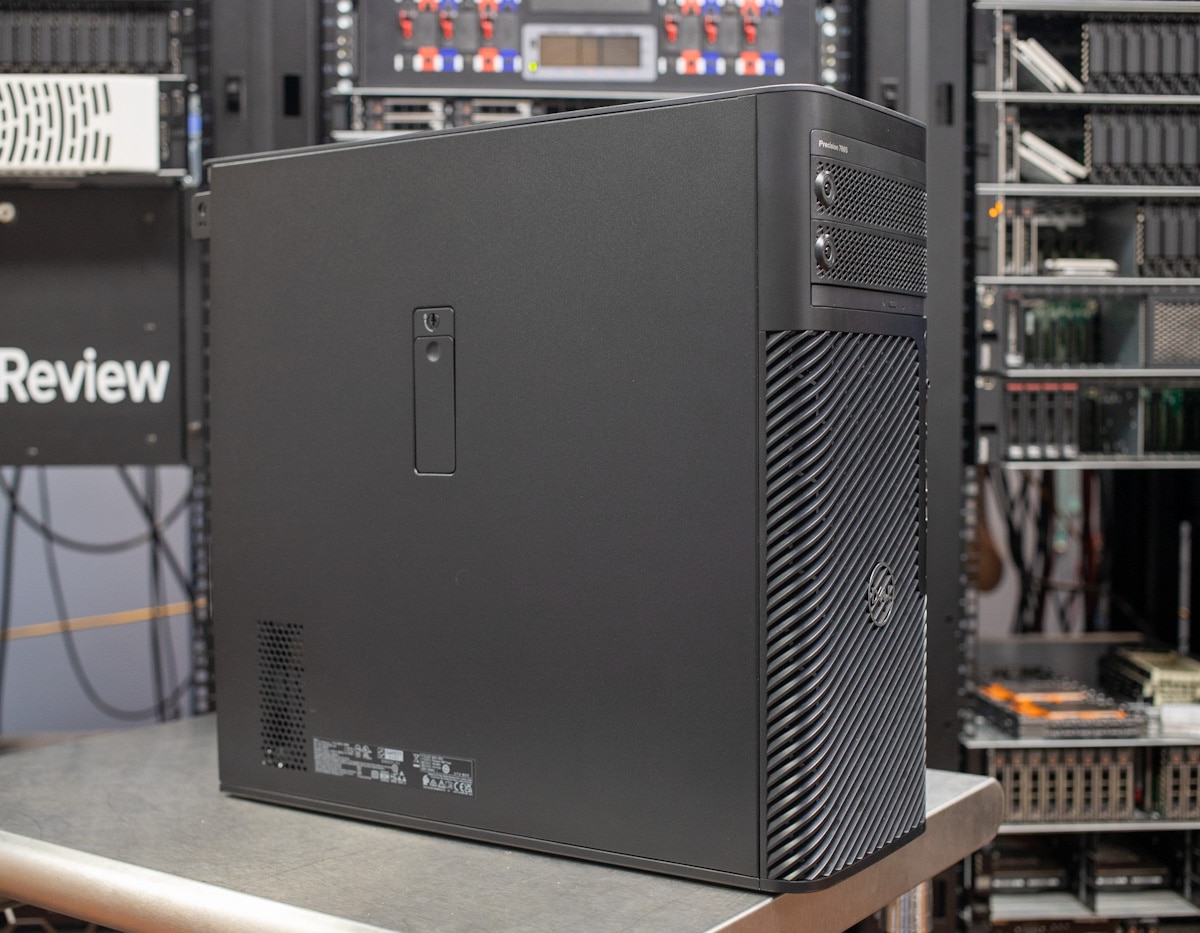
Dell Precision 7865 Side Door
We’re using the Precision 7865 in its upright configuration, but the right panel has rubber feet so it can operate horizontally, too. Dell even sells a rail-mount kit for rack use, which has some advantages for organizations concerned about securing both the data and physical unit.
Most of the front panel is perforated, illustrating the huge importance of airflow in a machine this powerful. Front-panel ports include two USB-A 3.2 Gen 1 (5Gbps), two USB-C 3.2 Gen 2 (10Gbps, one with power share), an audio jack, and a full-size SD card reader. The power button and disk activity LED are also here.
Our review unit has the optional flex bay chassis, with two bays. An M.2 or 3.5-inch drive can be installed in either, and they’re secured by a key lock. The optional laptop-style tray-load optical drive resides just below them. Overall, the front panel is cleanly designed.
The left door comes off for servicing and component upgrades; it’s secured by a key, and you can furthermore use a padlock loop. Intrusion detection is also standard.
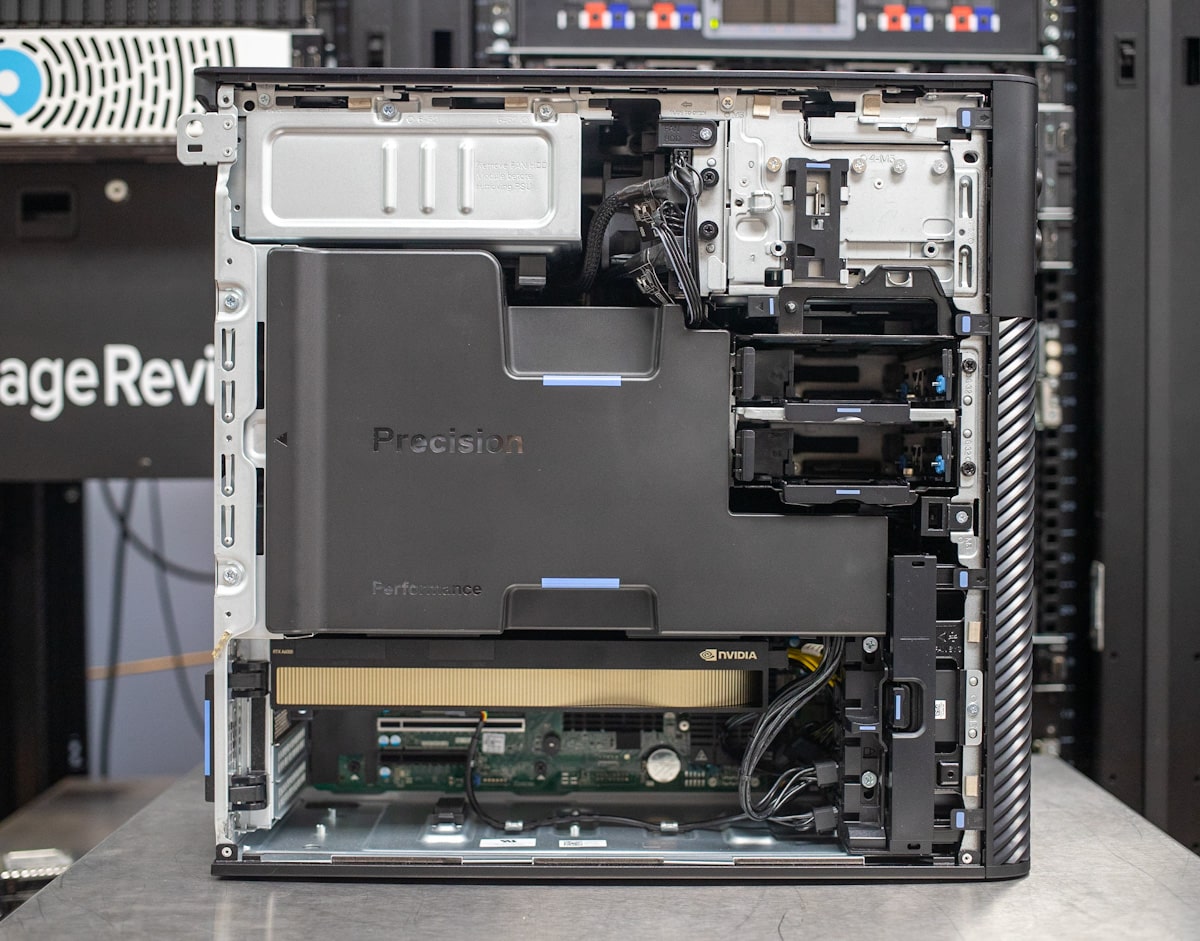
Dell Precision 7865 Side Panel Removed
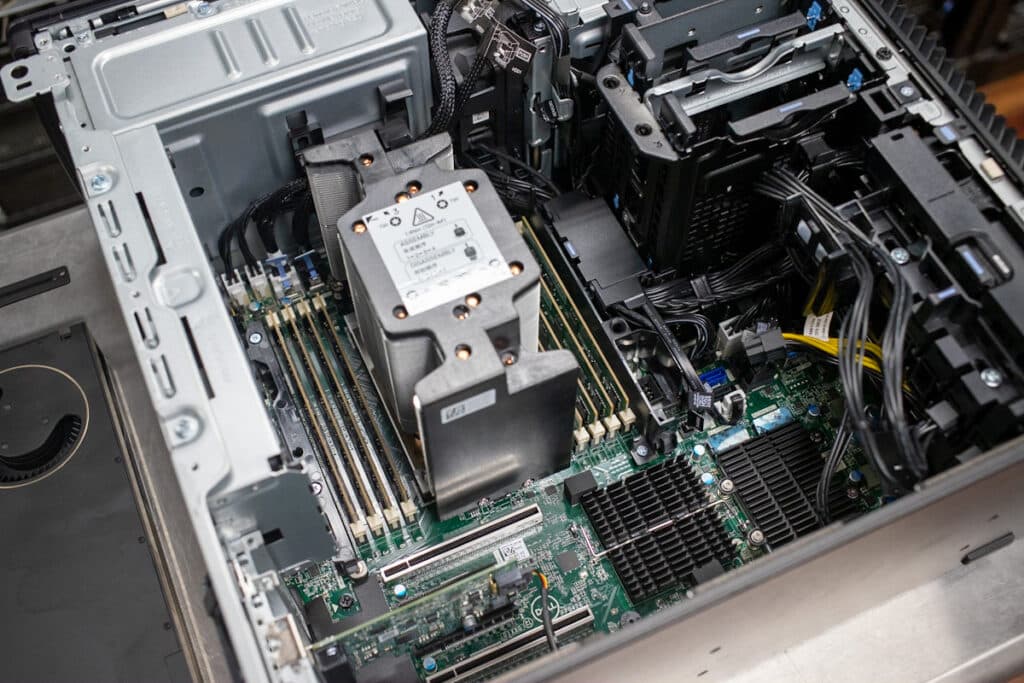
Most of the interior is hidden by the massive airflow shroud over the Ryzen Threadripper Pro processor. You can just see the NVIDIA RTX A6000 graphics card.
The airflow shroud comes out without needing tools, notice it has its own fan embedded within.
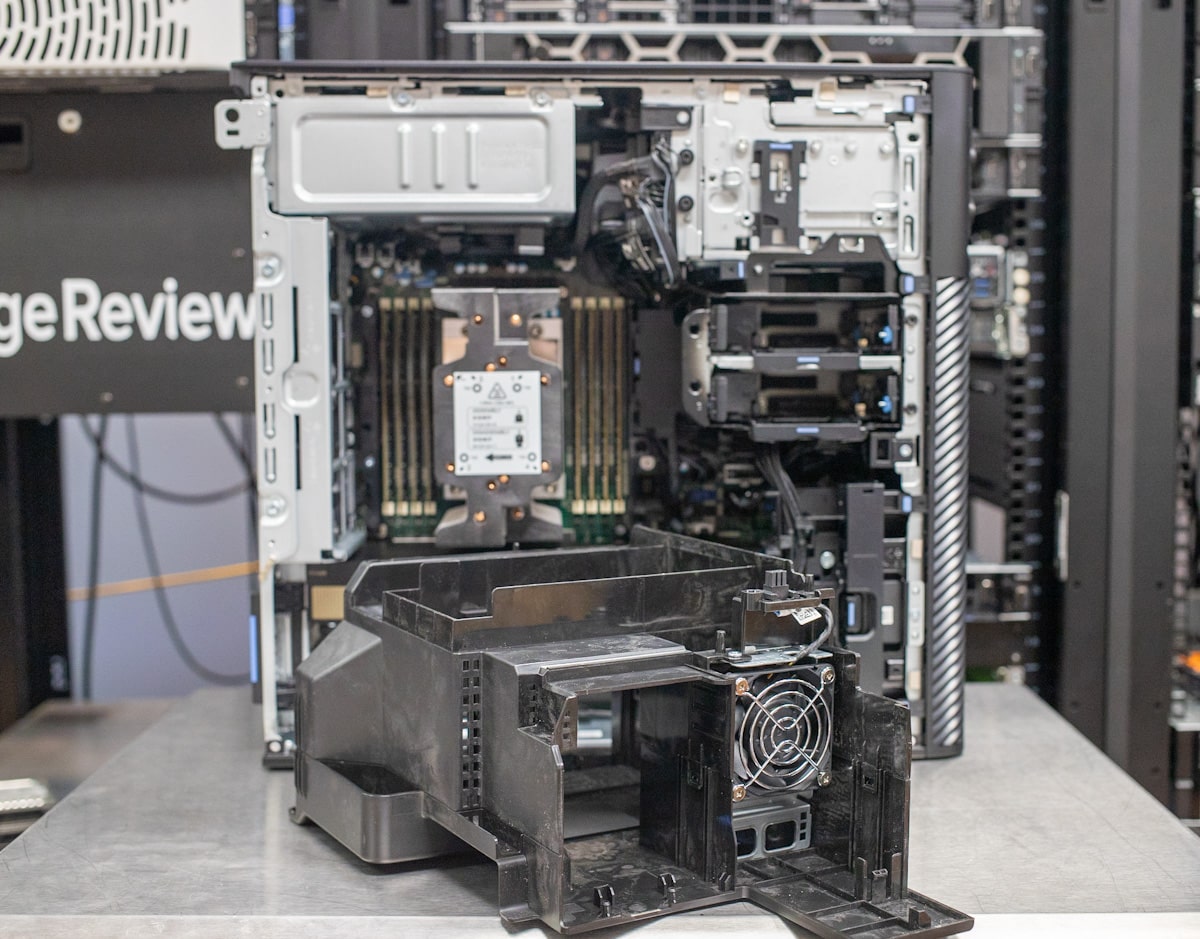
Dell Precision 7865 Air Shroud
Here, you can see the enormous processor heatsink flanked by eight RDIMM slots. Note the auxiliary heatsinks on the chipset. The plastic guides at the front of the chassis secure the NVIDIA RTX A6000 and other expansion cards, so they don’t put extra stress on the motherboard. Also, note the two 3.5-inch bays in this view.
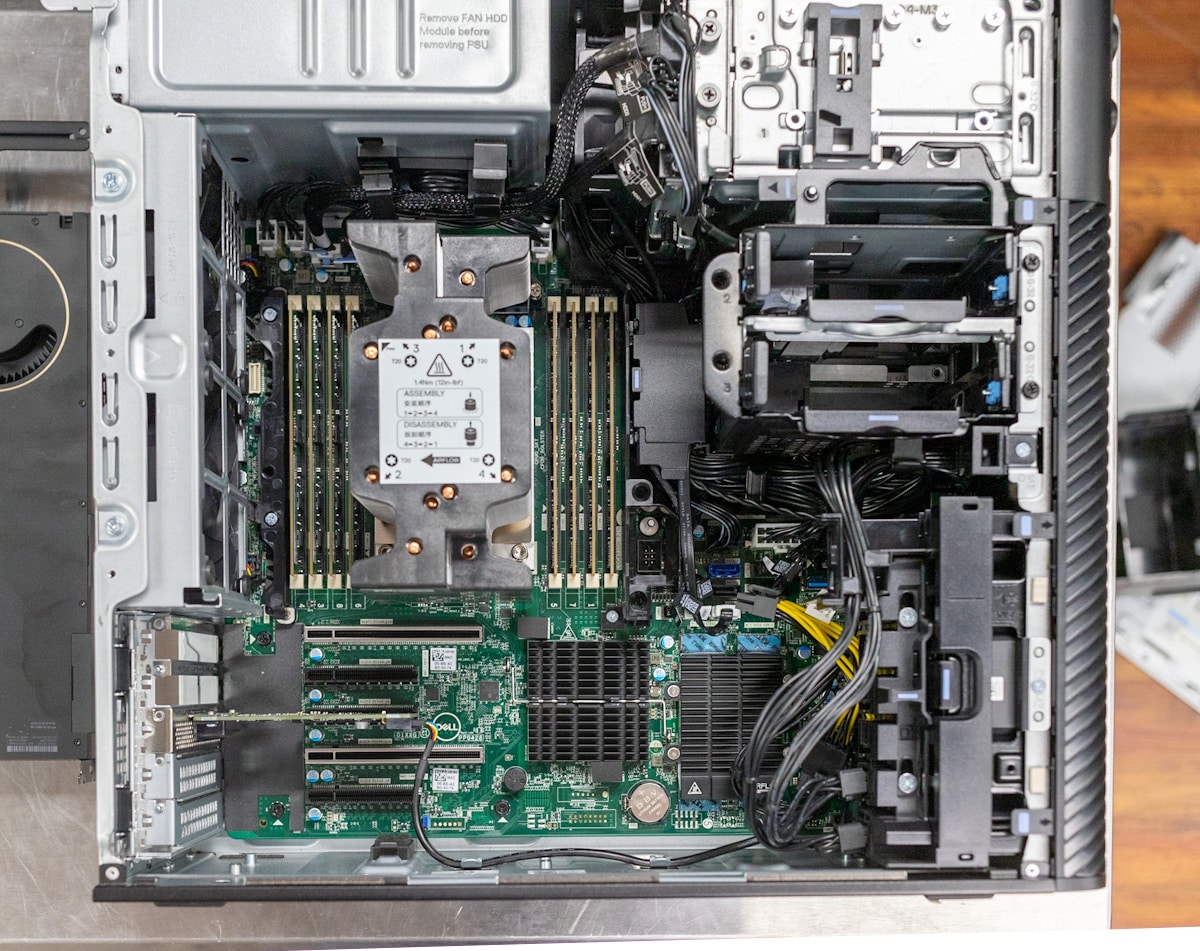
Dell Precision 7865 System Board
The Precision’s rear almost looks plain. The power supply is up top, and below is the massive cooling exhaust grate. Ports on the motherboard backplane include legacy PS/2 keyboard and mouse ports, audio line-out, 1Gbps and 10Gbps Ethernet, three USB-C 3.2 Gen 2 ports, and three USB-A 3.2 Gen 1 ports. Dell offers lots of add-in cards for additional connectivity, including Ethernet adapters, wireless cards, and Thunderbolt 3 or USB4 cards.
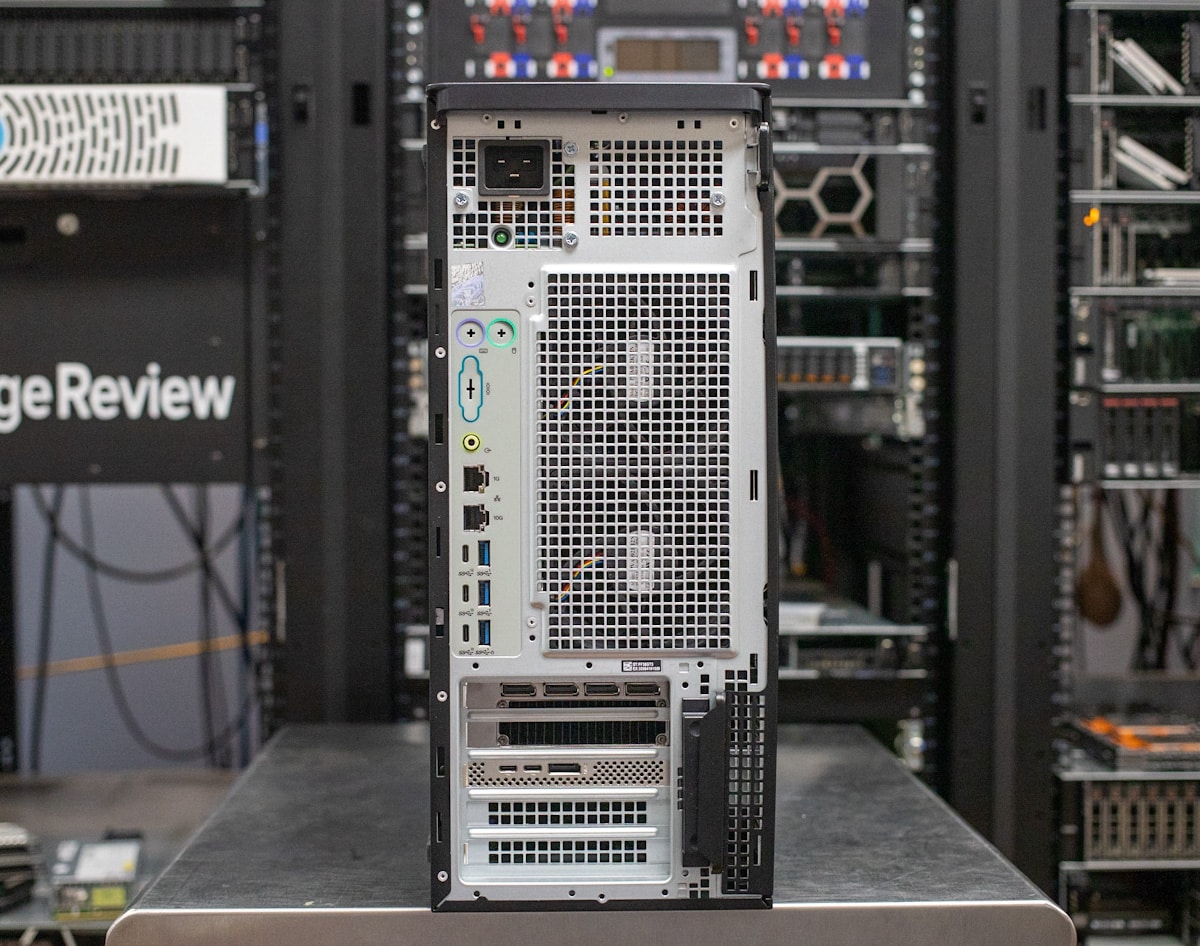
Dell Precision 7865 Back
Dell Precision 7865 Cooling
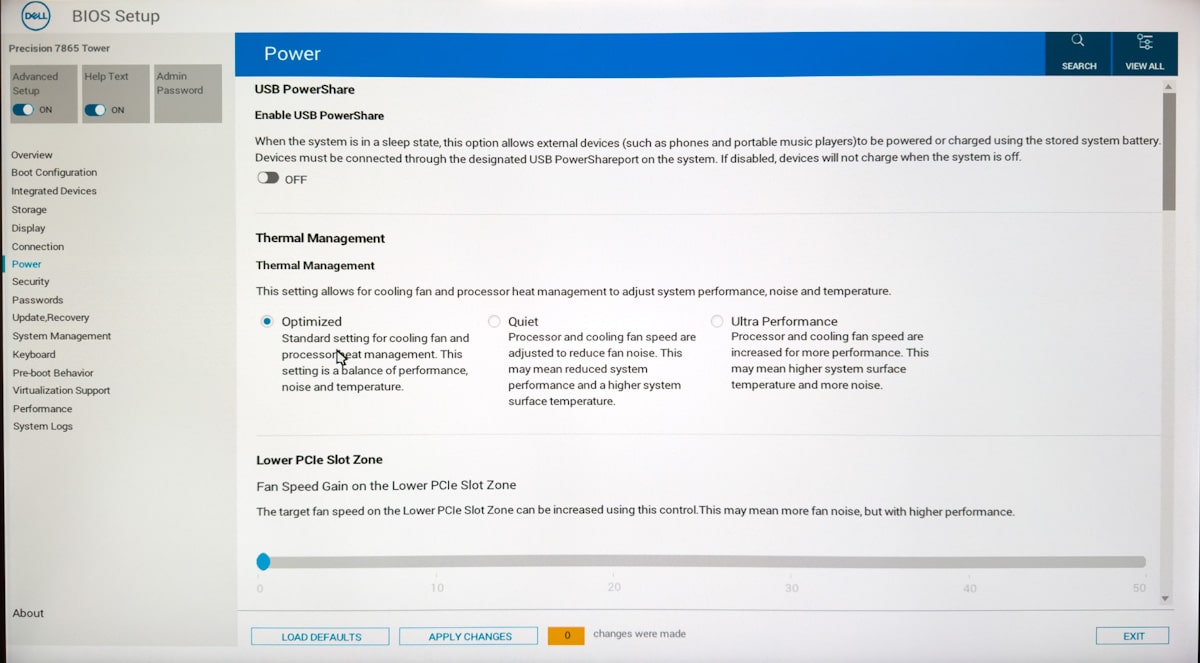
Dell gives the end user a ton of flexibility when it comes to the acoustic management of the Precision 7865. When we got the system in our hands for testing, the unit was configured with a stock cooling profile that was set to “Optimized.” This offered an interesting profile that caused the CPU to get quite toasty but didn’t impact performance results in our A/B testing.
In fact, we ran all of our tests in this cooling profile, and while the 7865 ran hot, performance was still fantastic. We then came through and benchmarked the system again in CPU-heavy workloads in “Ultra Performance” mode, which did see a very small boost in performance. This mode had the primary benefit of dramatically lowering the CPU temps without a huge increase in noise.
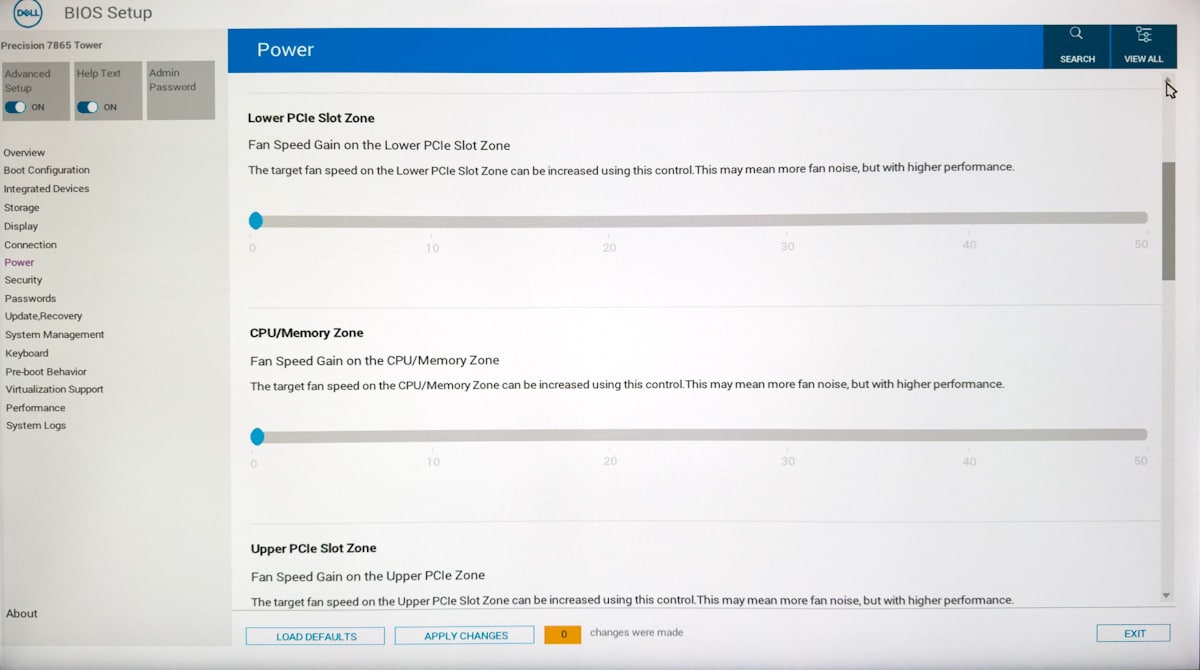
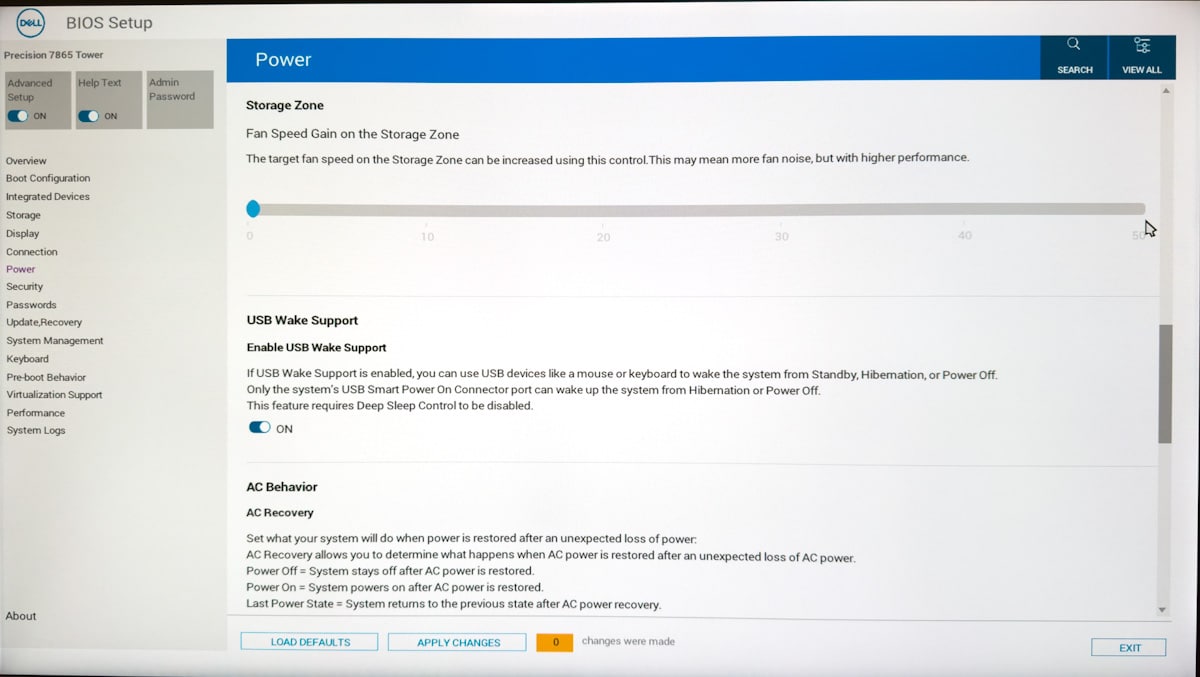
Dell offers many areas to customize specific zones inside the workstation, including the Lower PCIe slot, CPU/Memory Zone, Upper PCIe Slot, and Storage Zone.
These customizations are all very useful in an enterprise workstation setting, where certain devices like edge-card SSDs, NICs, and other add-on cards could require cooling that fits outside a normal profile.
While the CPU profile change doesn’t dramatically increase the noise profile, the zone changes do if you go overboard. With all of these settings maxed out the Precision 7865 moves a serious amount of air with plenty of noise to go with it. Slight changes to the adjustment sliders are the best approach here, as the fans pack a serious punch if the duty calls.
In comparison to the other Threadripper systems we’ve seen, Dell’s cooling approach is the most customizable. And while maxing the fans is an option, it’s probably not needed outside of fringe use cases. In that event, the 7865 is probably best put on rails or otherwise relocated to the data center where the noise won’t bother anyone.
Dell Precision 7865 Performance
Our Precision 7865 review unit has the following configuration:
- Windows 11 Pro
- 1350W chassis
- AMD Threadripper Pro 5995WX (64 cores, 128 threads, 280W)
- Nvidia RTX A6000 (48GB)
- 64GB DDR4-3200 ECC (8x 8GB)
- 2x 1TB Gen4 SSD RAID0 (Dell Class 40)
- Optimized Cooling Profile
This configuration comes out to $15,542.85 from Dell’s site at review time, which is about right for a workstation of this caliber. A Lenovo ThinkStation P620 commands about the same. It can, of course, get much more expensive if you add more RAM, storage, or a second graphics card.
We will be comparing the Precision 7865 to the following systems:
- Windows 10 Pro
- AMD Threadripper Pro 5995WX (64-core)
- 1TB (8x 128GB DDR4-3200 RDIMMs)
- 1x 2TB SSD M.2 2280 PCIe 4.0 NVMe Opal
- NVIDIA RTX A6000 (48GB GDDR6 ECC)
SuperMicro SuperWorkstation 5014A-TT
- Windows 10 Pro
- AMD Threadripper Pro 3995WX (64-core)
- 256GB DDR4-3200 ECC 8-channel RAM (8x 32GB)
- 1TB PCIe 4.0 SSD (Samsung PM981)
- NVIDIA RTX A6000 (48GB GDDR6 ECC)
Our Intel Core i9-12900K (Alder Lake) test rig (in some tests):
- Intel Core i9-12900K CPU (slightly undervolted)
- Asus ROG Strix Z690-E Gaming WiFi motherboard
- Microsoft Windows 11
- 32GB of Kingston Fury DDR5-5200 RAM (2x 16GB)
- Seagate FireCuda 530 2TB SSD
- NVIDIA RTX A6000 (48GB GDDR6 ECC)
We normally start workstation testing with SPECworkstation, but it refused to complete on the Precision 7865. We’ll therefore proceed with our other tests.
SPECviewperf 2020
SPECviewperf 2020 is the worldwide standard for measuring graphics performance of professional applications under the OpenGL and Direct X application programming interfaces. The viewsets (or benchmarks) represent graphics content and behavior from actual applications, without having to install the applications themselves. The newest version of this benchmark went through major updates late last year, including new viewsets taken from traces of the latest versions of 3ds Max, Catia, Maya, and Solidworks applications. In addition, they added support within all viewsets for both 2K and 4K resolution displays. Our tests were run with a windowed resolution of 3800×2120.
Performance in SPECviewperf 2020 remained very close to the updated Lenovo P620 with the same processor and GPU. The Del
| SPECviewperf 2020 (Higher is better) | ||||
| Viewsets | Lenovo ThinkStation P620 (Nvidia RTX A6000) | Supermicro AS-5014A-TT (Nvidia RTX A6000) | Dell Precision 7865 (AMD 5995WX, RTX A6000) | StorageReview Test Rig (Core i9-12900K, RTX A6000) |
| 3dsmax-07 | 139.85 | 132.52 | 140.79 | 138.71 |
| Catia-06 | 101.37 | 90.22 | 100.57 | 99.21 |
| Creo-03 | 134.77 | 129.73 | 137.39 | 154.25 |
| Energy-03 | 42.45 | 42.18 | 42.95 | 42.89 |
| Maya-06 | 342.75 | 317.29 | 334.18 | 334.1 |
| Medical-03 | 35.51 | 34.65 | 35.98 | 34.92 |
| Snx-04 | 471.05 | 452.17 | 453.83 | 446.73 |
| Sw-05 | 169.19 | 161.69 | 170.08 | 166.42 |
Blender OptiX
Blender is an open-source 3D modeling application. This benchmark was run using the Blender Benchmark utility. The score is samples per minute, with higher being better. The SuperMicro is excluded from this test since we only recently switched to a new version of Blender. The Precision 7865 takes minor leads across the board, especially in the Monster subtest.
| Blender OptiX (Samples per minute, Higher is better) | |||
| Category | Dell Precision 7865 (AMD 5995WX, RTX A6000) | Lenovo ThinkStation P620 (AMD 5995WX, RTX A6000) | StorageReview Test Rig (Core i9-12900K, RTX A6000) |
| Monster | 2,839 | 2,764 | 2,774 |
| Junkshop | 1,595 | 1,537 | 1,552 |
| Classroom | 1,384 | 1,369 | 1,364 |
Luxmark
Another 3D benchmark we will be looking at is LuxMark, an OpenCL GPU benchmarking utility. As this test is GPU limited and all the systems are using the same RTX A6000, the Precision 7865 performs at expectations – that is, just like the others.
| Luxmark (Higher is better) | ||||
| Dell Precision 7865 (AMD 5995WX, RTX A6000) | Lenovo ThinkStation P620 (AMD 5995WX, RTX A6000) | SuperMicro AS-5014A-TT (AMD 3995WX, RTX A6000) | StorageReview Test Rig (Core i9-12900K, RTX A6000) | |
| Hallbench | 20,991 | 20,889 | 20,788 | 21,365 |
| food | 7,866 | 7,643 | 7,990 | 8,088 |
ESRI
Next up is the Environmental Systems Research Institute (Esri) benchmark. Esri is a supplier of Geographic Information System (GIS) software. Esri’s Performance Team designed their PerfTool add-in scripts to automatically launch the ArcGIS Pro. This application uses a “ZoomToBookmarks” function to browse various predefined bookmarks and create a log file with all the key data points required to predict the user experience. The script automatically loops the bookmarks three times to account for caching (memory and disk cache). In other words, this benchmark simulates heavy graphical use that one might see through Esri’s ArcGIS Pro software.
The tests consist of three main datasets. Two are 3-D city views of Philadelphia, PA, and Montreal, QC. These city views contain textured 3-D multipatch buildings draped on a terrain model and draped aerial images. The third dataset is a 2-D map view of the Portland, OR region. This data contains detailed information for roads, land use parcels, parks and schools, rivers, lakes, and hill shaded terrain.
The StorageReview test rig dominates the results. The Precision 7865 is competitive among the workstations in Montreal and Portland, but it underperformed for reasons unknown to us in the Philly model.
First up is the Montreal model:
| ESRI ArcGIS Pro 2.3 Montreal | |
| Average FPS | Average |
| Dell Precision 7865 (AMD 5995WX, RTX A6000) | 574.46 |
| Lenovo ThinkStation P620 (AMD 5995WX, RTX A6000) | 575.68 |
| SuperMicro AS-5014A-TT (AMD 3995WX, RTX A6000) | 559.36 |
| StorageReview Test Rig (Core i9-12900K, RTX A6000) | 607.29 |
| Minimum FPS | Average |
| Dell Precision 7865 (AMD 5995WX, RTX A6000) | 272.18 |
| Lenovo ThinkStation P620 (AMD 5995WX, RTX A6000) | 260.41 |
| SuperMicro AS-5014A-TT (AMD 3995WX, RTX A6000) | 238.69 |
| StorageReview Test Rig (Core i9-12900K, RTX A6000) | 324.74 |
Next is the Philly model:
| ESRI ArcGIS Pro 2.3 Philly | |
| Average FPS | Average |
| Dell Precision 7865 (AMD 5995WX, RTX A6000) | 451.09 |
| Lenovo ThinkStation P620 (AMD 5995WX, RTX A6000) | 576.81 |
| SuperMicro AS-5014A-TT (AMD 3995WX, RTX A6000) | 443.69 |
| StorageReview Test Rig (Core i9-12900K, RTX A6000) | 473.49 |
| Minimum FPS | Average |
| Dell Precision 7865 (AMD 5995WX, RTX A6000) | 254.78 |
| Lenovo ThinkStation P620 (AMD 5995WX, RTX A6000) | 273.10 |
| SuperMicro AS-5014A-TT (AMD 3995WX, RTX A6000) | 222.93 |
| StorageReview Test Rig (Core i9-12900K, RTX A6000) | 279.93 |
Last is the Portland model:
| ESRI ArcGIS Pro 2.3 Portland | |
| Average FPS | Average |
| Dell Precision 7865 (AMD 5995WX, RTX A6000) | 1986.56 |
| Lenovo ThinkStation P620 (AMD 5995WX, RTX A6000) | 2049.83 |
| SuperMicro AS-5014A-TT (AMD 3995WX, RTX A6000) | 2156.69 |
| StorageReview Test Rig (Core i9-12900K, RTX A6000) | 2980.10 |
| Minimum FPS | Average |
| Dell Precision 7865 (AMD 5995WX, RTX A6000) | 1280.95 |
| Lenovo ThinkStation P620 (AMD 5995WX, RTX A6000) | 1139.48 |
| SuperMicro AS-5014A-TT (AMD 3995WX, RTX A6000) | 837.69 |
| StorageReview Test Rig (Core i9-12900K, RTX A6000) | 1360.30 |
OctaneBench
Next, we look OctaneBench, a benchmarking utility for OctaneRender, which is another 3D renderer with RTX support that is similar to V-Ray. The Precision 7865 mixes in with the ThinkStation P620 and the StorageReview test right in this GPU-bound test. The SuperMicro should have also mixed in but didn’t; we consider its low scores an anomaly.
| Scene | Kernel | Dell Precision 7865 (AMD 5995WX, RTX A6000) | Lenovo ThinkStation P620 (AMD 5995WX, RTX A6000) | SuperMicro AS-5014A-TT (AMD 3995WX, RTX A6000) | StorageReview Test Rig (Core i9-12900K, RTX A6000) |
| Interior | Info channels | 18.39 | 18.43 | 11.05 | 18.53 |
| Interior | Direct lighting | 66.64 | 66.55 | 37.33 | 67.25 |
| Interior | Path tracing | 86.40 | 86.27 | 46.73 | 87.28 |
| Idea | Info channels | 11.33 | 11.46 | 6.62 | 11.52 |
| Idea | Direct lighting | 52.14 | 52.28 | 28.55 | 52.74 |
| Idea | Path tracing | 64.19 | 64.46 | 35.11 | 65.34 |
| ATV | Info channels | 28.75 | 28.81 | 16.48 | 29.15 |
| ATV | Direct lighting | 74.09 | 73.97 | 40.28 | 74.84 |
| ATV | Path tracing | 93.20 | 93.07 | 50.44 | 94.82 |
| Box | Info channels | 15.60 | 15.55 | 9.26 | 15.90 |
| Box | Direct lighting | 66.25 | 66.32 | 36.13 | 66.80 |
| Box | Path tracing | 75.01 | 75.11 | 40.66 | 75.93 |
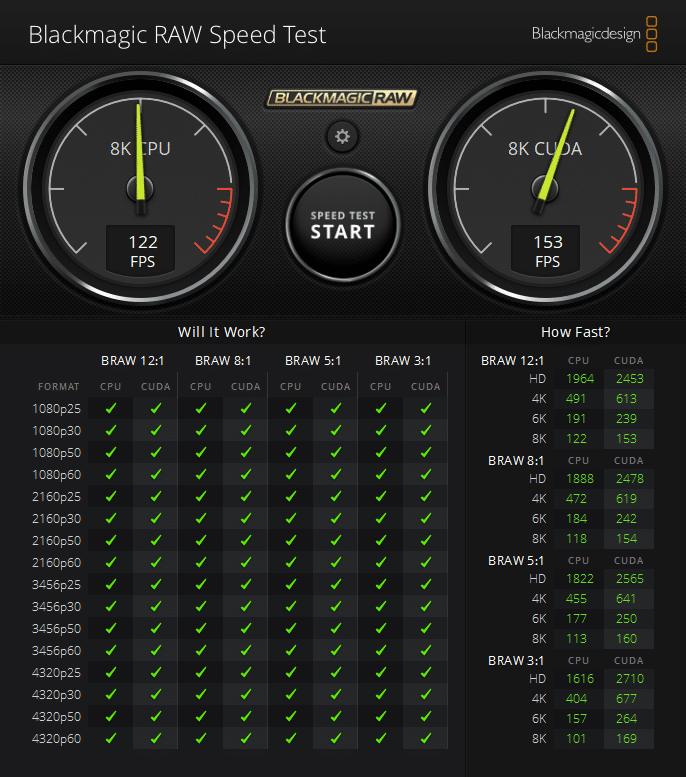
Blackmagic RAW Speed Test
We have also started running Blackmagic’s RAW speed test, which tests video playback. We only have results for the Precision 7865, which achieved 122fps in 8K CPU and 153fps in 8K CUDA.
7-Zip Compression
We have also started running 7-Zip’s built-in memory benchmark. This test responds well to faster memory with lower latencies. The results below only include the Precision 7865.
| 7-Zip Compression Benchmark | |
| Dell Precision 7865 (AMD 5995WX, RTX A6000) | |
| Current CPU Usage | 3302% |
| Current Rating/Usage | 6.913 GIPS |
| Current Rating | 228.231 GIPS |
| Resulting CPU Usage | 3293% |
| Resulting Rating/Usage | 6.973 GIPS |
| Resulting Rating | 229.630 GIPS |
| Decompressing | |
| Current CPU Usage | 6181% |
| Current Rating/Usage | 5.265 GIPS |
| Current Rating | 325.422 GIPS |
| Resulting CPU Usage | 6188% |
| Resulting Rating/Usage | 5.265 GIPS |
| Resulting Rating | 325.813 GIPS |
| Total Rating | |
| Total CPU Usage | 4740% |
| Total Rating/Usage | 6.119 GIPS |
| Total Rating | 277.721 GIPS |
Conclusion
Dell’s Precision 7865 embodies what we look for in a high-end enterprise workstation. With 64 CPU cores on a single chip, it can be more economical than a dual-CPU Intel workstation. (And, of course, managing one CPU is easier than two.)
The Precision 7865 was competitive in our enterprise benchmark suite against other 64-core Threadripper Pro towers. We’re also impressed by its quiet and effective cooling system. Dell has the most robust zone/fan control within the BIOS that we’ve seen in this entire category. And even when moving off the stock low-noise setting, we didn’t see a dramatic performance differential.
Other highlights for this full tower include externally-accessible drive bays, a high memory ceiling, good port selection, business-grade aftersales support, ISV certifications, and the versatility to be used upright, on its side, or in a rack. Overall, the Precision 7865 gets our recommendation and is a Best of 2023 selection as an excellent enterprise-class workstation for demanding applications.
Engage with StorageReview
Newsletter | YouTube | Podcast iTunes/Spotify | Instagram | Twitter | TikTok | RSS Feed

