We've been working with the all-flash performance EMC VxRack Nodes for some time now, previously looking at the system configured in two-layer in our SQL Server, MySQL and VMmark application benchmarks. In this last segment of two-layer testing before turning to HCI, we put the storage to work in HCIbench to gather synthetic performance numbers.
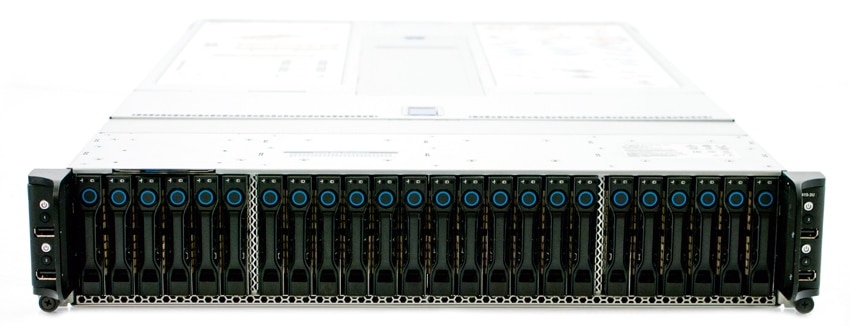
VCE VxRack Node (Performance Compute All Flash PF100) Specifications
- Chassis – # of Node: 2U-4 node
- Processors Per Node: Dual Intel E5-2680 V3, 12c, 2.5GHz
- Chipset: Intel 610
- DDR4 Memory Per Node: 512GB (16 x 32GB)
- Embedded NIC Per Node: Dual 1-Gbps Ethernet ports + 1 10/100 management port
- RAID Controller Per Node: 1x LSI 3008
- SSDs Per Node: 4.8TB (6x 2.5-inch 800GB eMLC)
- SATADOM Per Node: 32GB SLC
- 10GbE Port Per Node: 4x 10Gbps ports SFP+
- Power Supply: Dual 1600W platinum PSU AC
- Router: Cisco Nexus C3164Q-40GE
Dell PowerEdge LoadGen Specifications
- Dell PowerEdge R730 Servers (x4)
- CPUs: Eight Intel Xeon E5-2690 v3 2.6GHz (12C/28T)
- Memory: 64x 16GB DDR4 RDIMM
- Networking: 4x Emulex dual-port 10G NIC
HCIbench Test Configuration
- 16 VMs
- 10 VMDK per VM
- 40GB VMDK (6.4TB footprint)
- Full-write storage initialization
- 1.5 hour test intervals (30 minute preconditioning, 60 minute test sample period)
For testing the two-layer ScaleIO storage cluster we deployed one heavy-weight configuration for our workload profiles. This consisted of a 6.4TB data footprint out of 8TB usable.
StorageReview's HCIbench Workload Profiles
- 4K Random 100% read
- 4K Random 100% write
- 8K Random 70% read / 30% write
- 32K Sequential 100% read
- 32K Sequential 100% write
HCIbench Performance
It should be noted out of the gate that the testing here isn't designed to show peak capabilities of the VxRack Node. What we've done is test using four Dell R730 loadgen systems with the primary aim to give us something similar to compare to as we transition to HCI testing. In the case of two-layer, the nodes have four external compute servers accessing the storage that while not apples to apples, gives a good representation as to how the storage will perform in two-layer versus HCI.
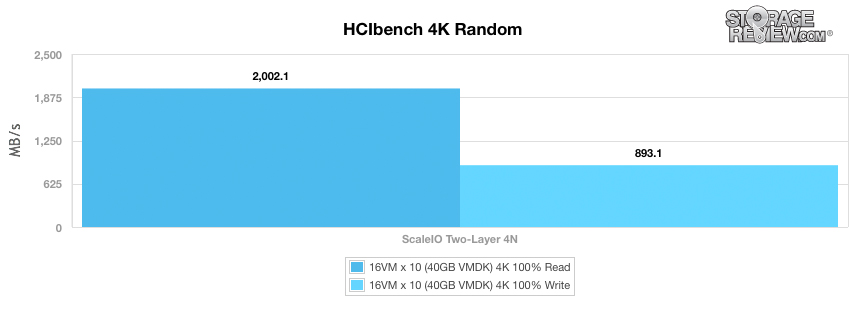
In our first test measuring 4K random transfers, we measured an average bandwidth of 2GB/s read and 893MB/s write.
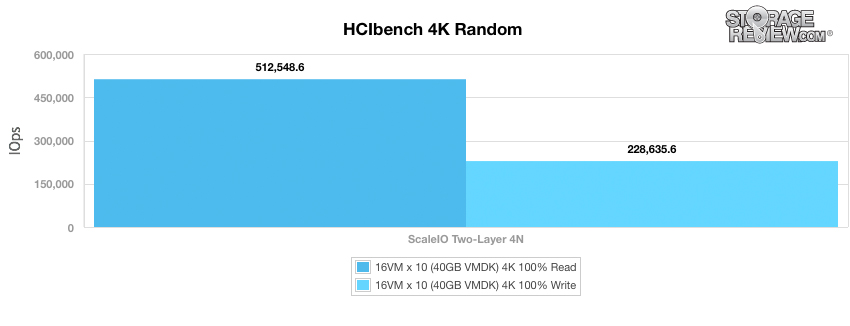
With our HCIbench load across 4 hosts with 4VMs each, we measured an average throughput of 512.5k IOPS read and 228.6k IOPS write in our 4K random workload.
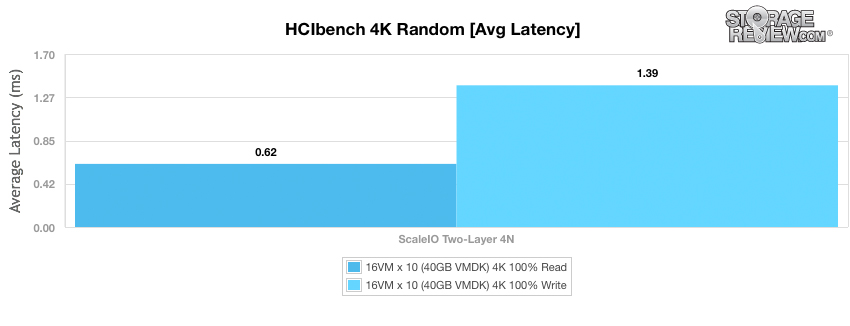
Average latency in our 4K random transfer test measured 0.62ms read and 1.39ms write.
Changing the focus to a mixed read/write workload, we turned to an 8K random transfer test with a mix of 70% read and 30% write. In this test we saw bandwidth measured 2.7GB/s.
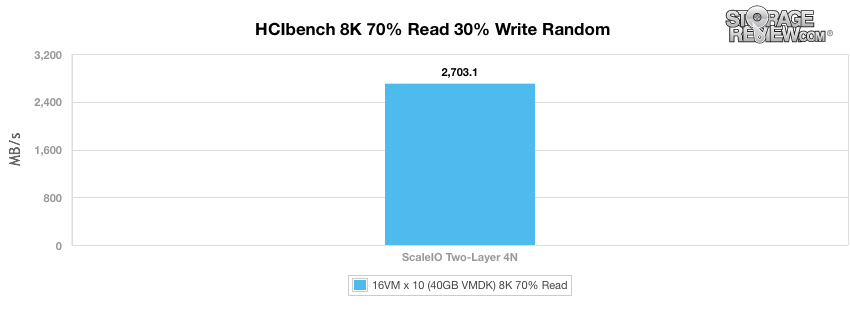
Throughput in our 8K 70/30 HCIbench test was strong, measuring 346k IOPS.
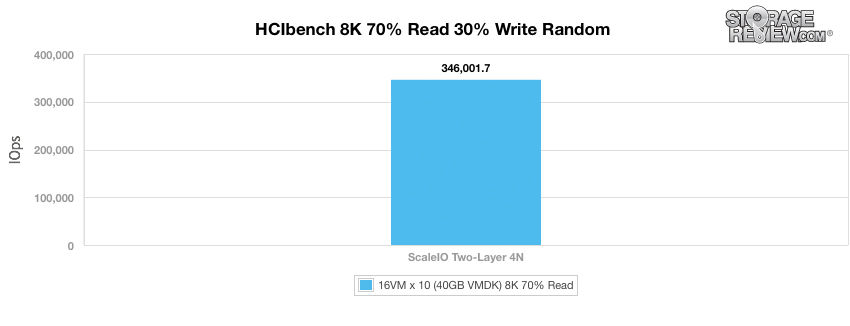
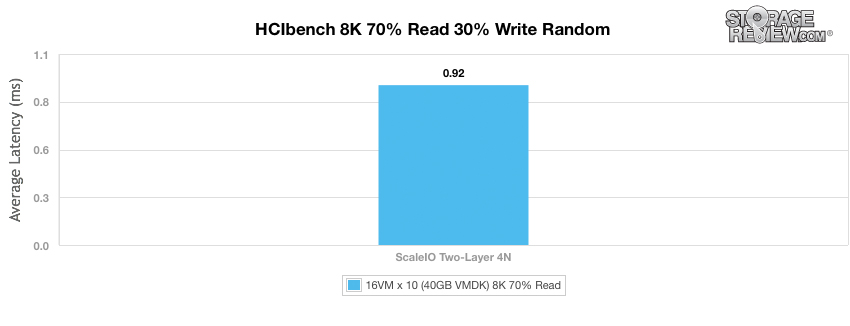
Our ScaleIO two-layer configuration offered an average latency of 0.92ms in our 8k 70/30 workload, while pushing 2.7GB/s and 346k IOPS.
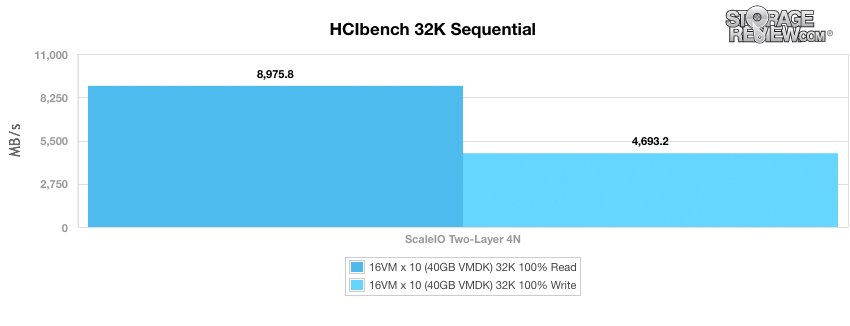
Users looking for strong large-block transfer speeds from the ScaleIO all-flash platform won't be disappointed. With a 32K block-size we measured sequential read bandwidth of nearly 9GB/s and a write bandwidth of 4.7GB/s.
Large-block 32K sequential throughput from our 4-node two-layer ScaleIO platform was also very strong, measured in excess of 287K IOPS read and 150k IOPS write.
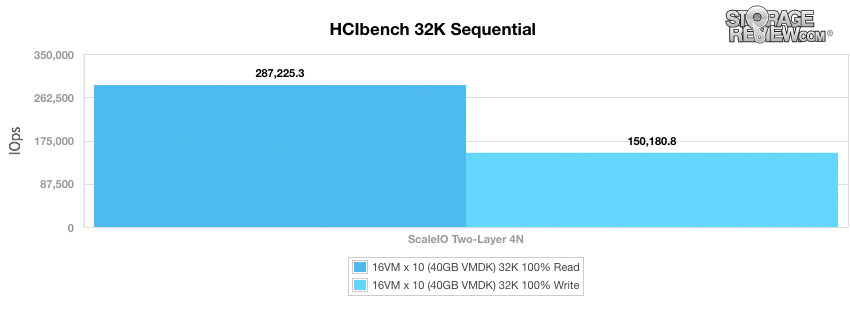
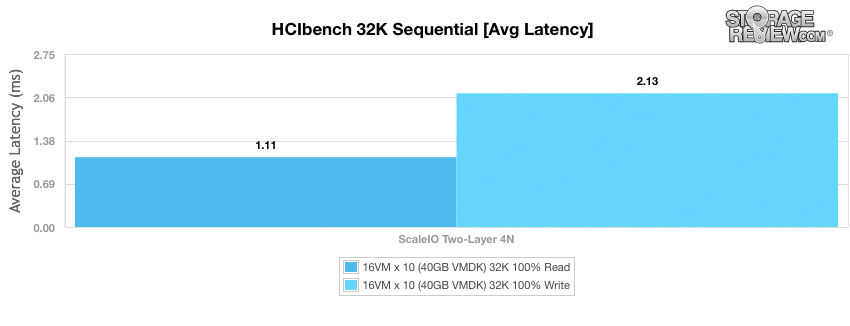
We measured an impressive 1.11ms read and 2.13ms write latency during our large-block sequential workload while pushing bandwidth nearing 9GB/s and 4.7GB/s write.
Conclusion
The EMC VxRack Node continues on its path of being high-performance storage array to be reckoned with. In our final two-layer test we ran the VxRack Node through HCIbench in order to look at synthetic performance across small-block random transfers up to large-block sequential workloads. We measured peak I/O throughput in our 4K test at 512k IOPS read, whereas 8K random transfers with a 70/30 R/W mix measured 346k IOPS. Bandwidth in this scenario was also very strong, with 32K sequential transfers measuring nearly 9GB/s read and 4.7GB/s write. While these figures are nothing to complain about the ScaleIO VxRack Node hardware is actually capable of reaching higher synthetic numbers with other benchmarking tools such as FIO in block-level testing. So while not perfect, these figures do form a baseline to easily compare the ScaleIO VxRack HCI nodes against in our upcoming reviews.
EMC VxRack Node Review: Overview
EMC VxRack Node Powered By ScaleIO: Scaled Sysbench OLTP Performance Review (2-layer)
EMC VxRack Node Powered By ScaleIO: SQL Server Performance Review (2-layer)
EMC VxRack Node Powered By ScaleIO Review: Synthetic Performance Review (HCI)
EMC VxRack Node Powered By ScaleIO: SQL Server Performance Review (HCI)
EMC VxRack Node Powered By ScaleIO: VMmark Performance Review (HCI)


 Amazon