The MiTAC TYAN HG68-B8016 stands out as a highly flexible platform ideally suited for cloud providers offering tailored server configurations.
The MiTAC TYAN HG68-B8016 is a versatile 6U five-node server platform engineered for service providers. It supports AMD EPYC 4004 series processors, offering a purpose-built blend of performance, energy efficiency, and cost-effectiveness. Each node accommodates up to 192GB of DDR5 memory, twin M.2 SSD slots, and includes PCIe Gen5 and Gen4 expansion for scalability.
The modular design of the MiTAC servers allows cloud providers to efficiently allocate dedicated resources to their customers. Each node operates independently, allowing providers to offer custom configurations tailored to specific customer requirements—from compute-intensive applications to storage-heavy workloads. This isolation translates to easier management, as individual nodes can be tailored, serviced, or rebooted without risking disruptions to neighboring systems. The simplified design also helps keep platform costs under control.
Technical Specifications
The HG68-B8016 is engineered to accommodate a single AMD AM5 processor, supporting up to 192GB of UDIMM/DDR5 ECC UDIMM or non-ECC 4800 memory. This configuration delivers an extensive array of features alongside exceptional performance.
| Form Factor | 6U Rackmount |
| Storage Enclosure (per Blade) | Connector (M.2) – (2) 2280 (by PCIe.4 interface) |
| Processor (per Blade) | Q’ty / Socket Type: (1) AMD Socket AM5 Supported CPU Series: (1) AMD EPYC 4004 Processor |
| Memory (per Blade) | Supported DIMM: Qty (4) DIMM slots DIMM Type / Speed: DDR5 ECC UDIMM & non-ECC 4800 Capacity: Up to 192GB UDIMM |
| Expansion Slots (per Blade) | (1) PCIe Gen.4 x4 slot / (1) PCIe Gen.4 x8 slot (w/ x4 link) / (1) PCIe Gen.5 x16 slot |
| Network Ports (per Blade) | (2) GbE ports |
| I/O Ports (per Blade) | USB: (4) USB3.2 Gen.1 ports VGA: (2) Display ports / (1) D-Sub 15-pin port RJ-45: (2) GbE ports Audio: (1) Line in / Line out / MIC |
The AMD EPYC 4004 series processors deliver outstanding performance and energy efficiency, enabling cloud providers to handle more concurrent users and complex workloads. With support for up to 192GB of DDR5 memory per node, the HG68-B8016 offers fast data access and processing capabilities. The platform’s flexible storage and expansion options allow customization to meet specific application needs and ensure optimal performance for diverse cloud services.
MiTAC TYAN HG68-B8016 Design and Build
The TYAN HG68-B8016 is a 6U rackmount chassis measuring 26.85 inches x 17.60 inches x 10.44 inches (682mm x 447mm x 265.3mm) and is designed to integrate easily into standard server racks. Its sturdy construction ensures durability while optimizing airflow, essential for maintaining stable operation in data centers. The 6U form factor enables a high-density configuration.
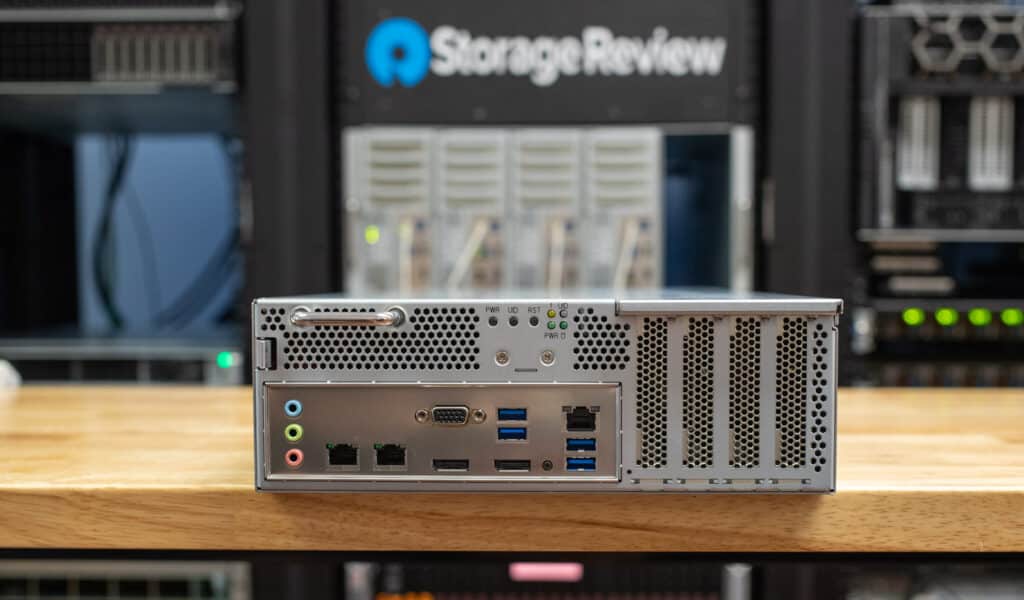
The front panel of each node features two RJ45 Gigabit LAN ports (LAN1 and LAN2) supporting 1 Gbps speeds. These ports offer flexible setups, allowing redundancy to ensure continuous network availability or traffic separation for management and data. Additionally, a D-Sub VGA port linked to the Baseboard Management Controller (BMC) allows administrators to access the system’s interface remotely.
Other connectivity options include four USB 3.2 Gen 1 Type-A ports, which facilitate peripherals and external storage devices, and two DisplayPort 1.2 outputs connected directly to the CPU for high-resolution video output. The front panel also has audio jacks for analog input/output, which are valuable for monitoring tasks requiring sound. For remote management, an IPMI LAN port offers dedicated access via the Intelligent Platform Management Interface and allows for complete system monitoring and control without needing to be physically present. Lastly, the ID button lets administrators quickly identify the node in large server racks.
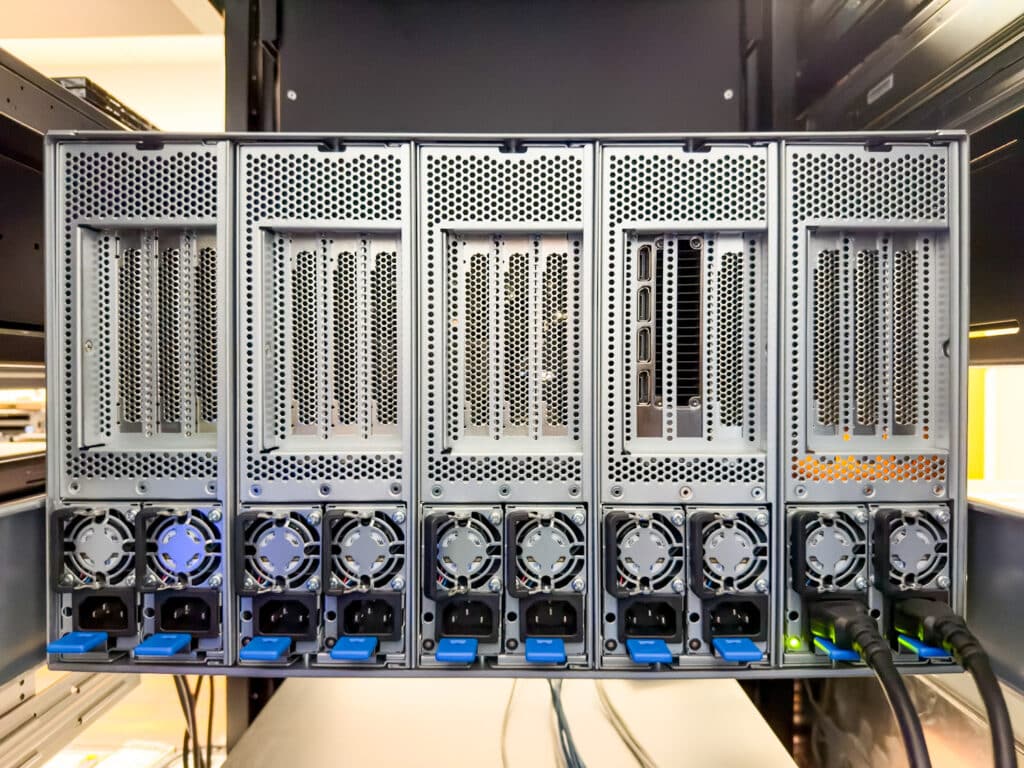
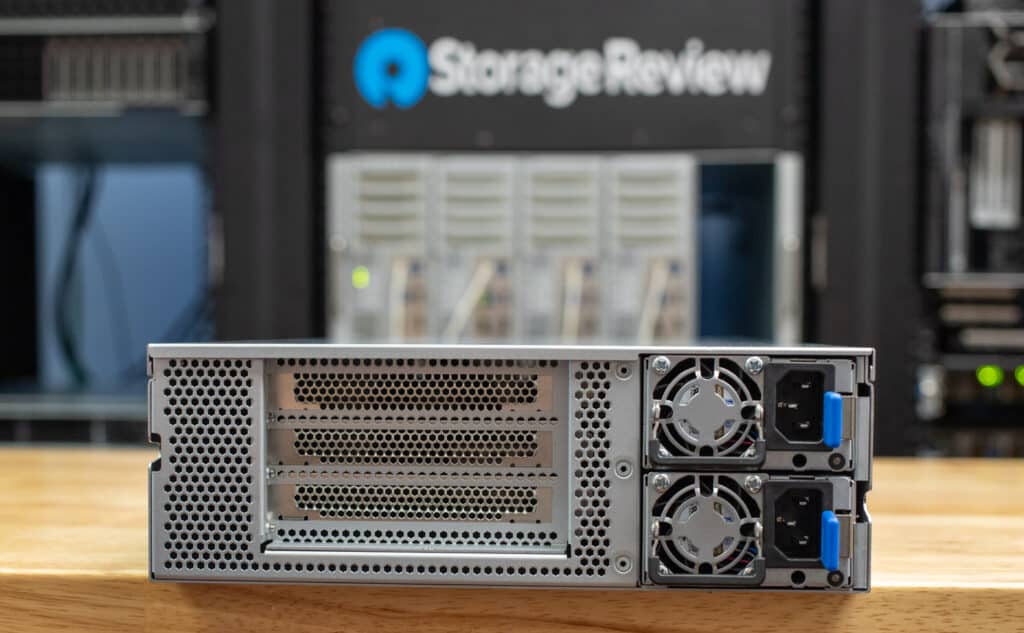
The rear panel gives users access to a series of PCIe slots and allows them to install extra components like network cards, GPUs, or storage interfaces. This allows for plenty of customization depending on what the system needs to do. Two redundant power supply units (PSU0 and PSU1) are also positioned on the back, which means that even if one fails, the other can keep things running without interruption, minimizing downtime.
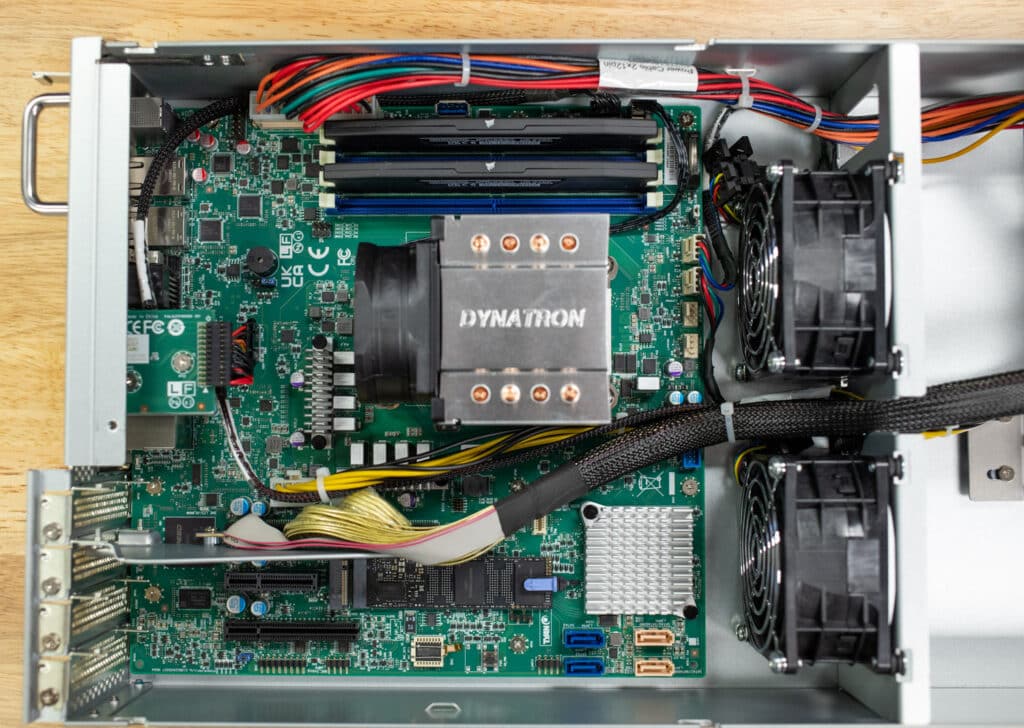
Under the hood, the MiTAC S8016 Serverboard forms the node’s core. The two 80x38mm fans manage cooling and ensure consistent airflow across the CPU and memory modules to prevent overheating. A power distribution and backplane board manages and stabilizes power delivery across all components.
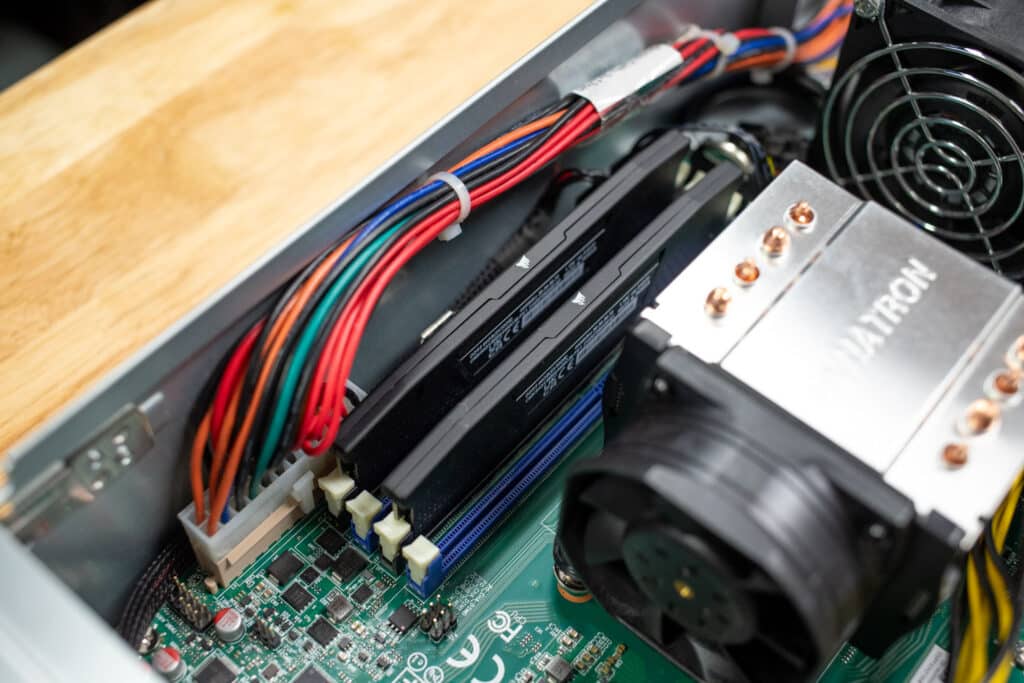
The RAM DIMMs are neatly positioned alongside the AMD CPU socket, allowing easy access and optimal airflow. They’re placed right next to the CPU slot, cooled by a dedicated fan mounted on the heatsink, ensuring the processor stays at an optimal temperature.
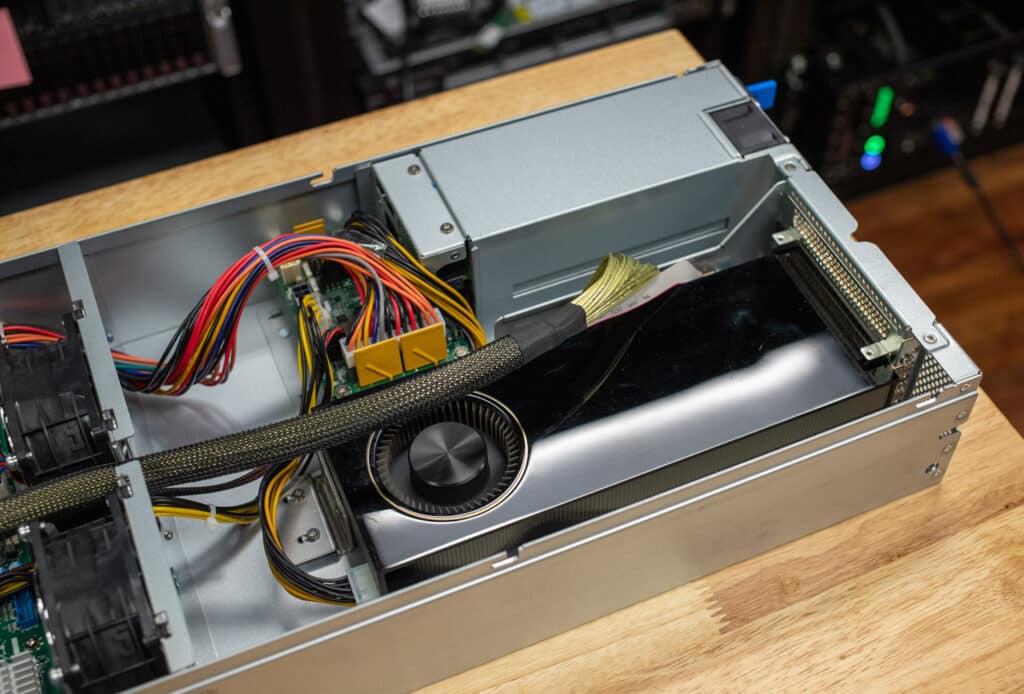
The system’s power is supplied by a 1+1 redundant 80 Plus Titanium-rated PSU (located in the back corner) next to the GPU card slots. These make it viable for compute-intensive tasks such as rendering, AI processing, or scientific computing.
Overall, the TYAN HG68-B8016’s build quality is excellent for its intended use case. The chassis is well-engineered and everything feels durable and built for the long haul in cloud environments. Another thing that stands out is that the server nodes are cold aisle serviceable, meaning all maintenance can be done from the front side.
MiTAC TYAN HG68-B8016 Performance
To test the MiTAC TYAN HG68-B8016 system’s capabilities, we used the following base specifications:
- Motherboard: TYAN S8016AGM2NR
- Operating System: Windows 10 64-bit
- Storage: Predator SSD GM7 M.2 1TB
- Resolution: 1024 x 768 px
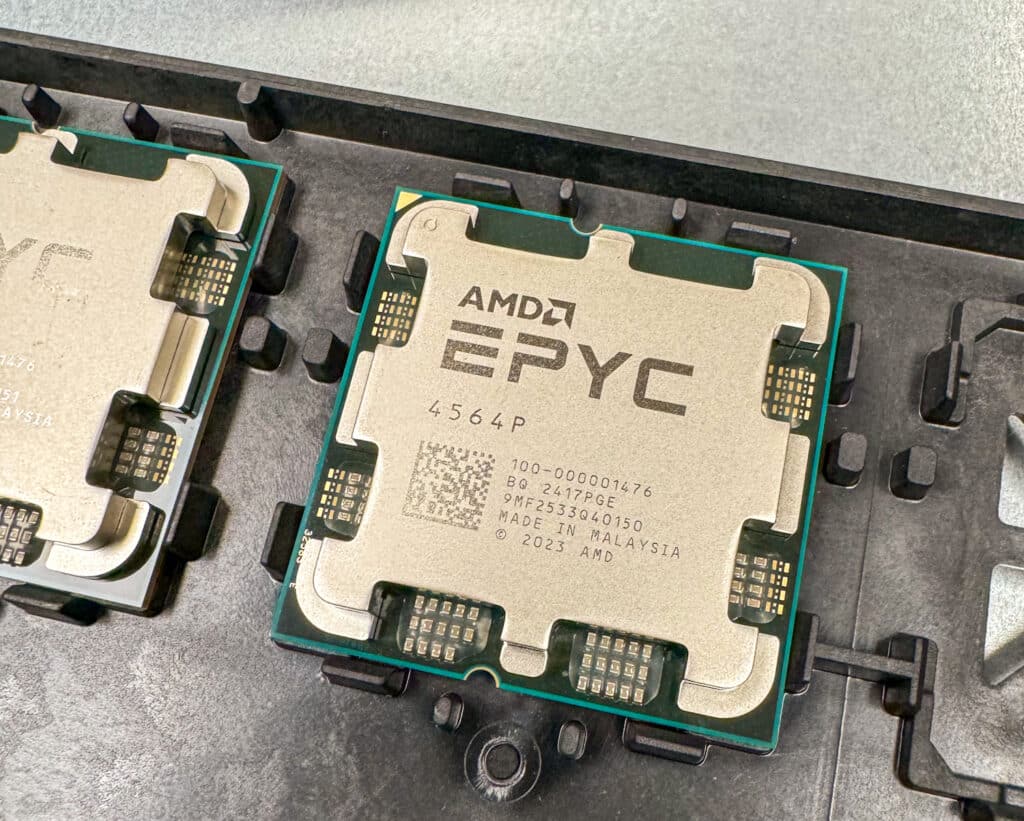
We tested all five MiTAC server nodes using two AMD EPYC processors from the 4000 series—the EPYC 4564P and EPYC 4364P models—paired with various RAM configurations. Each node was remotely accessed through both BMC and RDP interfaces. This setup allowed for efficient hardware-level management via BMC, while RDP enabled benchmark operation and performance data collection for each configuration.
| Specification | AMD EPYC 4564P | AMD EPYC 4364P |
| Cores/Threads | 16 cores / 32 threads | 8 cores / 16 threads |
| Base Clock | 4.5 GHz | 4.5 GHz |
| Max Boost Clock | Up to 5.7 GHz | Up to 5.4 GHz |
| L3 Cache | 64 MB | 32 MB |
| TDP (Thermal Design Power) | 170W | 105W |
Our performance results will allow us to examine how each CPU performs under the same conditions and focus on the CPUs’ impact on performance in various real-world scenarios, ranging from AI inference tasks to video rendering and data compression. We also incorporated an NVIDIA A6000 GPU into one node to show graphics performance under certain workloads.
Blender OptiX
First is the Blender benchmark, which evaluates performance using an open-source 3D modeling and rendering application. The benchmark measures the number of samples processed per minute, with higher scores indicating better performance. Samples are per minute, and higher is better.
In the Blender results, there’s a clear distinction between the performance of the two classes of CPUs we’re testing. The AMD EPYC 4564P-equipped nodes (Nodes 1-3) consistently show higher samples per minute across all tested scenes and benchmark versions. For instance, in the “Monster” scene of Blender OptiX 4.0, these nodes achieve around 230 samples per minute. In contrast, the AMD EPYC 4364P-equipped nodes (Nodes 4-5) register approximately 120 samples per minute in the same test.
| Category | Node 1 (AMD EPYC 4564P, 32GB RAM, 5200MHz) | Node 2 (AMD EPYC 4564P, 32GB RAM, 4800MHz) | Node 2 (NVIDIA A6000 GPU, 32GB RAM, 4800MHz) | Node 3 (AMD EPYC 4564P, 32GB RAM, 4800MHz) | Node 4 (AMD EPYC 4364P, 32GB RAM, 4800MHz) | Node 5 (AMD EPYC 4364P, 64GB RAM, 4000MHz) |
| Blender OptiX 4.2 | ||||||
| Monster | 223.567 | 221.099 | 2381.519 | 221.513 | 115.871 | 115.472 |
| Junkshop | 158.780 | 158.608 | 1461.651 | 158.816 | 81.232 | 81.585 |
| Classroom | 111.575 | 110.718 | 1315.029 | 110.622 | 57.971 | 58.181 |
Blackmagic RAW Speed Test
We have also started running Blackmagic’s RAW speed test, which evaluates CPU performance in high-resolution video playback (a critical metric for media-intensive applications like 8K video processing). In this test, the AMD EPYC 4564P nodes (1-3) show strong performance, consistently delivering around 91-92 FPS in 8K CPU tests. In contrast, the AMD EPYC 4364P nodes (4-5) achieve 57-58 FPS, a significant performance drop.
For cloud providers offering high-resolution video playback or cloud gaming services, this difference highlights the 4564P’s ability to manage demanding video workloads more effectively, ensuring smoother playback at higher resolutions like 8K. The 4364P, while still capable, is more suited to scenarios where video playback performance is less critical, or resolutions are lower, making it a more cost-efficient option for lighter workloads.
| Blackmagic RAW Speed Test (Higher is better) | Node 1 (AMD EPYC 4564P, 32GB RAM, 5200MHz) | Node 2 (AMD EPYC 4564P, NVIDIA A6000 32GB RAM, 4800MHz) | Node 3 (AMD EPYC 4564P, 32GB RAM, 4800MHz) | Node 4 (AMD EPYC 4364P, 32GB RAM, 4800MHz) | Node 5 (AMD EPYC 4364P, 64GB RAM, 4000MHz) |
| 8K CPU | 92 FPS | 91 FPS | 92 FPS | 57 FPS | 58 FPS |
| 8K CUDA | N/A | 169 | N/A | N/A | N/A |
7-Zip Compression
The 7-Zip benchmark measures how well the CPUs handle data compression and decompression tasks, which is critical for cloud environments where large amounts of data must be compressed and transferred efficiently. This benchmark benefits from higher core counts and better memory management, making it a valuable test for comparing the processing power of different CPUs.
In the results, the EPYC 4564P nodes (1-3) significantly outperform the EPYC 4364P nodes (4-5). For instance, Node 1 delivers a total compression rating of 134.461 GIPS, while Node 4 achieves 86.640 GIPS. Similarly, in decompression, the EPYC 4564P maintains a strong lead with 218.800 GIPS, compared to 123.568 GIPS for the EPYC 4364P. This substantial gap highlights that the 4564P processors are much better suited for workloads requiring fast data compression and decompression, such as cloud storage or backup solutions. While the 4364P still performs decently, it is better suited for less intensive workloads where peak performance isn’t as critical.
| 7-Zip Compression Benchmark (Higher is better) | Node 1 (4564P, 32GB RAM, 5200MHz) | Node 2 (4564P, 32GB RAM, 4800MHz) | Node 3 (4564P, 32GB RAM, 4800MHz) | Node 4 (4364P, 32GB RAM, 4800MHz) | Node 5 (4364P, 64GB RAM, 4000MHz) |
| Compressing | |||||
| Current CPU Usage | 2584% | 2569% | 2583% | 1287% | 1285% |
| Current Rating/Usage | 5.203 GIPS | 5.135 GIPS | 5.062 GIPS | 6.730 GIPS | 6.608 GIPS |
| Current Rating | 134.461 GIPS | 131.947 GIPS | 130.764 GIPS | 86.640 GIPS | 87.502 GIPS |
| Resulting CPU Usage | 2579% | 2573% | 2581% | 1299% | 1298% |
| Resulting Rating/Usage | 5.167 GIPS | 5.066 GIPS | 5.041 GIPS | 6.656 GIPS | 6.743 GIPS |
| Resulting Rating | 133.242 GIPS | 130.375 GIPS | 130.086 GIPS | 86.460 GIPS | 87.495 GIPS |
| Decompressing | |||||
| Current CPU Usage | 3020% | 3008% | 3043% | 1596% | 1587% |
| Current Rating/Usage | 7.245 GIPS | 7.156 GIPS | 7.167 GIPS | 7.741 GIPS | 7.761 GIPS |
| Current Rating | 218.800 GIPS | 218.237 GIPS | 218.102 GIPS | 123.568 GIPS | 123.167 GIPS |
| Resulting CPU Usage | 3055% | 3040% | 3056% | 1581% | 1582% |
| Resulting Rating/Usage | 7.249 GIPS | 7.122 GIPS | 7.178 GIPS | 7.717 GIPS | 7.714 GIPS |
| Resulting Rating | 221.470 GIPS | 216.479 GIPS | 219.328 GIPS | 122.025 GIPS | 122.058 GIPS |
| Total Rating | |||||
| Total CPU Usage | 2817% | 2806% | 2818% | 1440% | 1440% |
| Total Rating/Usage | 6.208 GIPS | 6.094 GIPS | 6.109 GIPS | 7.186 GIPS | 7.229 GIPS |
| Total Rating | 177.356 GIPS | 173.427 GIPS | 174.707 GIPS | 104.243 GIPS | 104.777 GIPS |
UL Procyon AI Inference
The UL Procyon AI Inference benchmark evaluates how quickly CPUs can process AI model inferences, which is crucial for tasks like machine learning, real-time data analysis, and AI-driven services. Lower inference times indicate better performance, meaning the processor can handle more AI-related functions in less time.
Here, the AMD EPYC 4564P (Nodes 1-3) again delivers faster inference times compared to the EPYC 4364P (Nodes 4-5), especially in models like YOLO V3, where Node 1 records 61.66ms versus Node 4’s 107.12ms. This trend holds across other models, such as ResNet 50 and Inception V4, showing the EPYC 4564P’s ability to handle complex AI tasks more efficiently. This makes it ideal for cloud providers focusing on AI workloads, where faster model inference can improve real-time analytics, recommendations, and decision-making systems. The EPYC 4364P still offers respectable performance for its entry-level class but is better suited for lighter AI tasks or scenarios where cost savings are prioritized over speed.
| UL Procyon Average Inference Times (Lower is better) | Node 1 (AMD EPYC 4564P, 32GB RAM, 5200MHz) | Node 2 (AMD EPYC 4564P, 32GB RAM, 4800MHz) | Node 3 (AMD EPYC 4564P, 32GB RAM, 4800MHz) | Node 4 (AMD EPYC 4364P, 32GB RAM, 4800MHz) | Node 5 (AMD EPYC 4364P, 64GB RAM, 4000MHz) |
| MobileNet V3 | 1.20ms | 1.18ms | 1.18ms | 0.95ms | 0.91ms |
| ResNet 50 | 8.57ms | 8.62ms | 8.72ms | 13.34ms | 13.14ms |
| Inception V4 | 26.55ms | 26.51ms | 26.94 | 40.46ms | 39.37ms |
| DeepLab V3 | 28.97ms | 28.88ms | 29.25ms | 39.35ms | 38.55ms |
| YOLO V3 | 61.66ms | 61.11ms | 62.28ms | 107.12ms | 104.87ms |
| Real-ESRGAN | 3,217.42ms | 3,240.89ms | 3,244.35ms | 4,846.26ms | 4,751.87ms |
| Overall Score | 146 | 147 | 145 | 106 | 109 |
y-cruncher
The y-cruncher benchmark tests how efficiently CPUs can calculate large numbers of Pi digits, which is a great stress test for multi-core, multi-threaded processing. This makes it particularly useful for measuring computational workloads typical in scientific and cloud computing environments, where handling large datasets or complex calculations is critical. Since its launch in 2009, it has become a popular benchmarking application for overclockers and hardware enthusiasts.
In this benchmark, the AMD EPYC 4564P nodes (1-3) demonstrate significantly faster computation times than the EPYC 4364P nodes (4-5). For instance, when calculating 1 billion digits, Node 1 completes the task in 18.7 seconds, while Node 4 takes 24.95 seconds. This performance gap widens as the digit count increases, with the EPYC 4364P taking considerably longer to compute 5 billion digits. This highlights the EPYC 4564P’s superior efficiency for high-demand, compute-intensive tasks, making it ideal for workloads such as scientific simulations, data analysis, or any application that requires robust parallel processing power. Meanwhile, the EPYC 4364P, while slower, still performs well for less intensive computational tasks, offering a more cost-efficient solution for moderate workloads.
| y-cruncher (Total computation time in seconds; lower is better) |
Node 1 (AMD EPYC 4564P, 32GB RAM, 5200MHz) | Node 2 (AMD EPYC 4564P, 32GB RAM, 4800MHz) | Node 3 (AMD EPYC 4564P, 32GB RAM, 4800MHz) | Node 4 (AMD EPYC 4364P, 32GB RAM, 4800MHz) | Node 5 (AMD EPYC 4364P, 64GB RAM, 4000MHz) |
| 1 billion digits | 18.703 seconds | 19.202 seconds | 19.223 seconds | 24.951 seconds | 24.849 seconds |
| 2.5 billion digits | 50.263 seconds | 51.681 seconds | 51.826 seconds | 70.750 seconds | 70.320 seconds |
| 5 billion digits | 109.403 seconds | 112.434 seconds | 112.805 seconds | 156.884 seconds | 155.585 seconds |
| 10 billion digits | N/A | N/A | N/A | N/A | 339.228 seconds |
Geekbench 6
The Geekbench 6 benchmark measures overall system performance across different platforms, emphasizing CPU performance. The benchmark provides separate scores for single-core and multi-core performance, giving a well-rounded view of how a processor performs under various workloads. You can find comparisons to any system you want in the Geekbench Browser.
In the single-core test, the AMD EPYC 4564P (Nodes 1-3) slightly outperforms the EPYC 4364P (Nodes 4-5). For instance, Node 1 scores 3,041, while Node 4 scores 2,978. This relatively close gap suggests that both CPUs perform adequately for tasks relying on single-core performance, such as lighter workloads or particular applications that do not fully utilize multi-threading.
However, in the multi-core test, the gap widens considerably. The EPYC 4564P delivers a score of 17,888 (Node 1), while the EPYC 4364P (Node 4) scores 14,495. This highlights the superior multi-core efficiency of the EPYC 4564P, making it a better fit for more demanding cloud workloads.
| Geekbench 6 (Higher is better) | Node 1 (AMD EPYC 4564P, 32GB RAM, 5200MHz) | Node 2 (AMD EPYC 4564P, 32GB RAM, 4800MHz) | Node 3 (AMD EPYC 4564P, 32GB RAM, 4800MHz) | Node 4 (AMD EPYC 4364P, 32GB RAM, 4800MHz) | Node 5 (AMD EPYC 4364P, 64GB RAM, 4000MHz) |
| CPU Single-Core | 3,041 | 3,029 | 3,019 | 2,978 | 2,977 |
| CPU Multi-Core | 17,888 | 17,442 | 17,469 | 14,495 | 14,429 |
Maxon Cinebench Results
- Cinebench R23: Compared to its R20 predecessor, it has longer test times to assess thermal throttling and includes multi-core and single-core scores for a comprehensive CPU performance evaluation.
- Cinebench 2024 (R24): The latest version features a demanding rendering task and is optimized for modern CPUs and extended loads, offering both multi-core and single-core performance results.
In Cinebench R23, the multi-core performance of the EPYC 4564P (Node 1) reaches 33,896 pts, while the EPYC 4364P (Node 4) falls behind with 18,329 pts. This sizable difference illustrates how much more efficiently the EPYC 4564P model handles workloads that require multi-core performance, such as 3D rendering or high-end video processing.
Similarly, the single-core scores show the EPYC 4564P leading (though the gap is smaller), with Node 1 scoring 1,993 pts compared to Node 4’s 1,970 pts. This suggests that both CPUs perform similarly for single-threaded applications or tasks; however, the EPYC 4564P still has the edge.
The Cinebench 2024 results follow a similar trend, as the EPYC 4564P outperforms in multi-core tasks but maintains closer single-core performance. The EPYC 4564P is better suited for complex rendering tasks in media and content-heavy environments.
| Benchmark | CPU Test | Node 1 (AMD EPYC 4564P, 32GB RAM, 5200MHz) | Node 2 (AMD EPYC 4564P, NVIDIA A6000, 32GB RAM, 4800MHz) | Node 3 (AMD EPYC 4564P, 32GB RAM, 4800MHz) | Node 4 (AMD EPYC 4364P, 32GB RAM, 4800MHz) | Node 5 (AMD EPYC 4364P, 64GB RAM, 4000MHz) |
| Cinebench R23 | Multi-Core | 33,896 pts | 33,569 pts | 33,555 pts | 18,329 pts | 18,528 pts |
| Cinebench R23 | Single-Core | 1,993 pts | 1,990 pts | 1,996 pts | 1,970 pts | 1,975 pts |
| Cinebench 2024 | Multi-Core | 1,889 pts | 1,849 pts | 1,847 pts | 1,035 pts | 1,059 pts |
| Cinebench 2024 | Single-Core | 119 pts | 118 pts | 118 pts | 117 pts | 117 pts |
| Cinebench 2024 | GPU | 17,382 pts |
Video Game Hosting
While many applications of this server platform are likely business-oriented, we couldn’t overlook the fact that the MiTAC TYAN HG68-B8016’s architecture makes it an excellent choice for video game hosting. To put this to the test, we configured one of the nodes as a Rust server for our Discord community.
High single-threaded performance becomes critical for maintaining stable gameplay and low latency when running a dedicated Rust server like the Storage Review Official Monthly. Like many multiplayer online games, Rust relies heavily on server-side calculations to track player movements, interactions, and game world physics. These calculations must be processed quickly to ensure smooth synchronization between players and the server.
While Rust uses multiple CPU cores, many of the game’s most essential processes, such as handling player inputs, combat interactions, and entity physics, still rely significantly on single-threaded performance. In essence, even with modern multi-core CPUs, the speed of individual cores plays a significant role in server-side performance, particularly when managing large player counts or complex in-game activities.
We ran the Storage Review Rust server for an entire wipe cycle, which lasted one month. In Rust, a wipe cycle refers to the complete reset of the server’s map and player progress, typically scheduled to refresh the game world and provide a new start for all players.
For our setup, we chose the AMD EPYC 4564P, a 16-core processor with a base clock of 4.5 GHz. This choice allowed us to achieve consistently high server-side FPS (around 200-250), ensuring responsive gameplay even during peak player activity. The importance of high single-threaded performance becomes especially clear when managing a large map and numerous player interactions in Rust, where any dips in processing speed can lead to desynchronization, lag, or other gameplay issues that would negatively affect the player experience.
Conclusion
The MiTAC TYAN HG68-B8016 stands out as a highly flexible platform ideally suited for cloud providers offering tailored server configurations. Its independent node architecture allows each of the five nodes to be customized according to customer requirements, ensuring maximum flexibility.
The AMD EPYC 4004 CPUs deliver impressive performance and energy efficiency, providing a cost-effective solution for providers to balance compute power with operational expenses. Our testing revealed consistently strong performance across all five nodes, showcasing the platform’s reliability and ability to handle demanding workloads without compromise. For workloads that can benefit from a GPU, this MiTAC platform also has those use cases covered; we tested an A6000 in one node with excellent results. Ad hoc Rust server testing also validated the platform’s ability to handle anything we threw at the servers.
Based on our testing, this flexibility, performance, and efficiency combination makes the HG68-B8016 a compelling choice for service providers seeking to meet diverse customer needs.
Engage with StorageReview
Newsletter | YouTube | Podcast iTunes/Spotify | Instagram | Twitter | TikTok | RSS Feed


