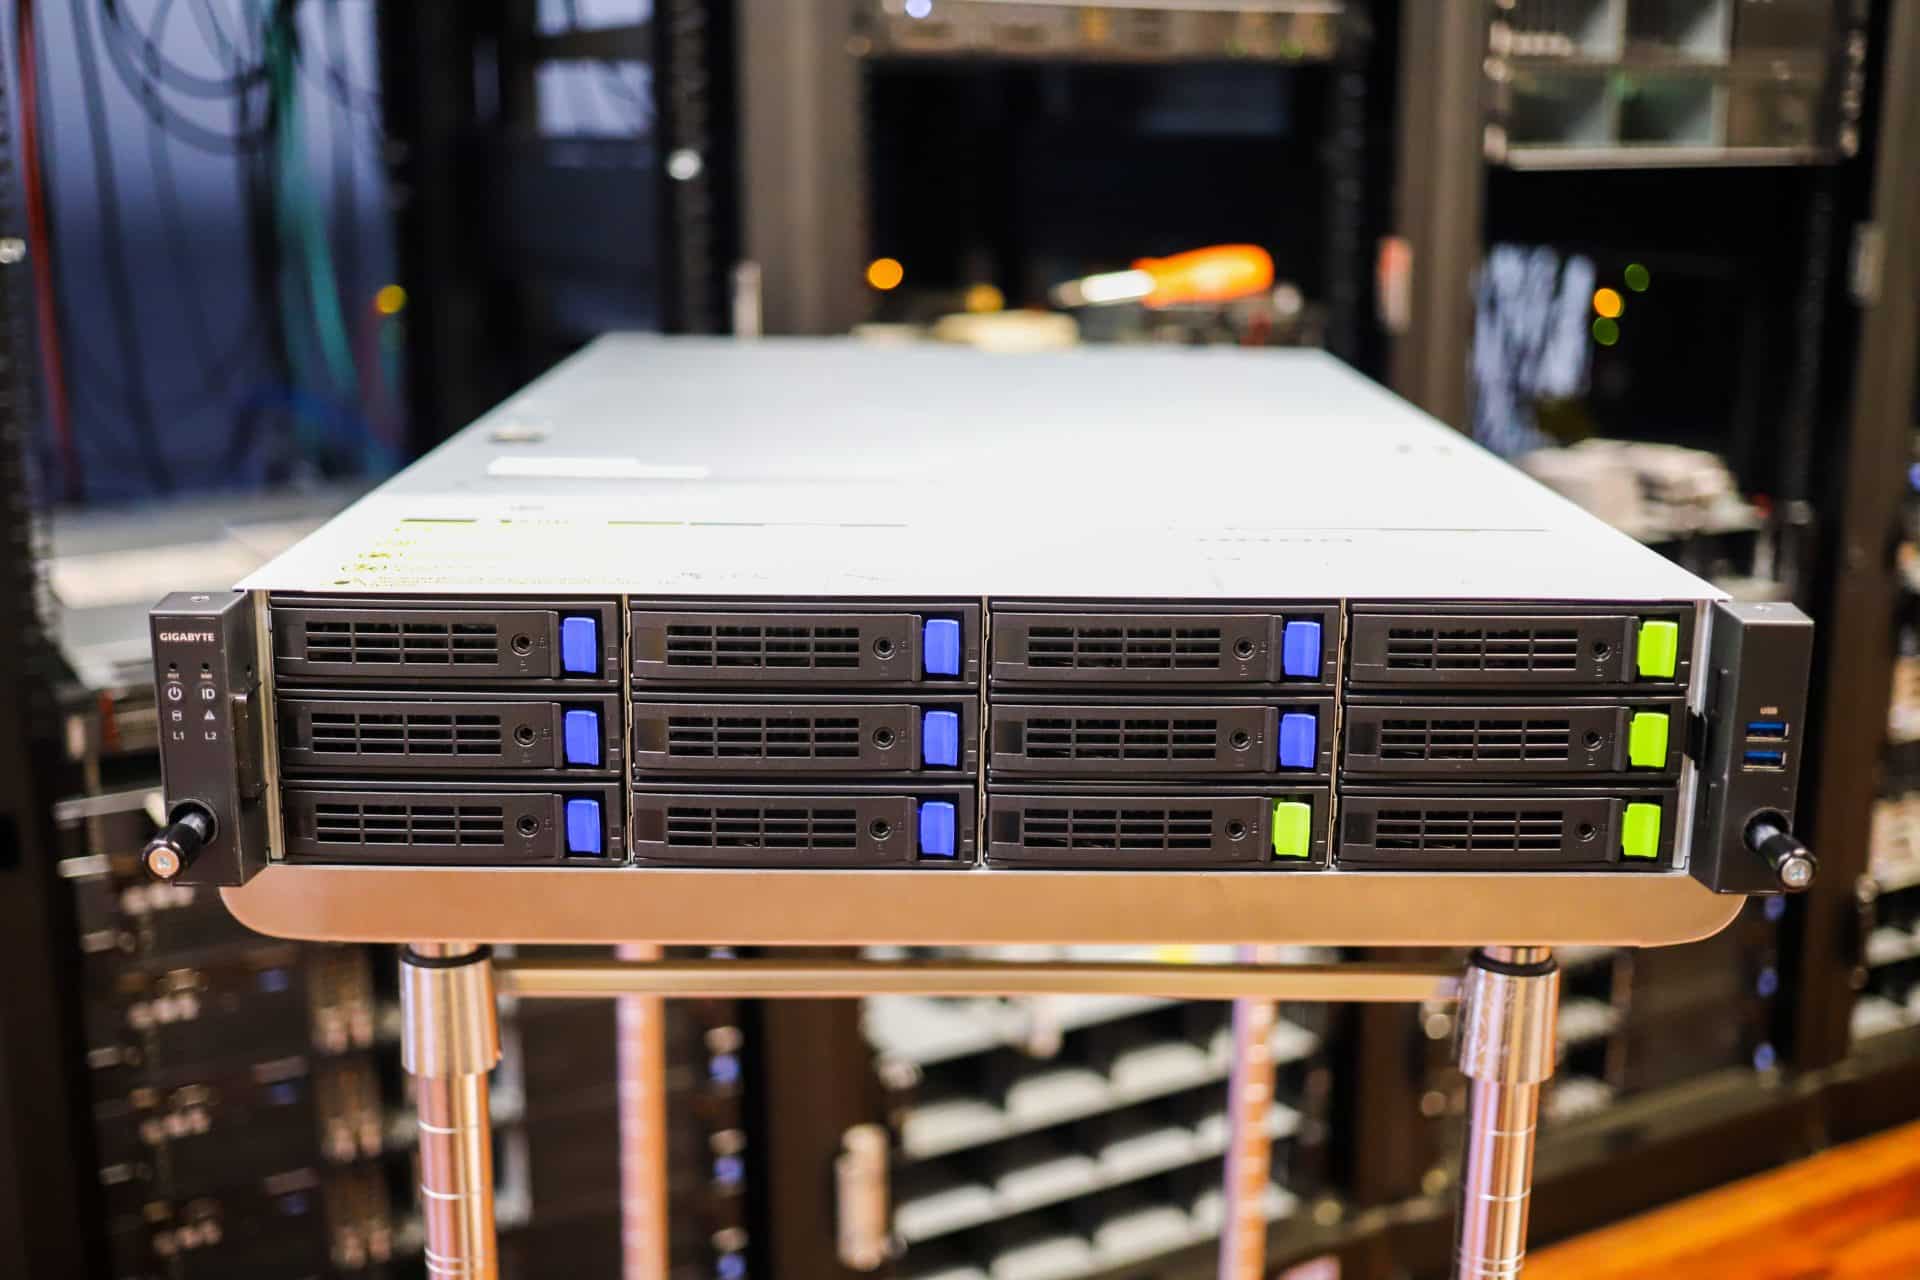
Gigabyte has recently added to their server line-up with the R282-3C0 (rev. 100) – 2U Gen4 NVMe system. This server features dual 3rd Generation Intel® Xeon® Scalable CPUs that launched back in April. The R282-3C0 is intended for high-density storage that supports up to eight 3.5-inch SATA drives, and four 3.5-inch NVMe drives, giving a total of 12 hot-swappable bays.
Gigabyte has recently added to their server line-up with the R282-3C0 (rev. 100) – 2U Gen4 NVMe system. This server features dual 3rd Generation Intel® Xeon® Scalable CPUs that launched back in April. The R282-3C0 is intended for high-density storage that supports up to eight 3.5-inch SATA drives, and four 3.5-inch NVMe drives, giving a total of 12 hot-swappable bays.
Gigabyte R282-3C0 Specifications
The specific model that we are reviewing is the R282-3C0. This model isn’t the highest end of the R282 series, however, the internals still offers good performance potential and flexibility.
| Gigabyte R282-3C0 (rev. 100) | |
| Form Factor | 2U 438mm x 87.5mm x 730mm |
| Motherboard | MR92-FS0 |
| Processors | 3rd Generation Intel® Xeon® Scalable Processors (Intel® Xeon® Platinum Processor, Intel® Xeon® Gold Processor, Intel® Xeon® Silver Processor) |
| Memory | 32 DDR4 DIMM Slots; 8-channel per processor; RDIMM and LRDIMM modules up to 128GB |
| Storage | Front: (8) 3.5″ or 2.5″ SATA/SAS hot-swappable HDD/SSD bays (4) 3.5″ or 2.5″ SATA/SAS/Gen4 NVMe hot-swappable HDD/SSD bays Rear: (2) 2.5″ SATA/SAS hot-swappable HDD/SSD bays in rear side |
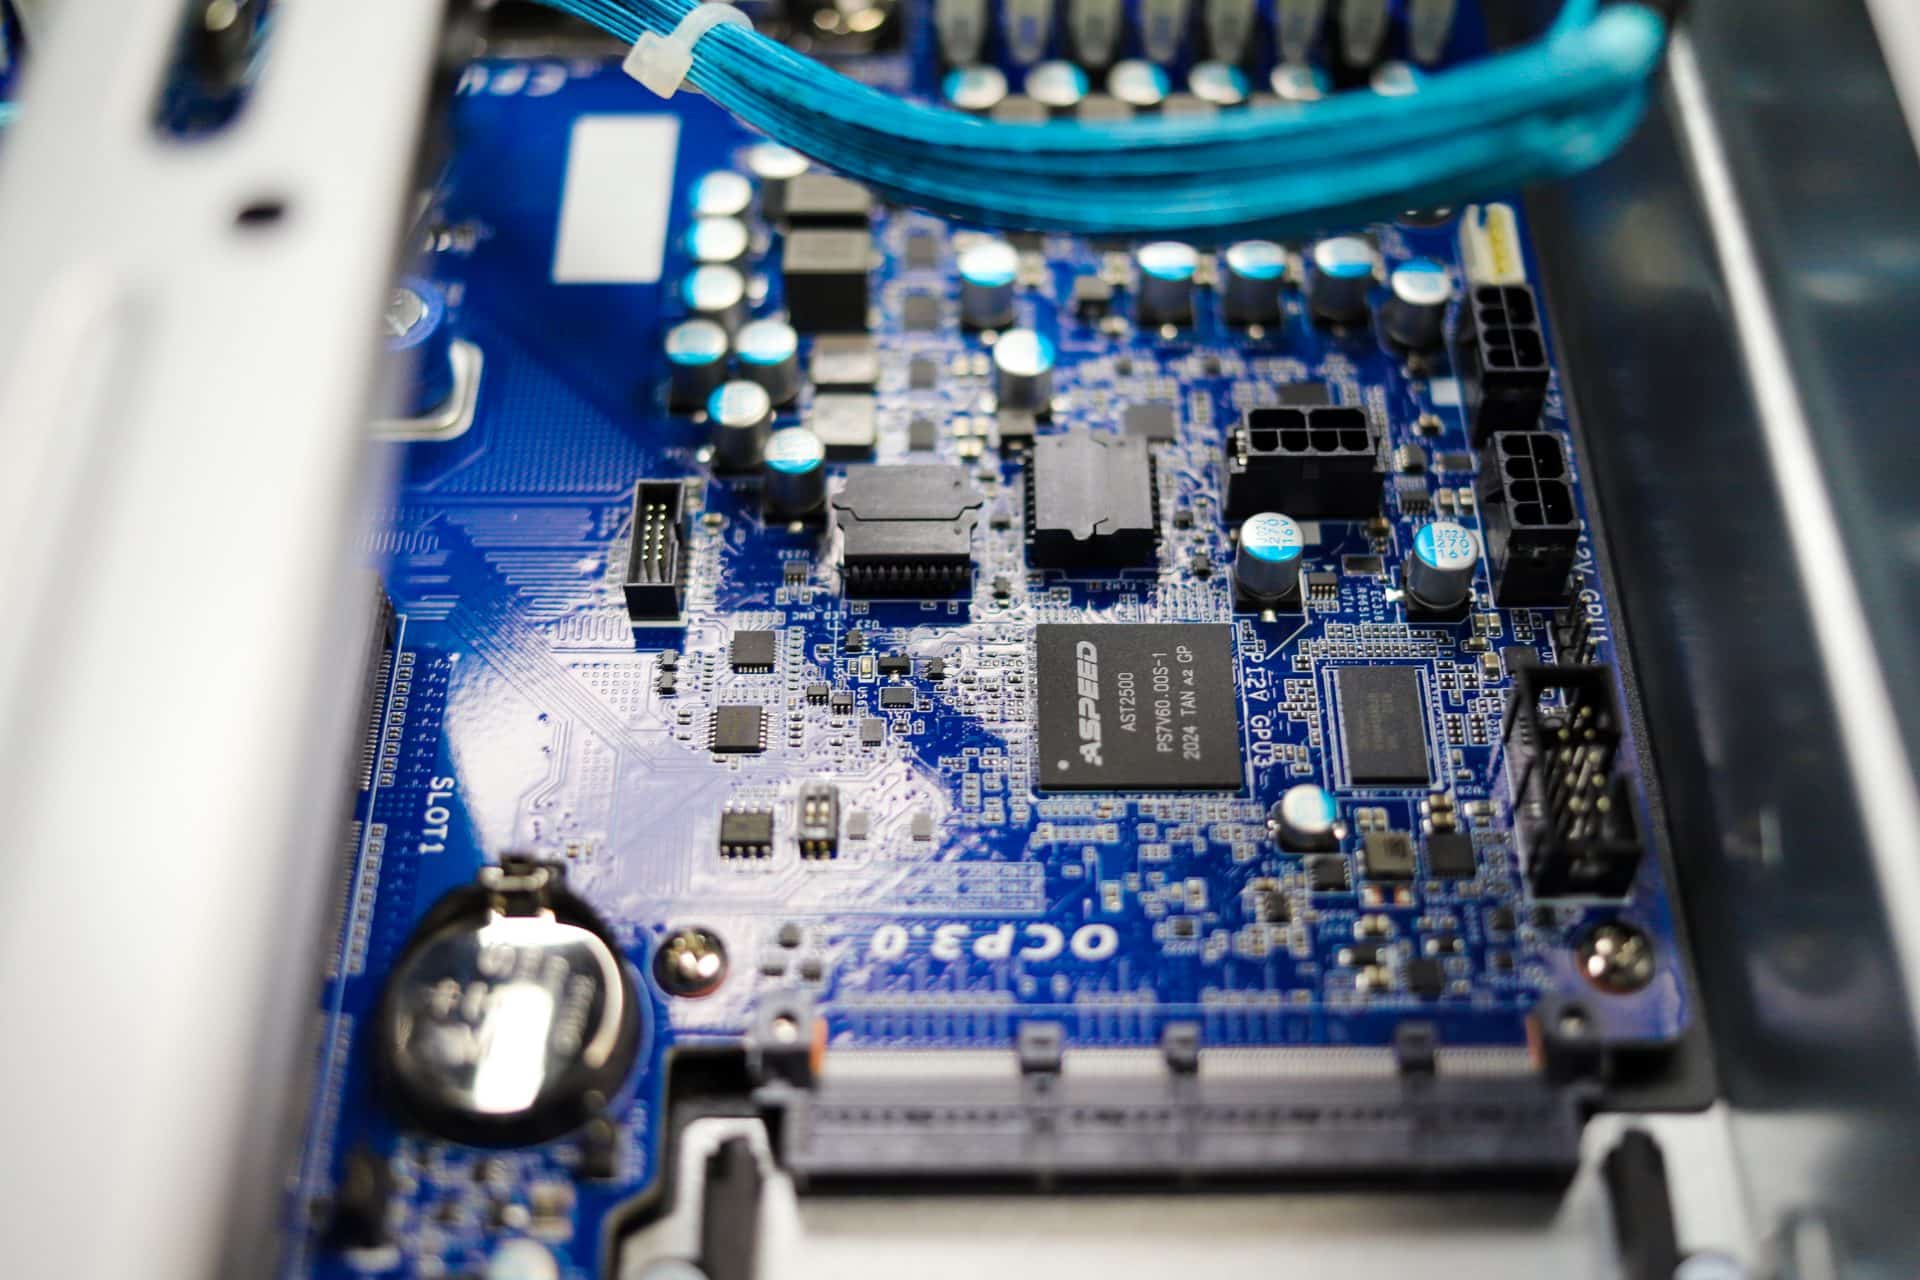
| Video | Integrated in Aspeed® AST2500 2D Video Graphic Adapter with PCIe bus interface 1920×1200@60Hz 32bpp, DDR4 SDRAM |
| Expansion Slots | Riser Card CRS2033: (1) PCIe x16 slot (Gen4 x16), Full height half-length (2) PCIe x8 slots (Gen4 x8), Full height half-length Riser Card CRS2137: (1) PCIe x16 slot (Gen4 x16 or x8), Full height half-length (1) PCIe x8 slots (Gen4 x0 or x8), Full height half-length (1) PCIe x16 slot (Gen4 x16 or x8), shared with OCP 2.0, Full height half-length Riser Card CRS2027: (2) PCIe x8 slots (Gen4 x8), Low profile half-length (1) OCP 3.0 mezzanine slot with PCIe Gen4 x16 bandwidth from CPU_0 Supported NCSI function (1) OCP 2.0 mezzanine slot with PCIe Gen3 x8 bandwidth from CPU_1 Supported NCSI function |
| Internal I/O | (2) CPU fan headers, (1) USB 3.0 header, (1) TPM header, (1) VROC connector, (1) Front panel header, (1) HDD back plant board header, (1) IPMB connector, (1) Clear CMOS jumper, (1) BIOS recovery switch |
| Front I/O | (2) USB 3.0, (1) Power button with LED, (1) ID button with LED, (1) Reset Button, (1) NMI button, (1) System status LED, (1) HDD activity LED, (2) LAN activity LEDs |
| Rear I/O | (2) USB 3.0, (1) VGA, (2) RJ45, (1) MLAN, (1) ID button with LED |
| Backplane I/O | Front side_CBP20C5: 8 x SATA/SAS and 4 x SATA/SAS/NVMe ports Rear side_CBP2022: 2 x SATA ports Bandwidth: PCIe Gen4 x4 or SATA 6Gb/s or SAS 12Gb/s per port |
| Power Supply | (2) 1600W redundant PSUs (80 PLUS Platinum) |
| Management | Aspeed® AST2500 management controller GIGABYTE Management Console (AMI MegaRAC SP-X) web interface |
Gigabyte R282-3C0 Design and Build
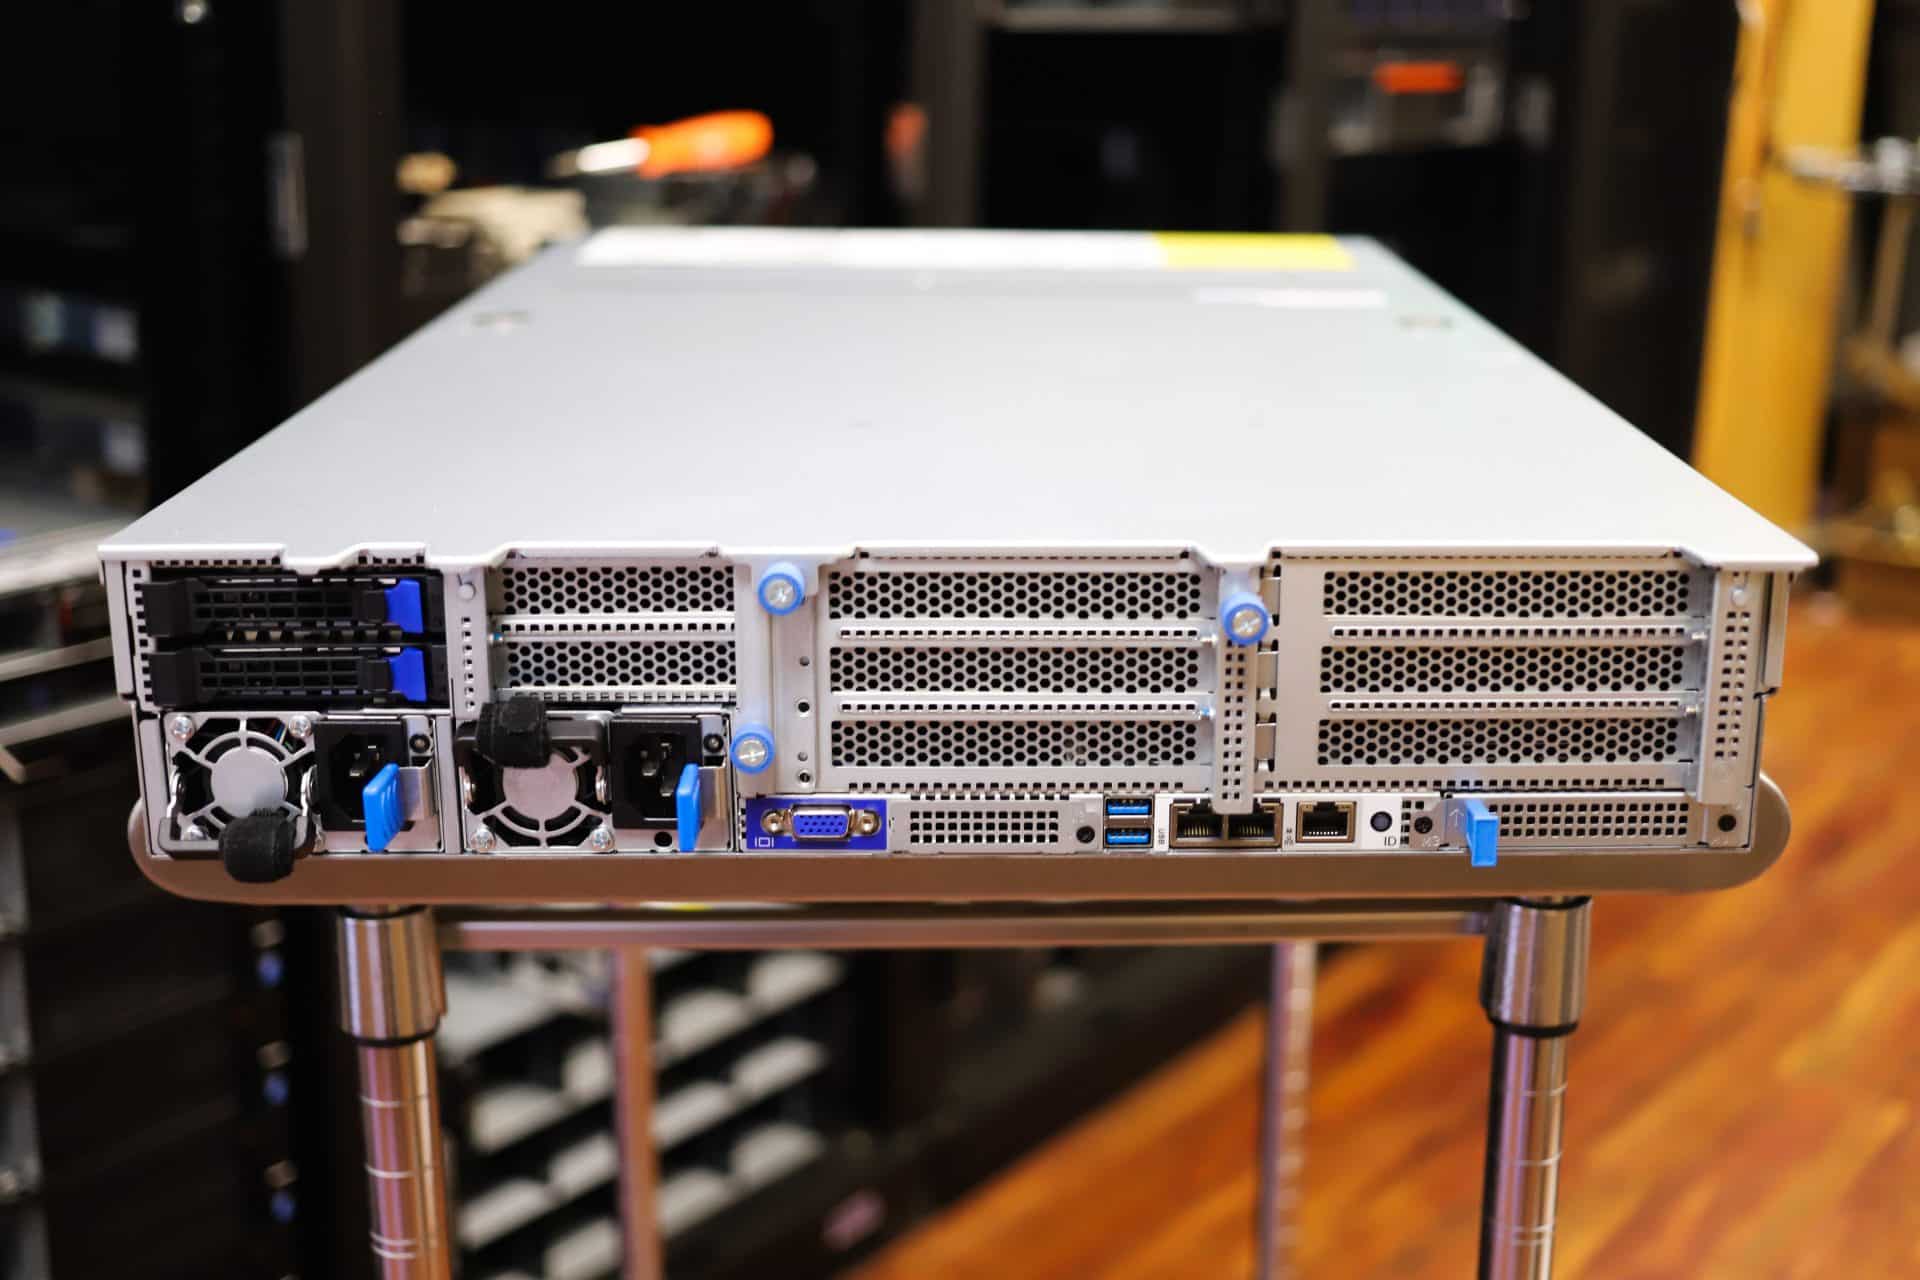
This review system has interesting features and layout. The first thing to notice is the number of drive bays in the machine. There are eight 3.5” SATA hot-swappable HDD/SSD bays, four 3.5” NVMe hot-swappable HDD/SSD bays, and finally two 2.5” bays on the rear of the machine that could be used for booting.
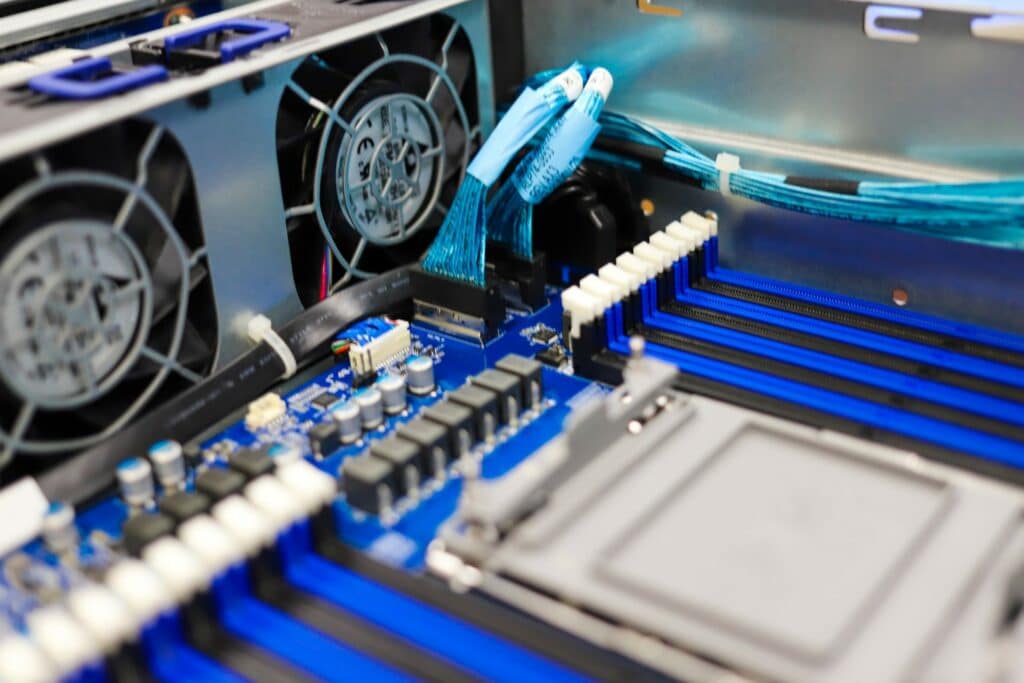
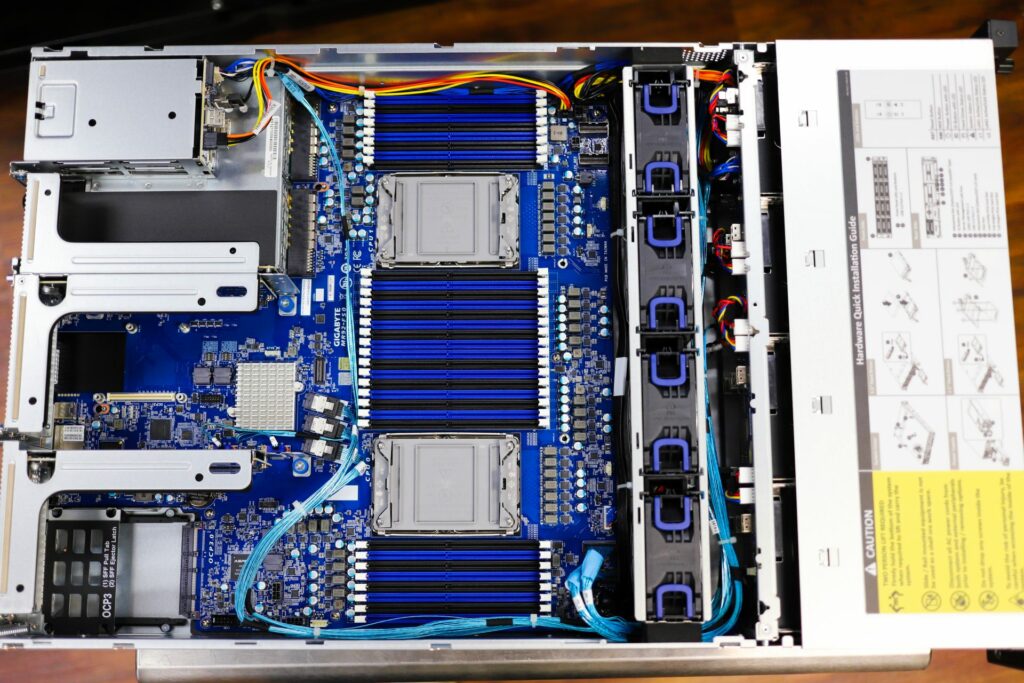
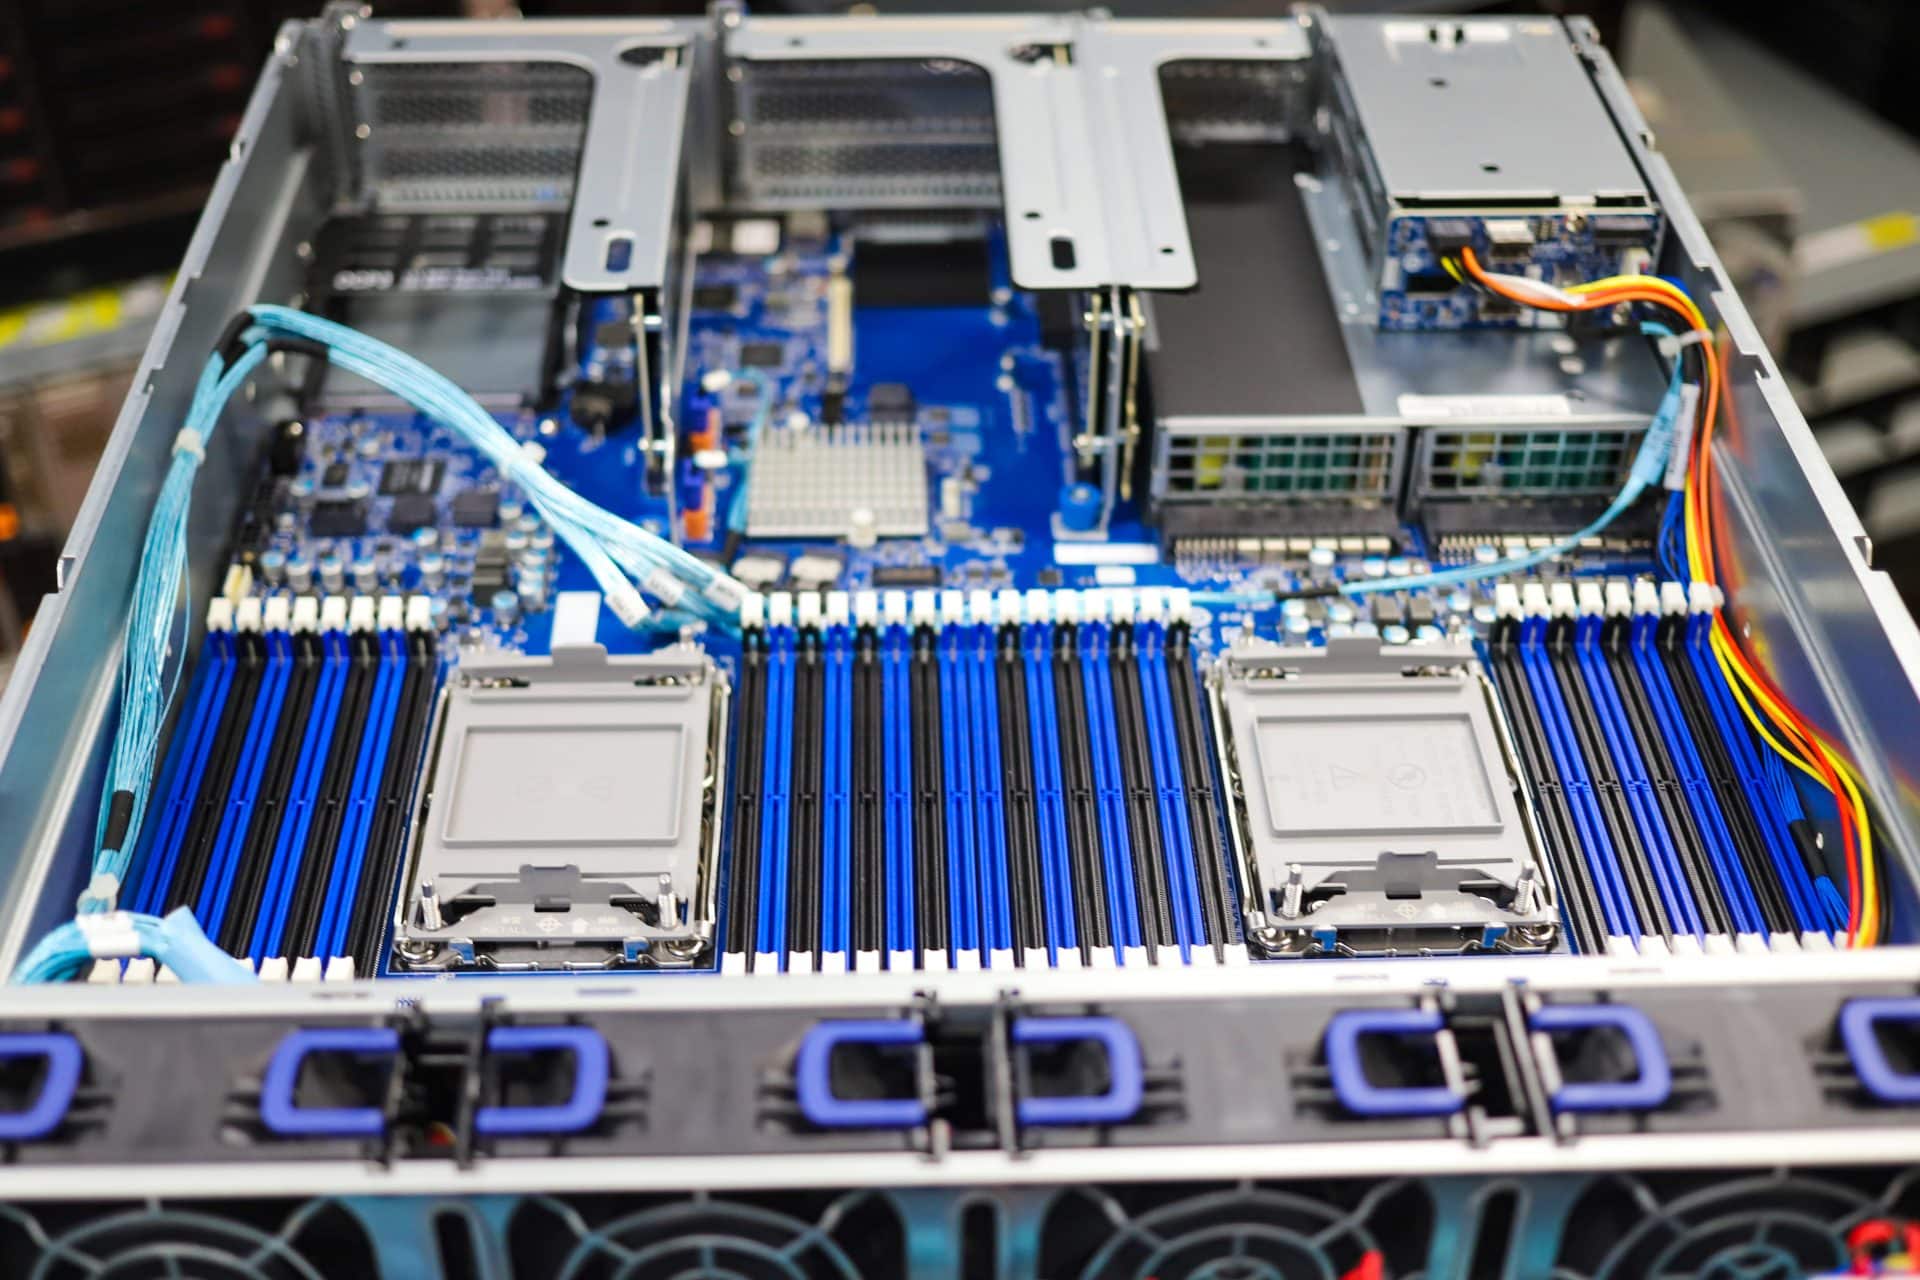
In terms of the motherboard, on the model that we have, the MR92-FS0, which comes with 2 sockets for the dual CPU set that is onboard, 32 DIMM slots with DDR4 support, 8 PCIe slots with varying lengths. The most interesting thing to note about the model that we have is that there isn’t an M.2 slot. Most other servers have an M.2 slot, which would be used to boot, however, we don’t have one. This may be an inconvenience, non-issue, or deal-breaker, but something the buyer must think about.
On the rear of the server, there 2 USB 3.0 ports, a VGA port, 2 RJ45 ports, an MLAN port, an ID button with LED, and 2 power connector ports for the dual power supplies that are within the server
Gigabyte R282-3C0 Management
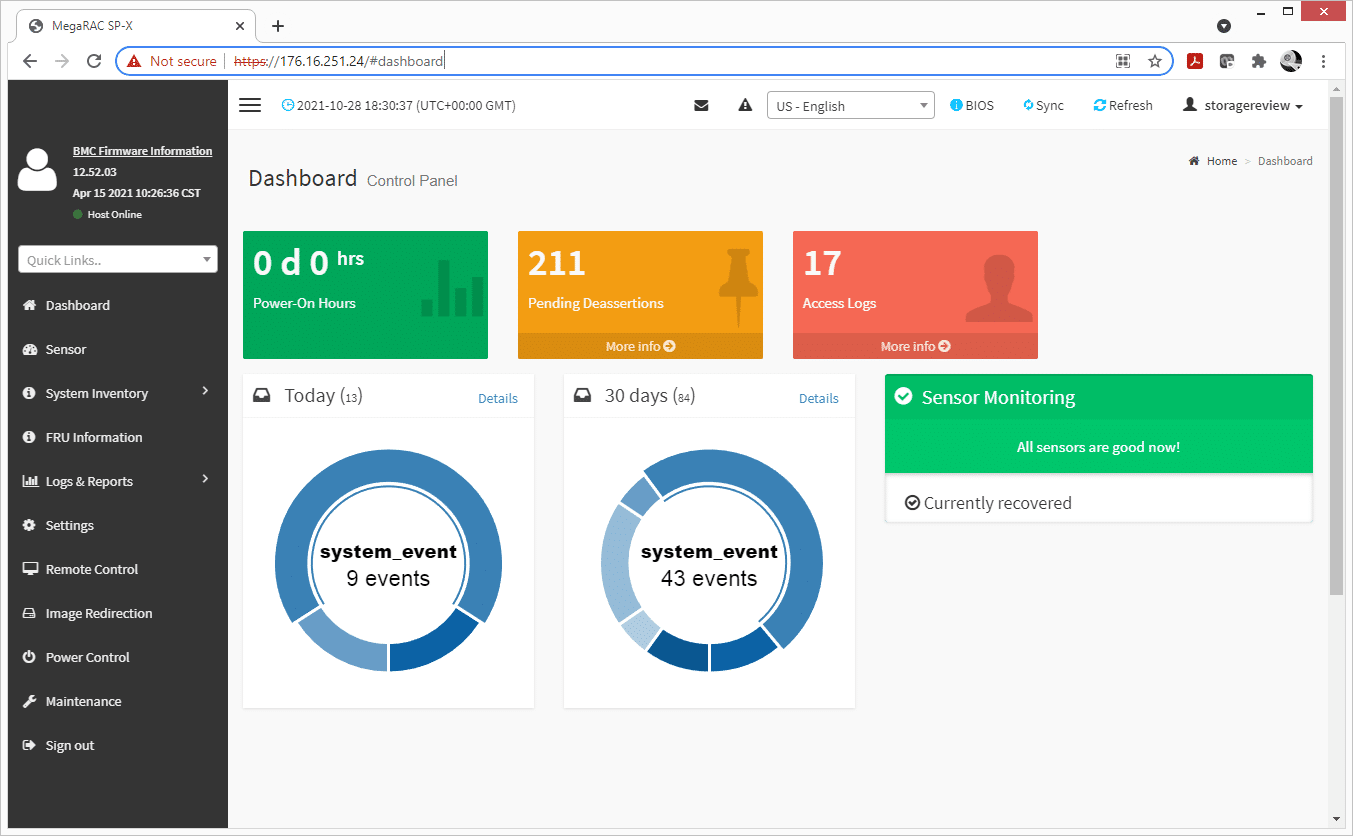
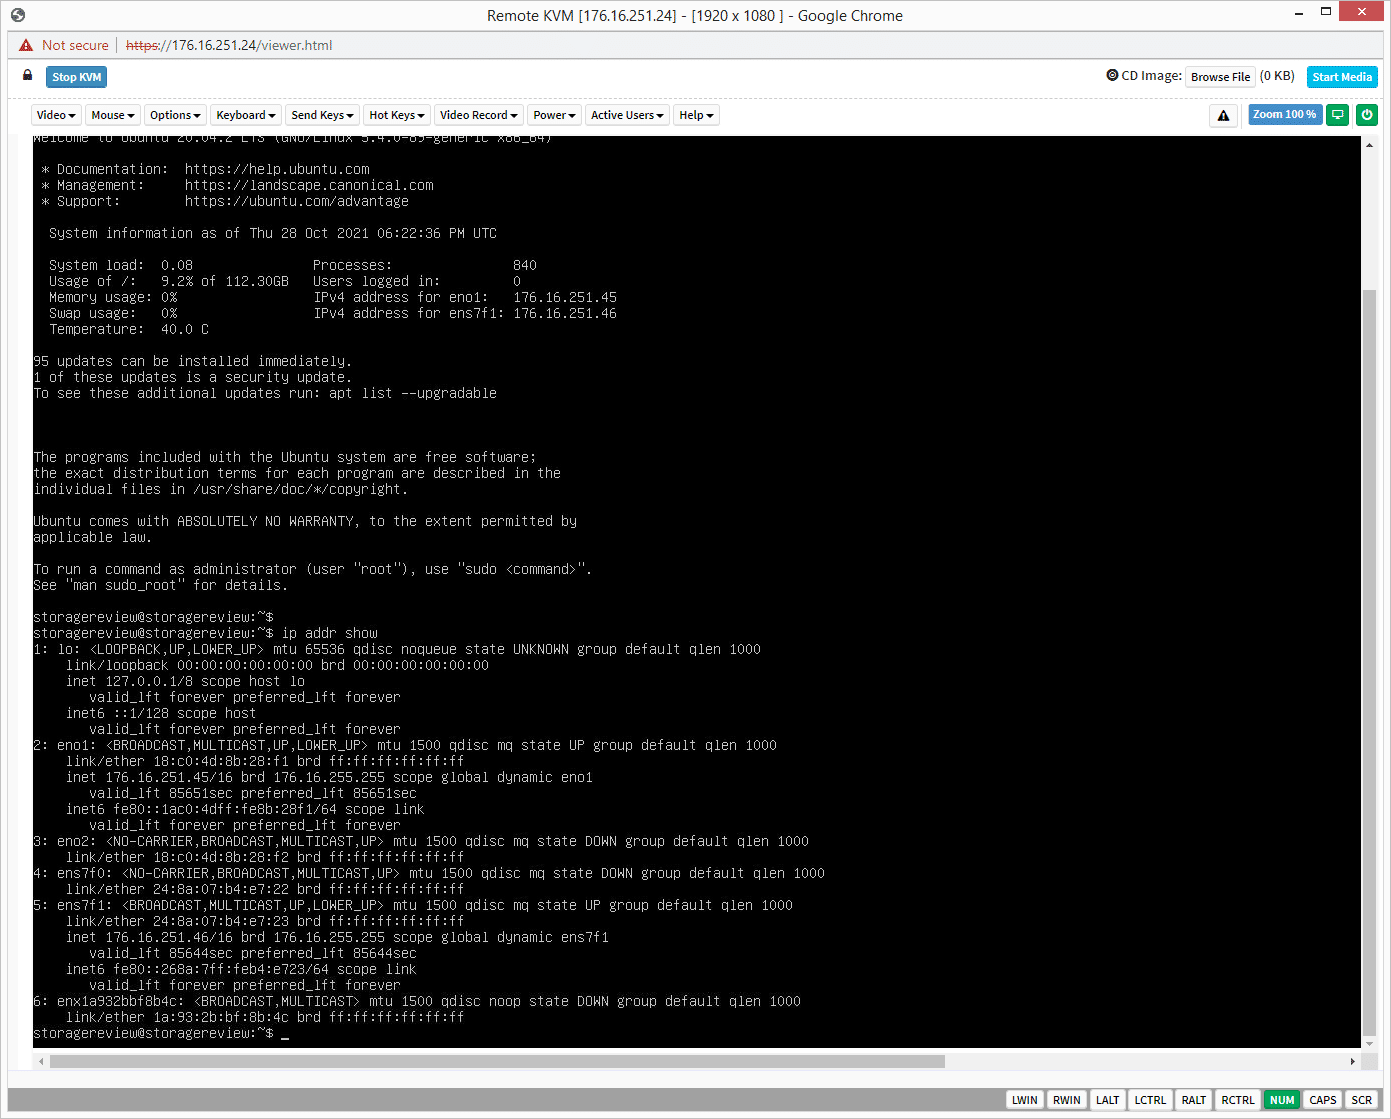
The Gigabyte R282-3C0 utilizes a MegaRAC SP-X BMC for out-of-band management. This management platform allows users to handle basic tasks such as remotely controlling the power to the server, flashing the BIOS and launching a KVM for installing software on the server.
The interface is a bit clunky compared to what you might find on a Tier1 server from Dell EMC, HPE, Cisco, etc, but it gets the job done for managing the system remotely. Users are also given HTML5 and Java KVM options depending on which they prefer to use. The only negative we ran into with the KVM specifically is mounted ISOs were limited to just over 1Mb/s of transfer speed, making even smaller footprint OS installs take quite a long time. The compromise we found was flashing a USB thumb drive with the OS installer and using the KVM to remotely install it.
Gigabyte R282-3C0 Performance
When it comes to the performance of the server, we conducted several tests based on the configuration of (2) Intel 8380 CPUs, (16) 32GB DDR4 at 3200Mhz, and (4) Intel P5510 7.68TB SSDs.
SQL Server Performance
StorageReview’s Microsoft SQL Server OLTP testing protocol employs the current draft of the Transaction Processing Performance Council’s Benchmark C (TPC-C), an online transaction processing benchmark that simulates the activities found in complex application environments. The TPC-C benchmark comes closer than synthetic performance benchmarks to gauging the performance strengths and bottlenecks of storage infrastructure in database environments.
Each SQL Server VM is configured with two vDisks: 100GB volume for boot and a 500GB volume for the database and log files. From a system resource perspective, we configured each VM with 16 vCPUs, 64GB of DRAM and leveraged the LSI Logic SAS SCSI controller. While our Sysbench workloads tested previously saturated the platform in both storage I/O and capacity, the SQL test looks for latency performance.
SQL Server Testing Configuration (per VM)
- Windows Server 2012 R2
- Storage Footprint: 600GB allocated, 500GB used
- SQL Server 2014
- Database Size: 1,500 scale
- Virtual Client Load: 15,000
- RAM Buffer: 48GB
- Test Length: 3 hours
- 2.5 hours preconditioning
- 30 minutes sample period
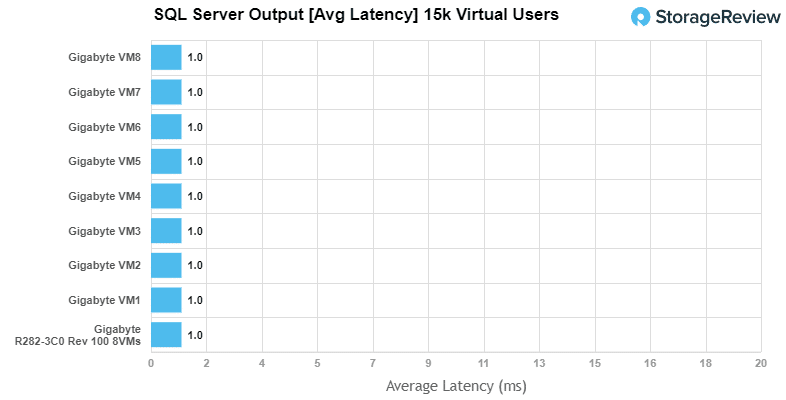
For SQL Server average latency, the Gigabyte R282-3C0 maintained a 1ms latency throughout with 8VM.
Sysbench MySQL Performance
Our first local-storage application benchmark consists of a Percona MySQL OLTP database measured via SysBench. This test measures average TPS (Transactions Per Second), average latency, and average 99th percentile latency as well.
Each Sysbench VM is configured with three vDisks: one for boot (~92GB), one with the pre-built database (~447GB), and the third for the database under test (270GB). From a system resource perspective, we configured each VM with 16 vCPUs, 60GB of DRAM and leveraged the LSI Logic SAS SCSI controller.
Sysbench Testing Configuration (per VM)
- CentOS 6.3 64-bit
- Percona XtraDB 5.5.30-rel30.1
- Database Tables: 100
- Database Size: 10,000,000
- Database Threads: 32
- RAM Buffer: 24GB
- Test Length: 3 hours
- 2 hours preconditioning 32 threads
- 1 hour 32 threads
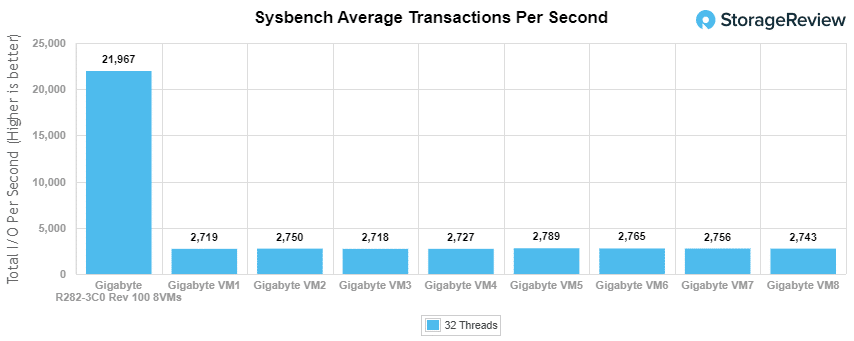
With the Sysbench OLTP, we recorded an aggregate score of 25,537 TPS for the 8VMs with individual VMs ranging from 3,187 to 3,199 TPS. The average and ranges weren’t a shock to us, as in the past, we have seen similar servers perform about the same.
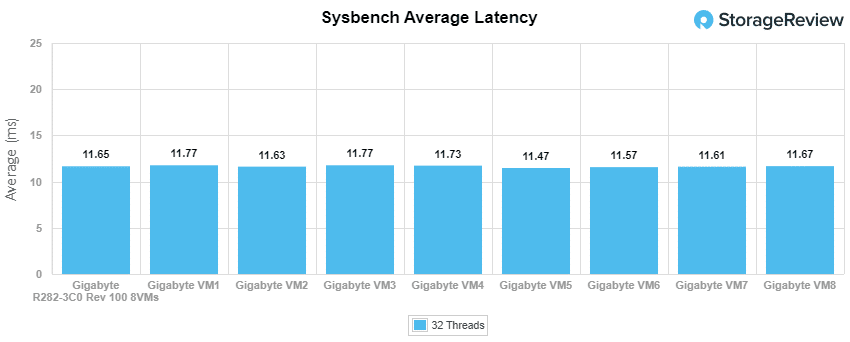
With average latency, 8VM gave us an aggregate time of 10.025 with individual VMs ranging from 10 to 10.04.
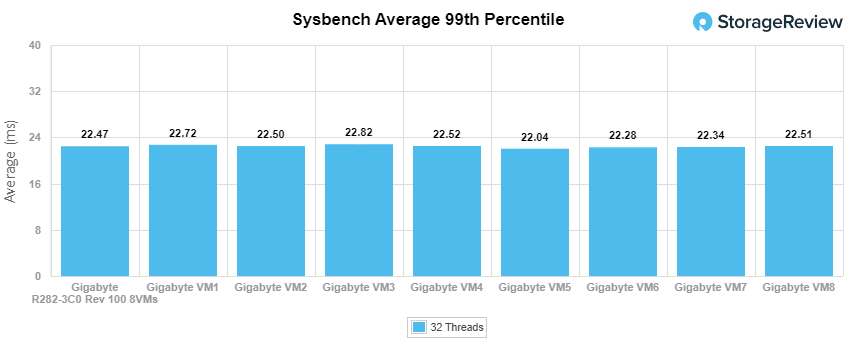
In our worst-case scenario, 99th percentile, the latency on the 8VM hit an aggregate time of 19.13ms with individual times ranging from 19.07ms to 19.17ms.
VDBench Workload Analysis
When it comes to benchmarking storage devices, application testing is best, and synthetic testing comes in second place. While not a perfect representation of actual workloads, synthetic tests do help to baseline storage devices with a repeatability factor that makes it easy to do apples-to-apples comparison between competing solutions.
These workloads offer a range of different testing profiles ranging from “four corners” tests, common database transfer size tests, as well as trace captures from different VDI environments. All of these tests leverage the common vdBench workload generator, with a scripting engine to automate and capture results over a large compute testing cluster. This allows us to repeat the same workloads across a wide range of storage devices, including flash arrays and individual storage devices.
Profiles:
- 4K Random Read: 100% Read, 128 threads, 0-120% iorate
- 4K Random Write: 100% Write, 128 threads, 0-120% iorate
- 64K Sequential Read: 100% Read, 32 threads, 0-120% iorate
- 64K Sequential Write: 100% Write, 16 threads, 0-120% iorate
- Synthetic Database: SQL and Oracle
- VDI Full Clone and Linked Clone Traces
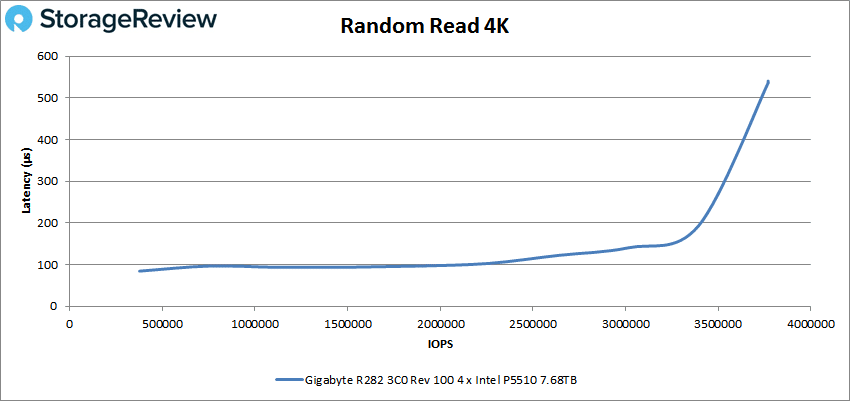
Looking at random 4K read, the Gigabyte R282-3C0 started under 100µs and stayed there until about 2.25 million IOPS and went on to peak at 3,770,372 IOPS and with a latency of 536µs.
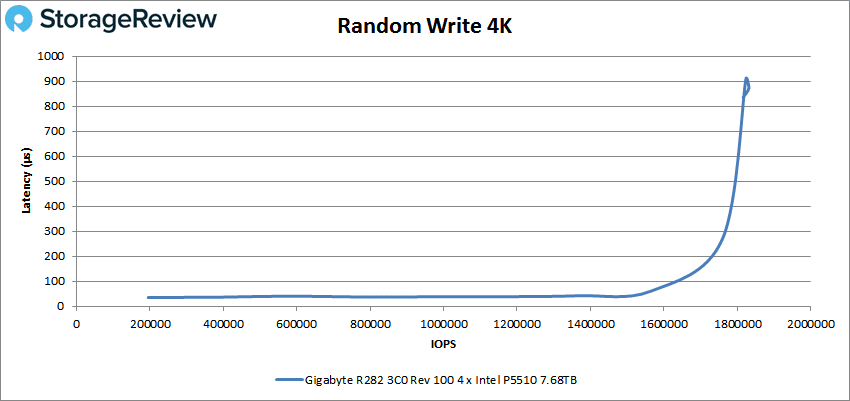
4K random write had a really good start with the latency being well under 100µs at 35µs and staying there until the server reached a little over 1.6 million IOPS. The peak then happens at 1,823,423 IOPS, with a latency of 909µs.
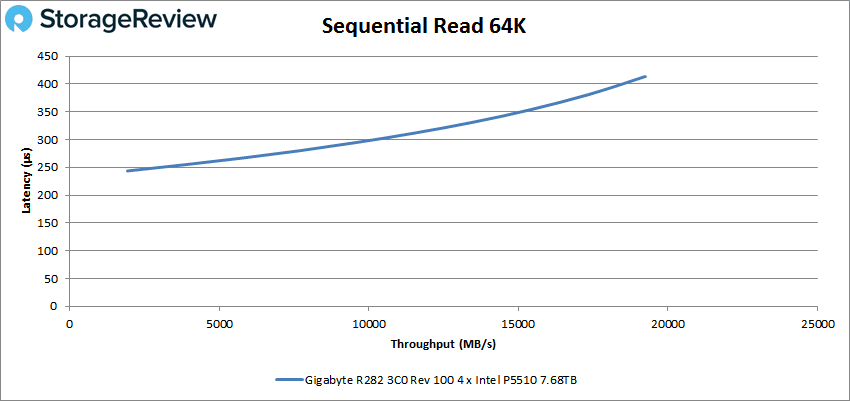
Moving onto the 64K sequential read, we saw the R282 peak at 307,885 IOPS with a latency of 413µs.
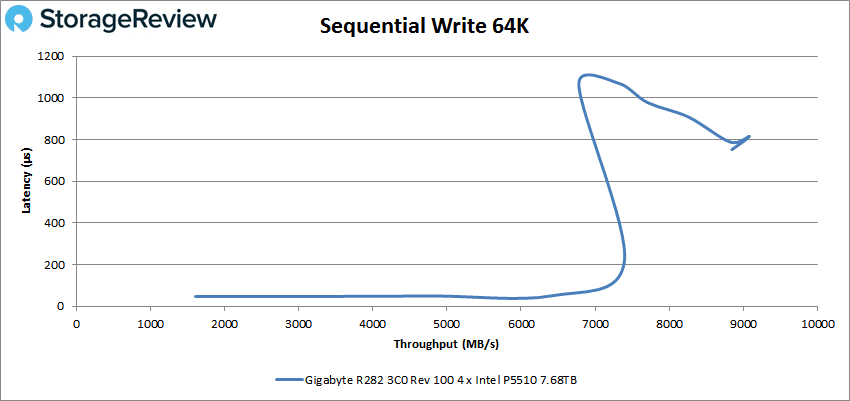
Next, the 64K sequential write gave us a peak performance of 116,957 IOPS with a latency of 1071µs, however, we also saw a decline after that, going back down to around 140,000 IOPS with a latency of roughly 800µs.
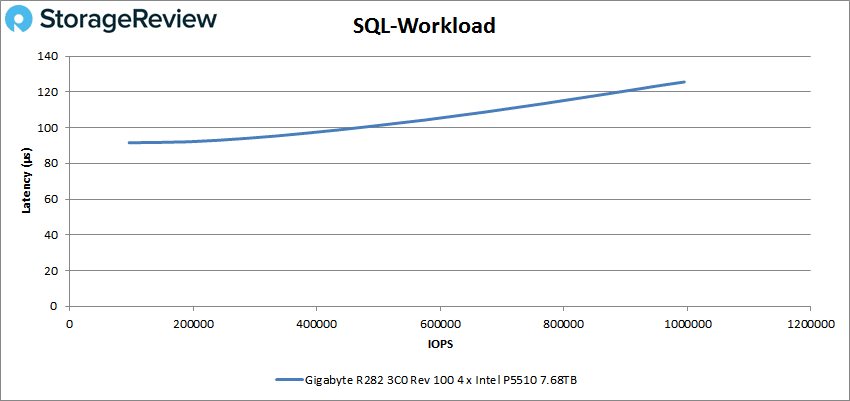
Now we have our SQL workloads, SQL, SQL 90-10, and SQL 80-20. With SQL, the Gigabyte R282-C03 started at 91µs and crossed over 100µs at 480,959 IOPS. The server then went on to peak at 995,117 IOPS and had a latency of 125µs.
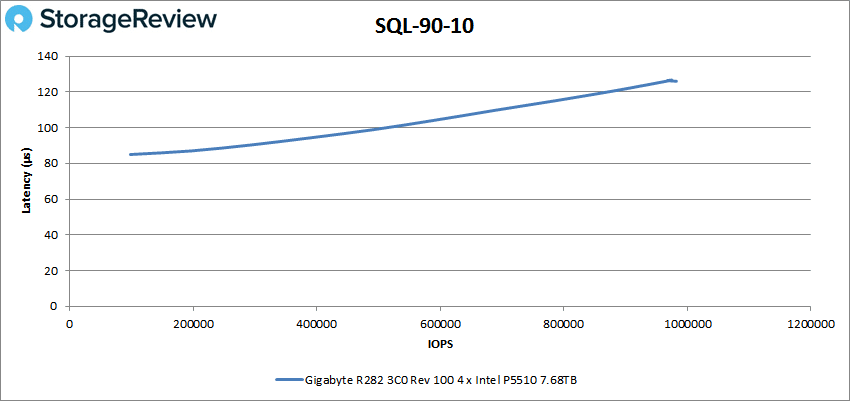
In SQL 90-10, the server had a starting latency of 85µs and was able to stay under 100µs until it reached 589,647 IOPS. It then peaked at 967,723 IOPS with a latency of 126µs.
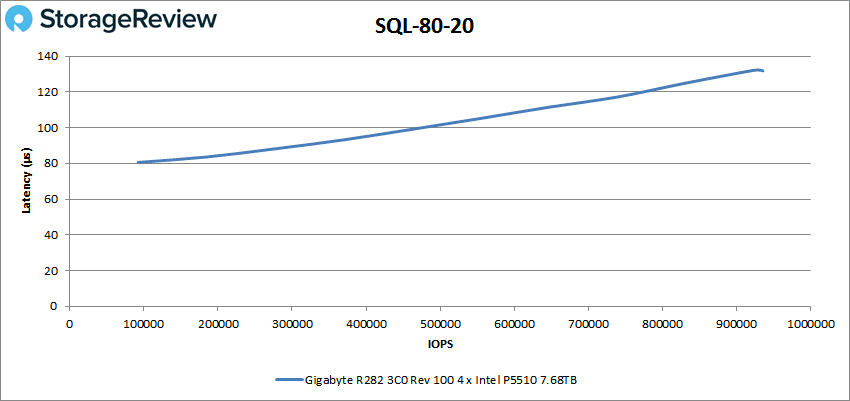
In SQL 80-20, the server had a starting latency of 80µs and was able to stay under 100µs until it reached 554,447 IOPS. It then peaked at 935,383 IOPS with a latency of 132µs.
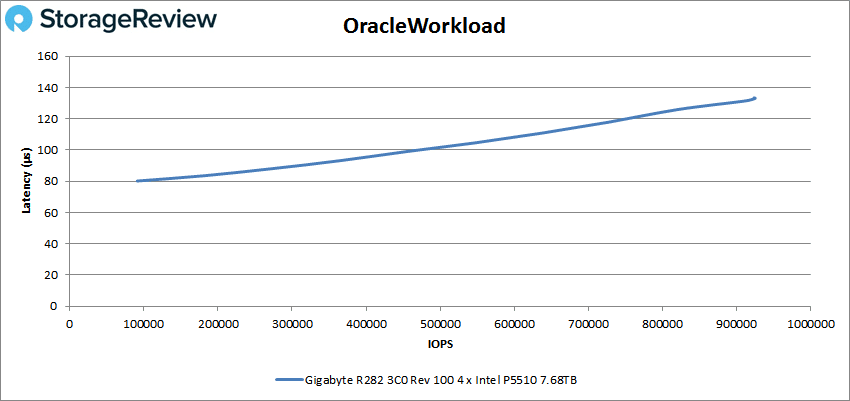
Our next tests were our Oracle Workloads, Oracle, Oracle 90-10, and Oracle 80-20. With our Oracle workload, the R282 started with a latency of 80µs and then went on to peak at 924,993 IOPS with a latency of 133µs.
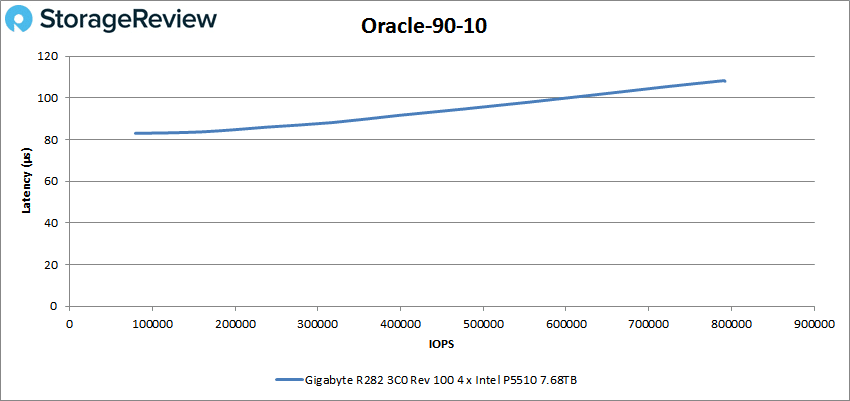
For our Oracle 90-10, the server started at 83µs and was able to maintain the latency under 100µs until 635,178 IOPS, but then went on to peak at 792,231 IOPS with a latency of 108µs.
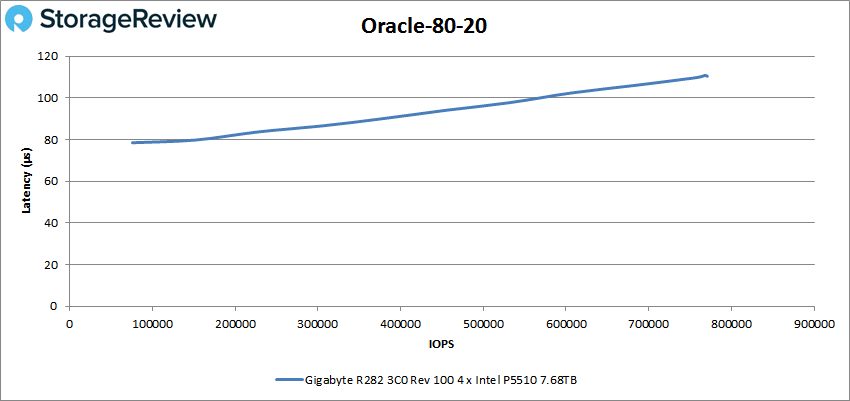
Lastly, Oracle 80-20 was also able to stay under 100 for most of the test, starting at 78.5µs, and then peaking at 770,853 IOPS with a latency of 110µs.
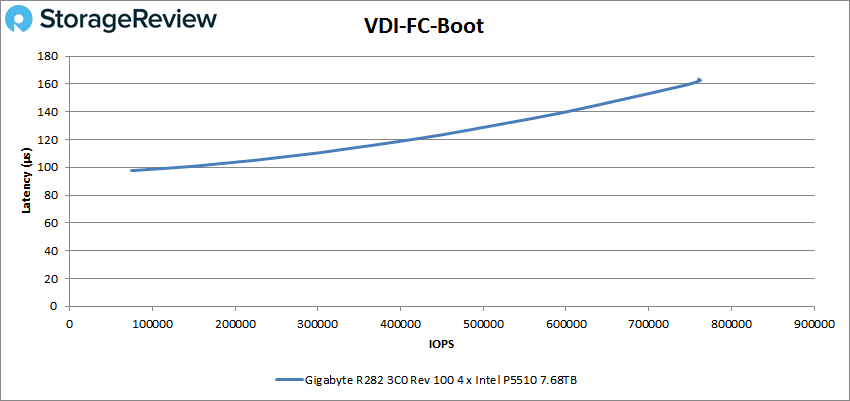
For our last tests, we switched over to our VDI clone test, Full and Linked. For VDI Full Clone (FC) boot, the R282 peaked at 762,590 IOPS with a latency of 162µs.
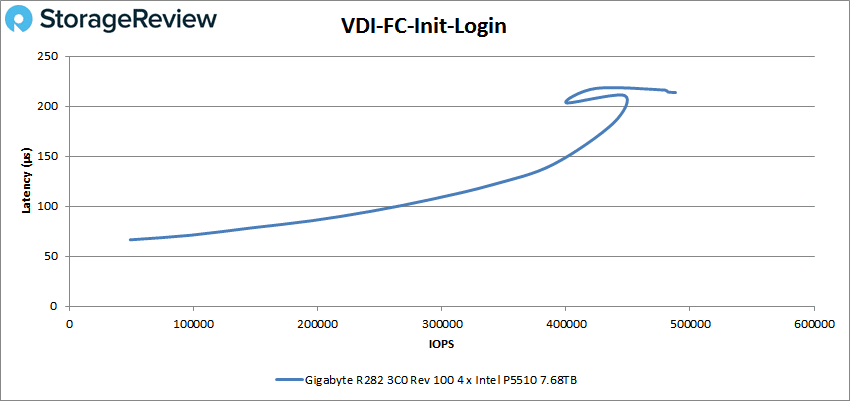
In the VDI FC Initial Login, the server saw a steady then sharp rise to a peak of 479,697 IOPS with a latency of 216µs.
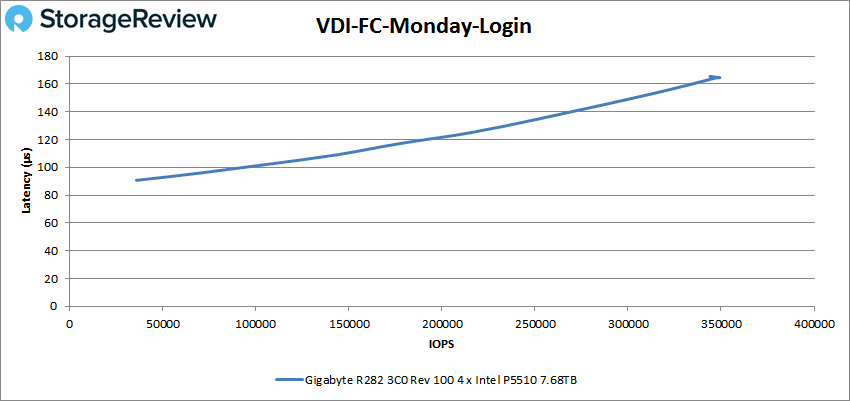
For the VDI FC Monday Login, the server had a steady rise until it peaked at 347,985 IOPS with a latency of 165µs.
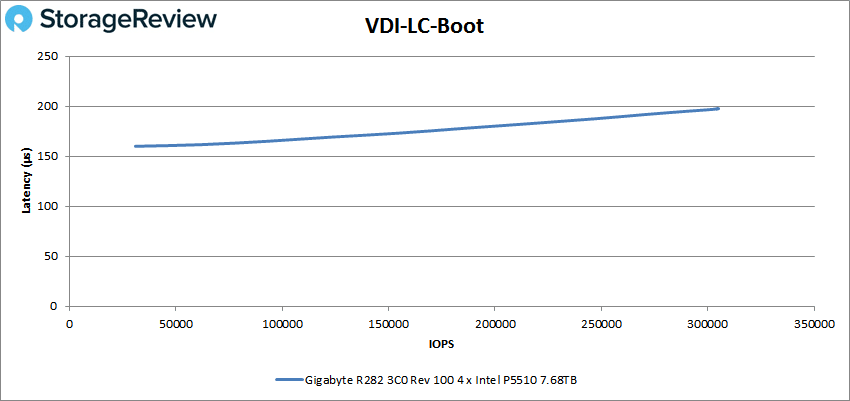
Now for the VDI Linked Clone (LC) tests, starting with the boot, the server had a short rise to a peak of 305,058 IOPS with a latency of 197µs.
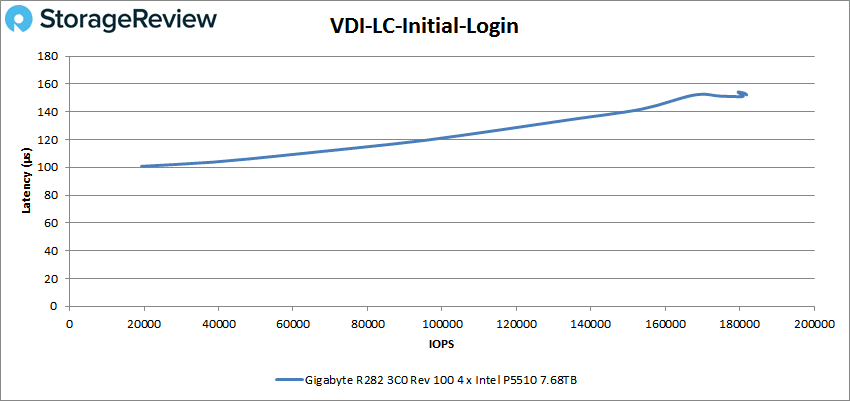
For the Initial Login test, the server had a big rise, starting at 100µs and then went on to peak at 167,785 IOPS with a latency of 152µs.
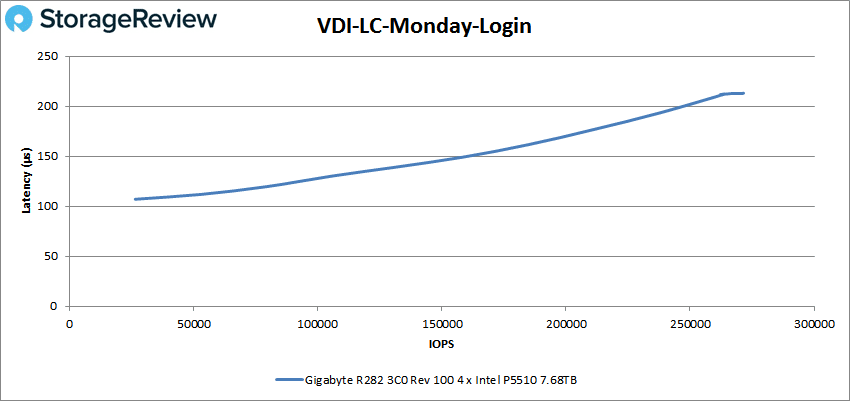
Finally, for the Monday Login, the server had a big rise, starting at 107µs and was able to peak at 271,522 IOPS with a big jump in latency up to 213µs.
Conclusion
The Gigabyte R282-3C0 is a 2U, dual-processor server that takes the performance of the 3rd Gen Xeon Scalable processors and puts them to the test. Along with the 12 hot-swappable 3.5″ bays on the front, four of which are able to support NVMe, this server is able to hold a mix of storage. For organizations that need accelerated capacity, it’s interesting to mix some flash for tiering, with low-cost HDDs for storage. Then you have the twin SATA drives in the back that can be used for boot. This is useful as there’s no M.2 storage onboard.
The various tests that we ran on the server came out to be what we had already expected. The limitation of four NVMe bays held back the peak storage potential since most of the bays are leveraged for higher-capacity spinning media. The drive configuration though is targeted, most customers would put midrange CPUs in a system like this and target a more balanced price point. Of course, something else in the Gigabyte lineup would have more performance with a full slate of NVMe. They have the R282-Z92 for instance that can pair up 24 NVMe SSDs with GRAID for incredible performance.
For our synthetic SQL tests, we saw a maximum of 481K IOPS in our SQL workload, 968K IOPS in SQL 90-10, and in the SQL 80-20 test, 935K IOPS maximum. In our Oracle tests, we saw 924K IOPS in Oracle workload, 792K in Oracle 90-10, and 770K in Oracle 80-20. In VDBench, we recorded 3.7 million IOPS in 4K read, 1.8 million in 4K write, 307,885 IOPS in 64K read, and 116,957 in 64K write. Lastly, in the VDI Full Clone tests, we saw 762K IOPS in boot, 479K in Initial Login, and 348K in Monday Login; for the Linked Clone, we saw 305K IOPS in boot, 167K in Initial Login, and 272K in Monday Login.
Realistically, this server is going to be used for high-density storage, with a possibility of acceleration via NVMe flash. The only thing that is holding this server back is more NVMe storage, but this build puts a focus on the capacity-per-dollar advantages HDDs offer. The Gigabyte R282-3C0 is a good choice for use cases that want a mix of capacity and NVMe in a 12-bay (or 14 depending on how you count) design built around the Intel Scaleable Gen3 architecture.
Engage with StorageReview
Newsletter | YouTube | Podcast iTunes/Spotify | Instagram | Twitter | Facebook | RSS Feed

