With high capacity (up to 7.68TB for the read-intensive version) the HGST Ultrastar SS200 SSDs are aimed at the enterprise looking to expand its flash footprint or go all-flash. Not just sporting a high capacity, the drives are also able to hit up to 1.8GB/s in sequential read and up to 250K IOPS in random read. The drive was released in two flavors, though the name is the same SS200, a mixed workload and a read-intensive version.
As the two drives are the nearly identical, expect for endurance, for a description one can jump over to the other review found here.
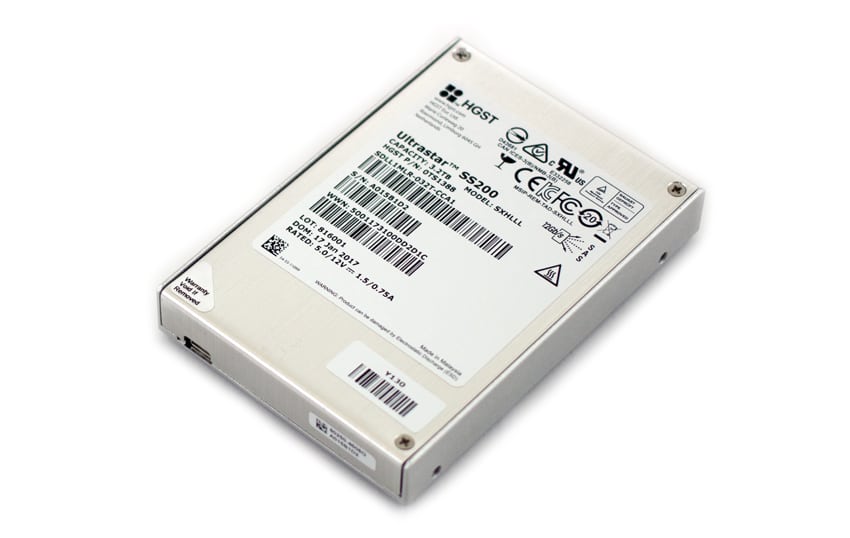
HGST Ultrastar SS200 specifications:
- Form factor: 2.5”
- Interface: SAS 12Gb/s
- Capacity: 3.2TB, 1.6TB, 800GB, 400GB
- DWPD: 3
- Performance
- Sequential Read (max MB/s, 128KiB): 1,800
- Sequential Write (max MB/s, 128KiB): 1,000
- Random Read (max IOPS, 4KiB): 250K
- Random Write (max IOPS, 4KiB): 86K
- Mixed Random Read/Write (max IOPS 70%R/30%W, 4KiB): 154K
- Write Latency 512B (μs): 100
- Reliability
- Error Rate in bits read: < 1 in 10^17
- MTBF: 2.5M hours
- Annual failure rate (AFR): 0.35%
- Limited warranty: 5 years
- Data Retention: 3-month at 40°C
- Power
- Requirement (DC +/- 5%): 5V & 12V
- Operating (W, typical): 9 or 11
- Idle (W): 3.8 to 4.3
- Physical
- z-height (mm): 15
- Dimensions (width x depth, mm): 69.85 x 100.45
- Weight (g, max): 200
- Environmental
- Temperature: 0°C to 70°C (Case)
Testing Background and Comparables
The StorageReview Enterprise Test Lab provides a flexible architecture for conducting benchmarks of enterprise storage devices in an environment comparable to what administrators encounter in real deployments. The Enterprise Test Lab incorporates a variety of servers, networking, power conditioning, and other network infrastructure that allows our staff to establish real-world conditions to accurately gauge performance during our reviews.
We incorporate these details about the lab environment and protocols into reviews so that IT professionals and those responsible for storage acquisition can understand the conditions under which we have achieved the following results. None of our reviews are paid for or overseen by the manufacturer of equipment we are testing. Additional details about the StorageReview Enterprise Test Lab and an overview of its networking capabilities are available on those respective pages.
We tested all SSDs in this review inside the Supermicro SuperServer 2028U-TNR4T. It is configured with 2 x Intel E5-2699 v3 CPUs, 768GB RAM (24 x 32GB DDR4) and is running ESXi 6.0 for a hypervisor. The HBA leveraged for SATA and SAS testing is a SuperMicro HBA based on the LSI Logic Fusion-MPT 12GSAS SAS3008 chipset.
Comparables for this review:
- Toshiba SAS3 1.6TB PX04SMB
- Seagate SAS3 1.6TB 1200.2
- Seagate 1200.2 3.84TB
- HGST SS200 7.68TB (Read-Intensive)
- HGST 1.6TB SAS3
Application Workload Analysis
In order to understand the performance characteristics of enterprise storage devices, it is essential to model the infrastructure and the application workloads found in live production environments. Our benchmarks for the HGST SS200 are therefore the MySQL OLTP performance via SysBench and Microsoft SQL Server OLTP performance with a simulated TCP-C workload. For our application workloads, each drive will be running 2-4 identically configured VMs.
SQL Server Performance
Each SQL Server VM is configured with two vDisks: 100GB volume for boot and a 500GB volume for the database and log files. From a system resource perspective, we configured each VM with 16 vCPUs, 64GB of DRAM and leveraged the LSI Logic SAS SCSI controller. While our Sysbench workloads tested previously saturated the platform in both storage I/O and capacity, the SQL test is looking for latency performance.
This test uses SQL Server 2014 running on Windows Server 2012 R2 guest VMs, being stressed by Quest's Benchmark Factory for Databases. StorageReview’s Microsoft SQL Server OLTP testing protocol employs the current draft of the Transaction Processing Performance Council’s Benchmark C (TPC-C), an online transaction-processing benchmark that simulates the activities found in complex application environments. The TPC-C benchmark comes closer than synthetic performance benchmarks to gauging the performance strengths and bottlenecks of storage infrastructure in database environments. Each instance of our SQL Server VM for this review uses a 333GB (1,500 scale) SQL Server database and measures the transactional performance and latency under a load of 15,000 virtual users.
SQL Server Testing Configuration (per VM)
- Windows Server 2012 R2
- Storage Footprint: 600GB allocated, 500GB used
- SQL Server 2014
- Database Size: 1,500 scale
- Virtual Client Load: 15,000
- RAM Buffer: 48GB
- Test Length: 3 hours
- 2.5 hours preconditioning
- 30 minutes sample period
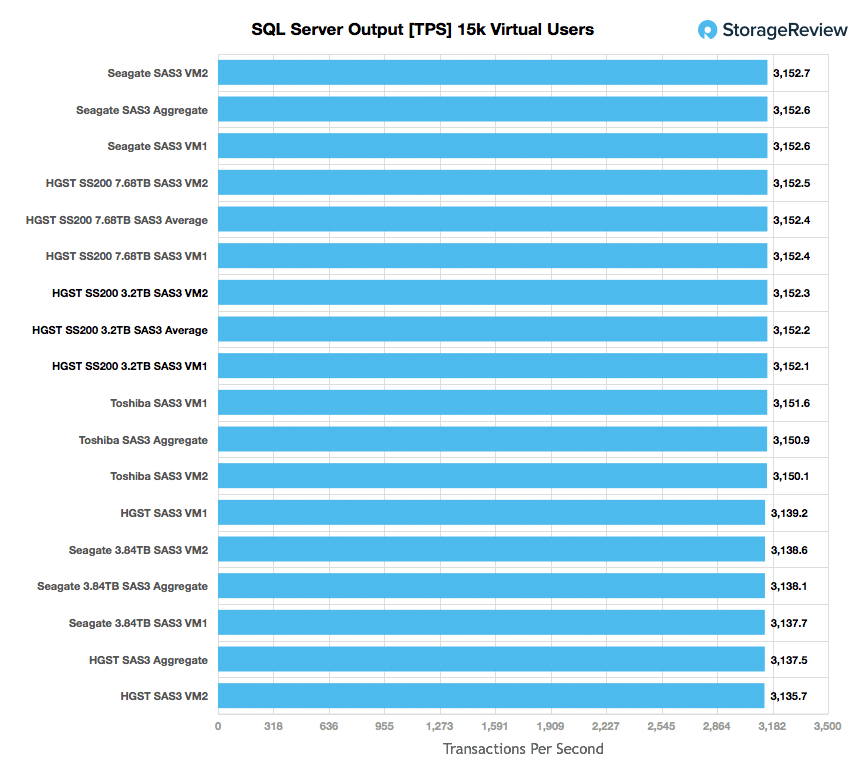
When looking at SQL Server Output, the SS200 mixed drive found itself slightly better than average in the pack. The drive had an average score of 3,152.2 TPS with individual VMs running from 3,152.1 TPS to 3,152.3 TPS.
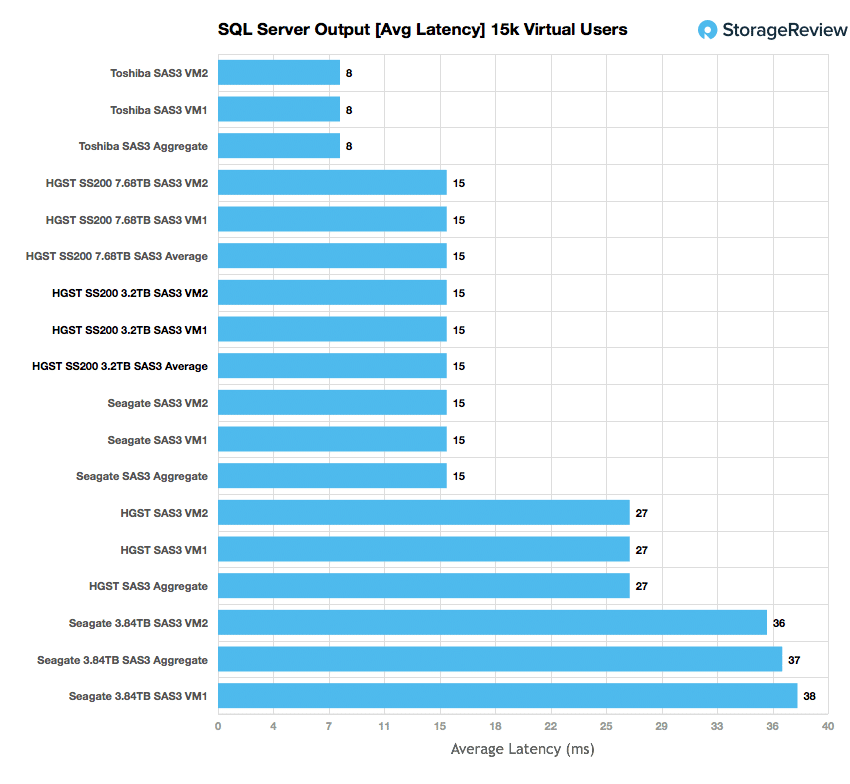
The average latency results during the 15k user SQL Server benchmark placed the SS200 mixed near the top with aggregate and individual VM latency of 15ms. This put it right inline with its read-intensive brother.
Sysbench Performance
The next application benchmark consists of a Percona MySQL OLTP database measured via SysBench. This test measures average TPS (Transactions Per Second), average latency, and average 99th percentile latency as well.
Each Sysbench VM is configured with three vDisks: one for boot (~92GB), one with the pre-built database (~447GB), and the third for the database under test (270GB). From a system resource perspective, we configured each VM with 16 vCPUs, 60GB of DRAM and leveraged the LSI Logic SAS SCSI controller.
Sysbench Testing Configuration (per VM)
- CentOS 6.3 64-bit
- Percona XtraDB 5.5.30-rel30.1
- Database Tables: 100
- Database Size: 10,000,000
- Database Threads: 32
- RAM Buffer: 24GB
- Test Length: 3 hours
- 2 hours preconditioning 32 threads
- 1 hour 32 threads
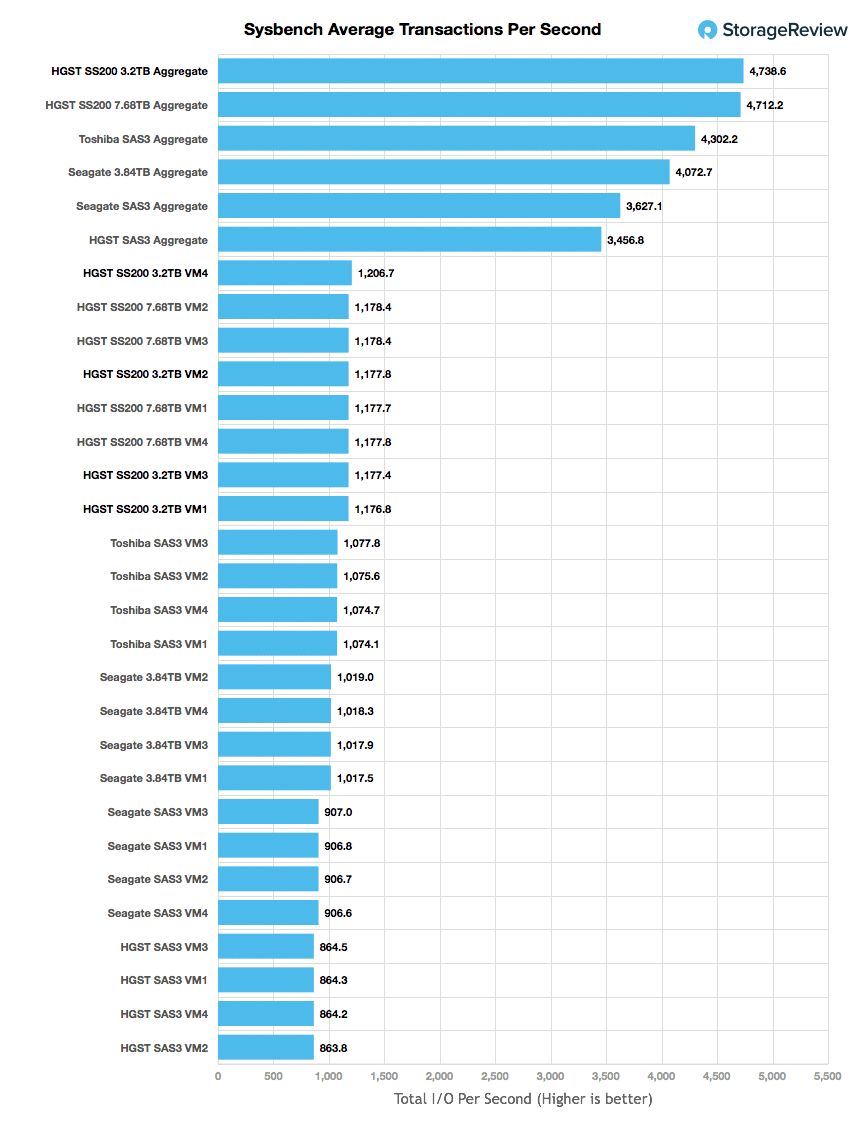
The SS200 mixed drive had the highest aggregate score just over its read-intensive brother, with 4,738.6 TPS. Individual VMs ran from 1,176.8 TPS to 1,206.7 TPS.
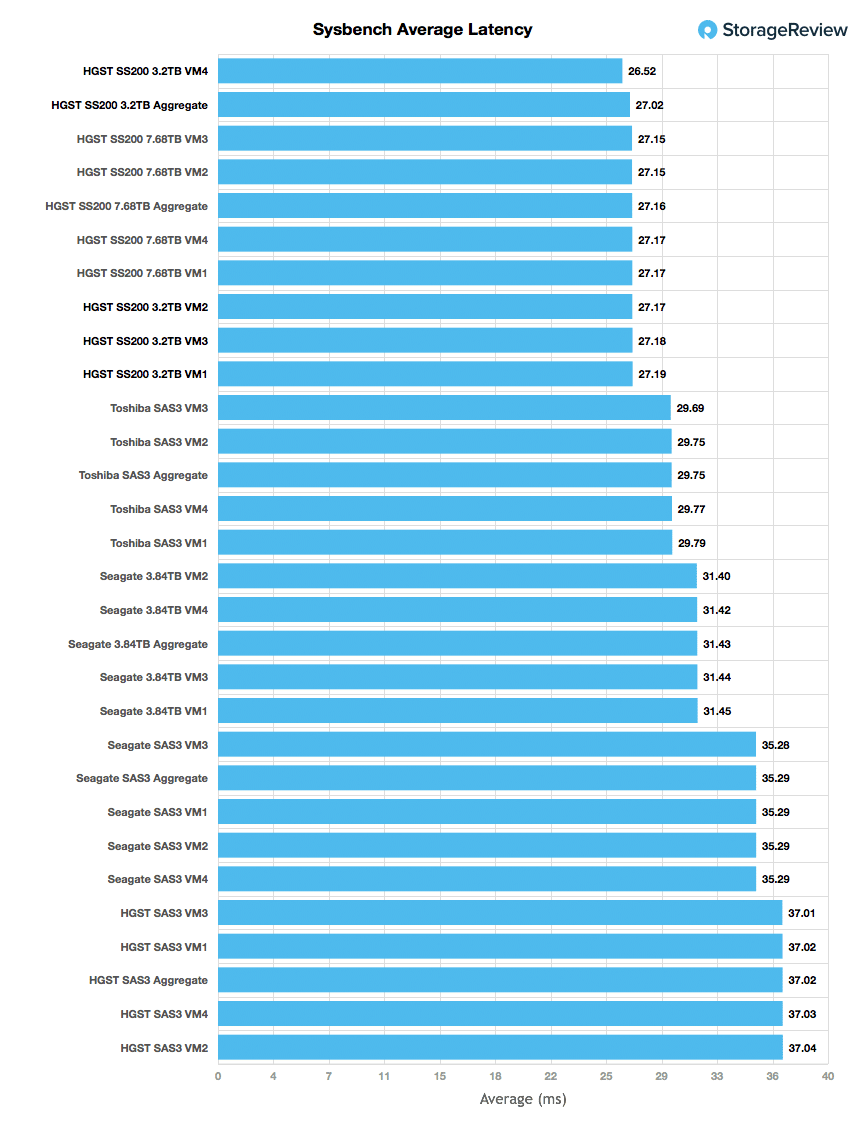
With average latency, again the SS200 mixed was the overall best performer with an aggregate score of 27.02ms and it had the best individual score of 26.52ms.
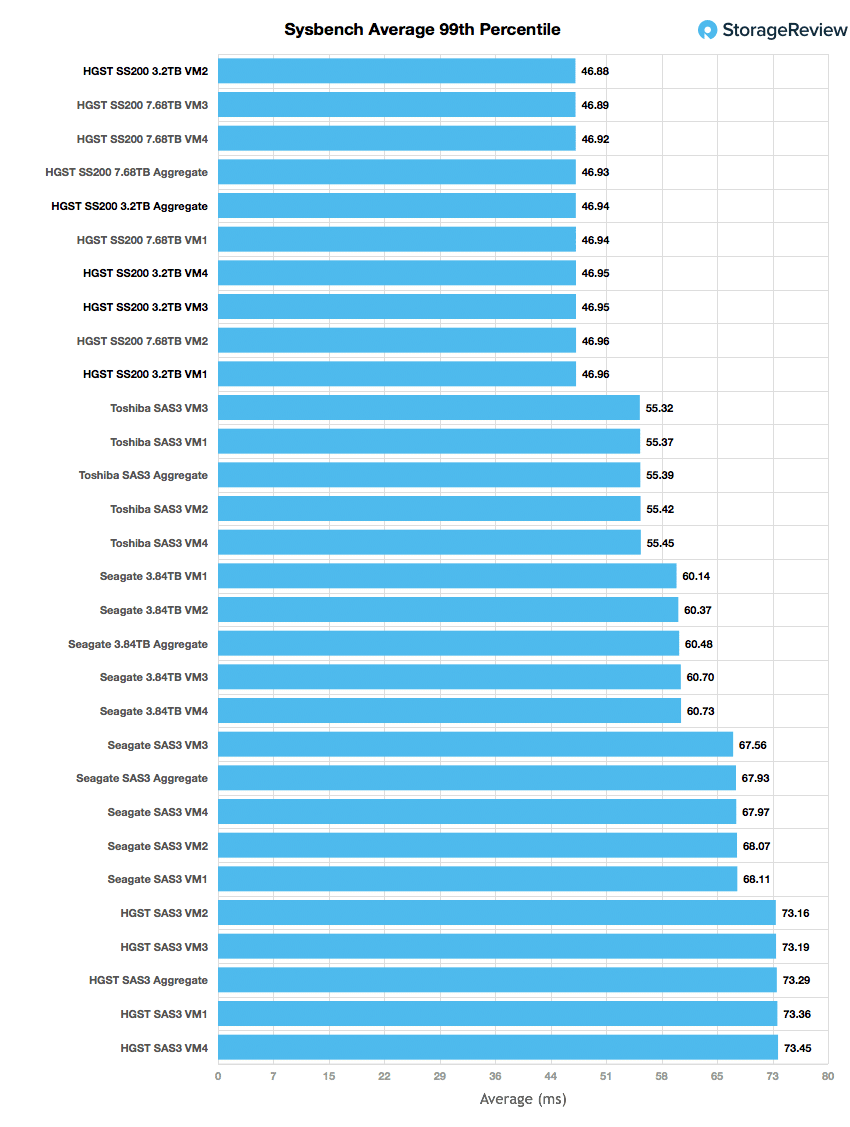
In terms of our worst-case MySQL latency scenario (99th percentile latency), the SS200 mixed placed just under its read-intensive brother with 46.94ms.
Conclusion
Looking at the performance, the HGST UltraStar SS200 offered strong performance across the board. In the SQL Server the drive placed above average in both the transactional benchmark as well as average latency. The drive had an aggregate score of 3,152.2 TPS and an average latency of 15ms. In our Sysbench tests the drive really shined with taking the top score in the transactional benchmark and average latency and second in our worst-case MySQL latency scenario (99th percentile latency) by a thousandth of a millisecond. The drive hit an aggregate score of 4,738.6 TPS, an average latency of 27.02ms, and a worst-case scenario latency of 46.94ms.
The Bottom Line
The mixed use case version of the HGST UltraStar SS200 brings plenty of performance and capacity to data centers wanting to expand their SAS flash footprint.


 Amazon