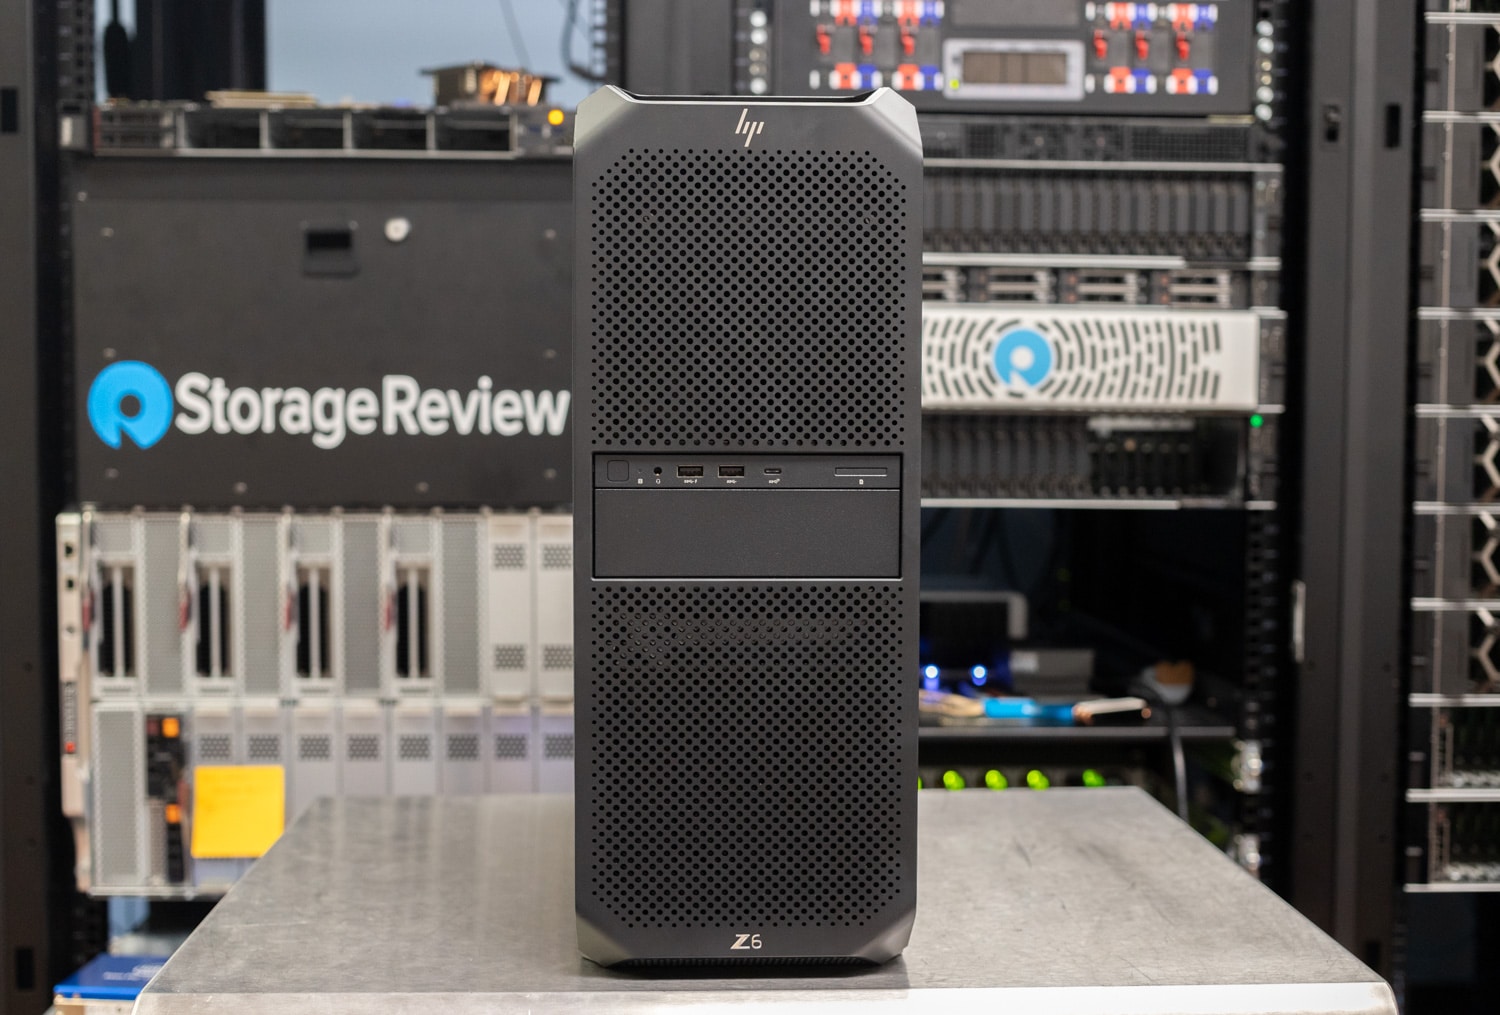
The HP Z6 G5 A is a desktop tower workstation with an AMD Ryzen Threadripper PRO CPU and room for three high-end GPUs. It can be configured with up to a 96-core CPU and 1TB of DDR5. The system is designed to be an absolute animal for modern professional workloads like rendering and AI.
The HP Z6 G5 A is a desktop tower workstation with an AMD Ryzen Threadripper PRO CPU and room for three high-end GPUs. It can be configured with up to a 96-core CPU and 1TB of DDR5. The system is designed to be an absolute animal for modern professional workloads like rendering and AI.
HP Z6 G5 A Specifications
We already reviewed the HP Z6 G5, so why are we reviewing it again? We’re not – this is the “A” version featuring AMD Ryzen Threadripper Pro processors. This is the first HP AMD workstation we’re testing.
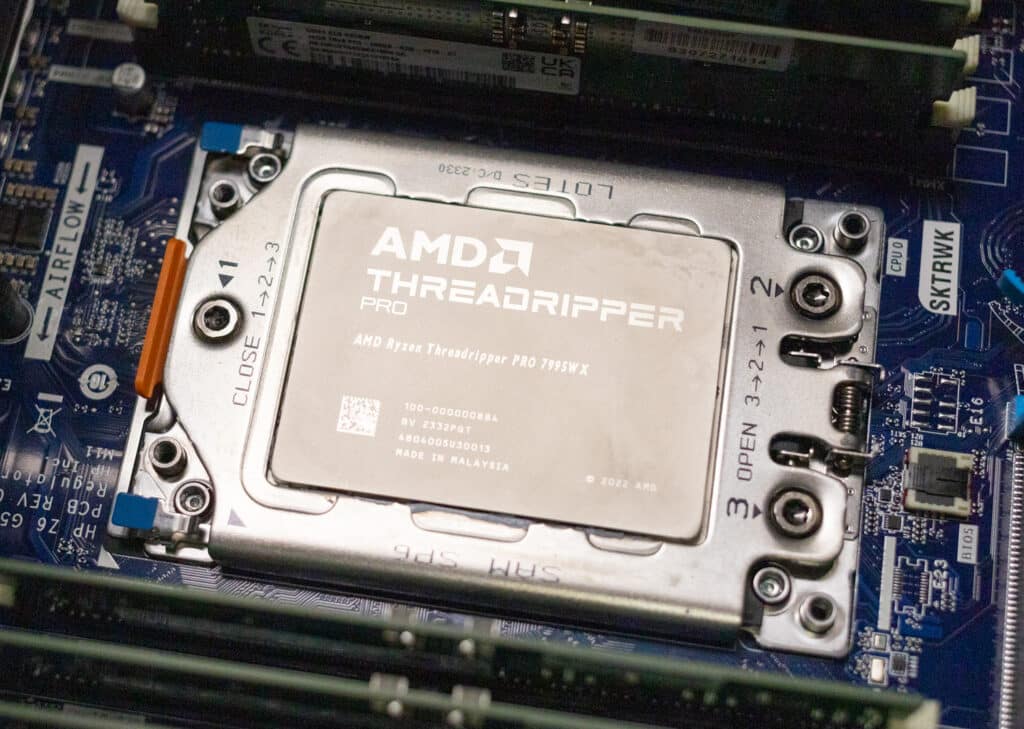
This workstation is defined by its Threadripper Pro CPU, available in up to 96 cores. (See our Dell Precision 7865 review and the launch news coverage for a rundown of what the Threadripper Pro 7000 series brings.) The CPU supports an incredible 128 PCIe lanes and 1TB of DDR5 ECC memory. As noted, this HP workstation also has room for three high-end GPUs.
Like other HP workstations, the Z6 G5 A is protected by HP’s Wolf Security for Business suite that operates at hardware and software levels. It also carries many Independent Software Vendor (ISV) certifications for creative and professional apps. (See HP’s site for a list.) HP designed the Z6 G5 A for a three-year lifecycle, designed to operate 24/7.
The Z6 G5 A’s full specifications are as follows:
| Operating Systems |
|
| Available Processors |
|
| Maximum Memory | 1TB DDR5-5600 ECC SDRAM up to 5200MT/s |
| Internal Storage |
|
| Optical Drive | HP Slim DVD-ROM; HP Slim Blu-ray Writer; HP Slim DVD-Writer |
| Available Graphics | Ultra High-End:
High-End:
Mid-Range:
|
| Audio | Realtek ALC3205-CG |
| Expansion Slots | 4 PCIe 5 x16; 2 PCIe 5 x4; 1 PCIe 4 x16; 3 PCIe 4 x4 (Rear bulkhead access can be achieved through all slots, but 2 PCIe 5 x4 and 2 PCIe 4 x4 are internal access only for M.2.) |
| Ports and Connectors | Front (Premium version): 1 USB Type-C® 20Gbps signaling rate; 2 USB Type-A 5Gbps signaling rate; 1 headphone/microphone combo ;
Front (Entry version): 4 USB Type-A 5Gbps signaling rate (1 charging); 1 headphone/microphone combo ; Rear: 1 audio-in/out; 6 USB Type-A 5Gbps signaling rate; 1 RJ-45 (1 GbE) ; Optional Ports: 2 Thunderbolt™ 4 with USB Type-C® 40Gbps signaling rate (USB Power Delivery, DisplayPort™ 1.4); Flex IO – choose one of the following options: 2 USB Type-A 5Gbps signaling rate, 1 USB Type-C® 10Gbps signaling rate, 1 serial, 1 HP 1 GbE LC fiber NIC, 1 HP 10 GBase-T NIC, 1 HP 1 GbE single-port NIC, 1 HP 2.5 GbE NIC |
| Communications | LAN:Intel® Ethernet Network Adapter I225-T1; HP dual-port 10GBase-T NIC; Intel® X550-T2 dual-port 10GbE NIC; NVIDIA®️ Mellanox ConnectX-6 DX Dual Port 10/25GbE
SFP28 NIC; Allied Telesis AT-2911T/2-901 dual-port 1GbE NIC; Allied Telesis AT-2914SX/LC PCIe Fiber NIC; HP 1 GbE LC Fiber Flex IO port; HP 10 GBASE-T Flex IO port; HP Flex IO 1 GbE single-port NIC; HP 2.5 GbE Flex IO port; Integrated Realtek 1 GbE LAN; WLAN:Intel® Wi-Fi 6E AX210 (2×2) and Bluetooth® 5.3 wireless card, non-vPro® with external antenna; MediaTek Wi-Fi 6 RZ616 (2×2) and Bluetooth® 5.3 wireless card with internal antenna |
| Software |
|
| Security Management |
|
| Security Software Licenses | HP Wolf Pro Security Edition |
| Management Features | HP Driver Packs; HP System Software Manager (download); HP BIOS Configuration Utility (download); HP Smart Support |
| Power | 1450 W internal power supply, up to 90% efficiency, active PFC; 1125 W internal power supply, up to 90% efficiency, active PFC; 775 W internal power supply, up to 90% efficiency, active PFC |
| Dimensions | 6.65 x 18.3 x 17.5 in; 16.9 x 46.5 x 44.5 cm |
| Weight | Starting at 29.1 lb; Starting at 13.2 kg; (Exact weight depends on configuration.) |
| Ecolabels | EPEAT® registered configurations available; TCO Certified configurations available |
| Energy Star Certified | ENERGY STAR® certified (configurations available) |
| Sustainable Impact Specifications | 40% post-consumer recycled plastic; 25% ITE-derived closed loop plastic; Bulk packaging available; Plastic cushion inserts contain 80% recycled content; Molded paper pulp cushion inside the box is 100% sustainably sourced and recyclable; 10% post-consumer recycled plastic; Internal power supply 90% efficiency; Ocean-bound plastic in system and CPU fans |
HP Z6 G5 A Build and Design
The all-black Z6 G5 A looks professional and nondescript, with only HP’s Z logo on the side door indicating a high-performance machine. This tower is larger than a typical mid-tower, at 6.65 by 18.3 by 17.5 inches, with a starting weight of 29.1 pounds.
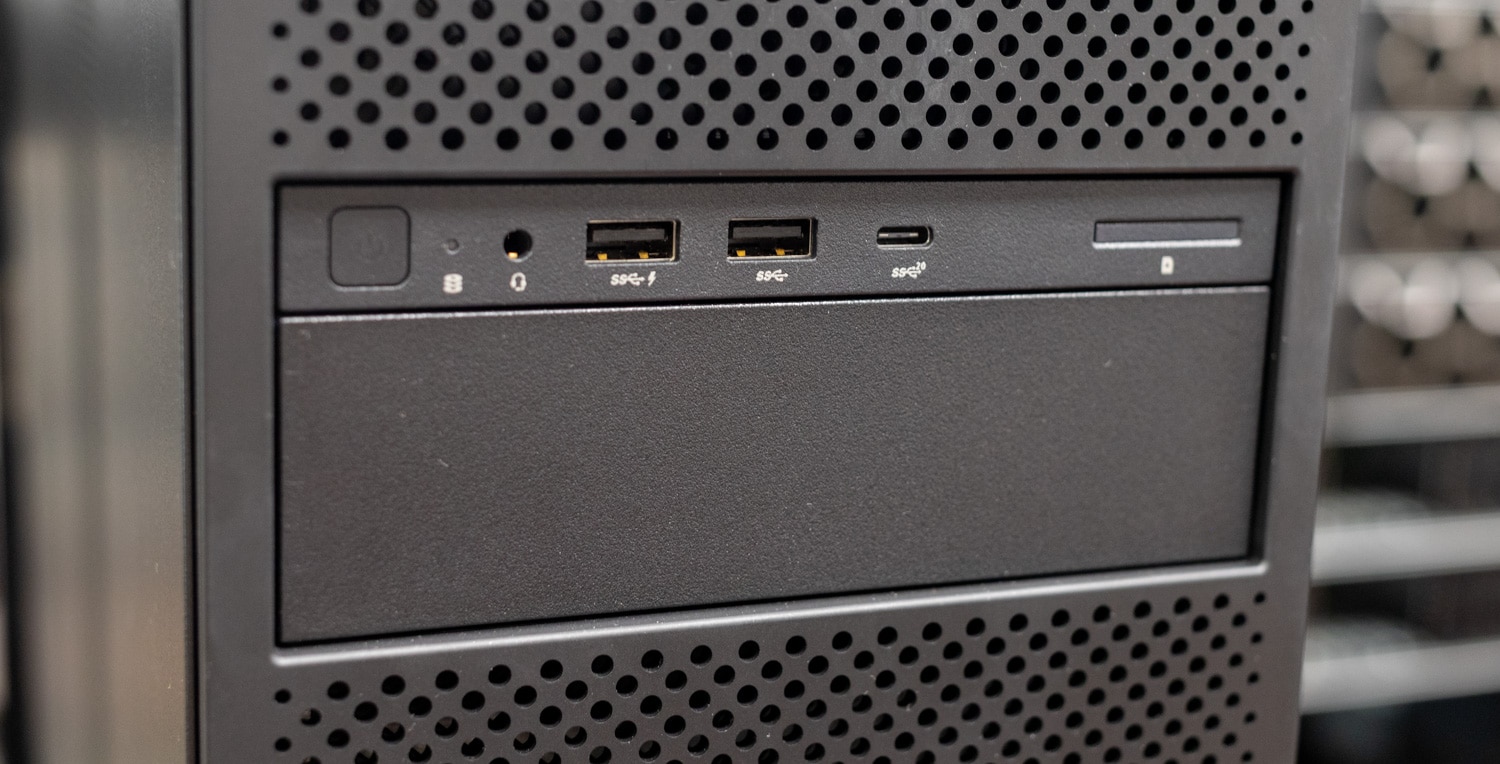
Front connectivity on the premium model we’re reviewing includes a combo audio jack (headphone/microphone), two 5Gbps USB-A ports (one supporting charging when the tower is powered off), one 20Gbps USB-C, and an optional media card reader that isn’t present on our unit.
We don’t have the optional 5.25-inch bay device that supports four M.2 drives, which would be very handy for quickly swapping large amounts of sensitive data or protecting privacy. (The drives could be removed and securely stored.) This also reminds us that we really want to see these premium workstations offering enterprise storage options, but we digress.
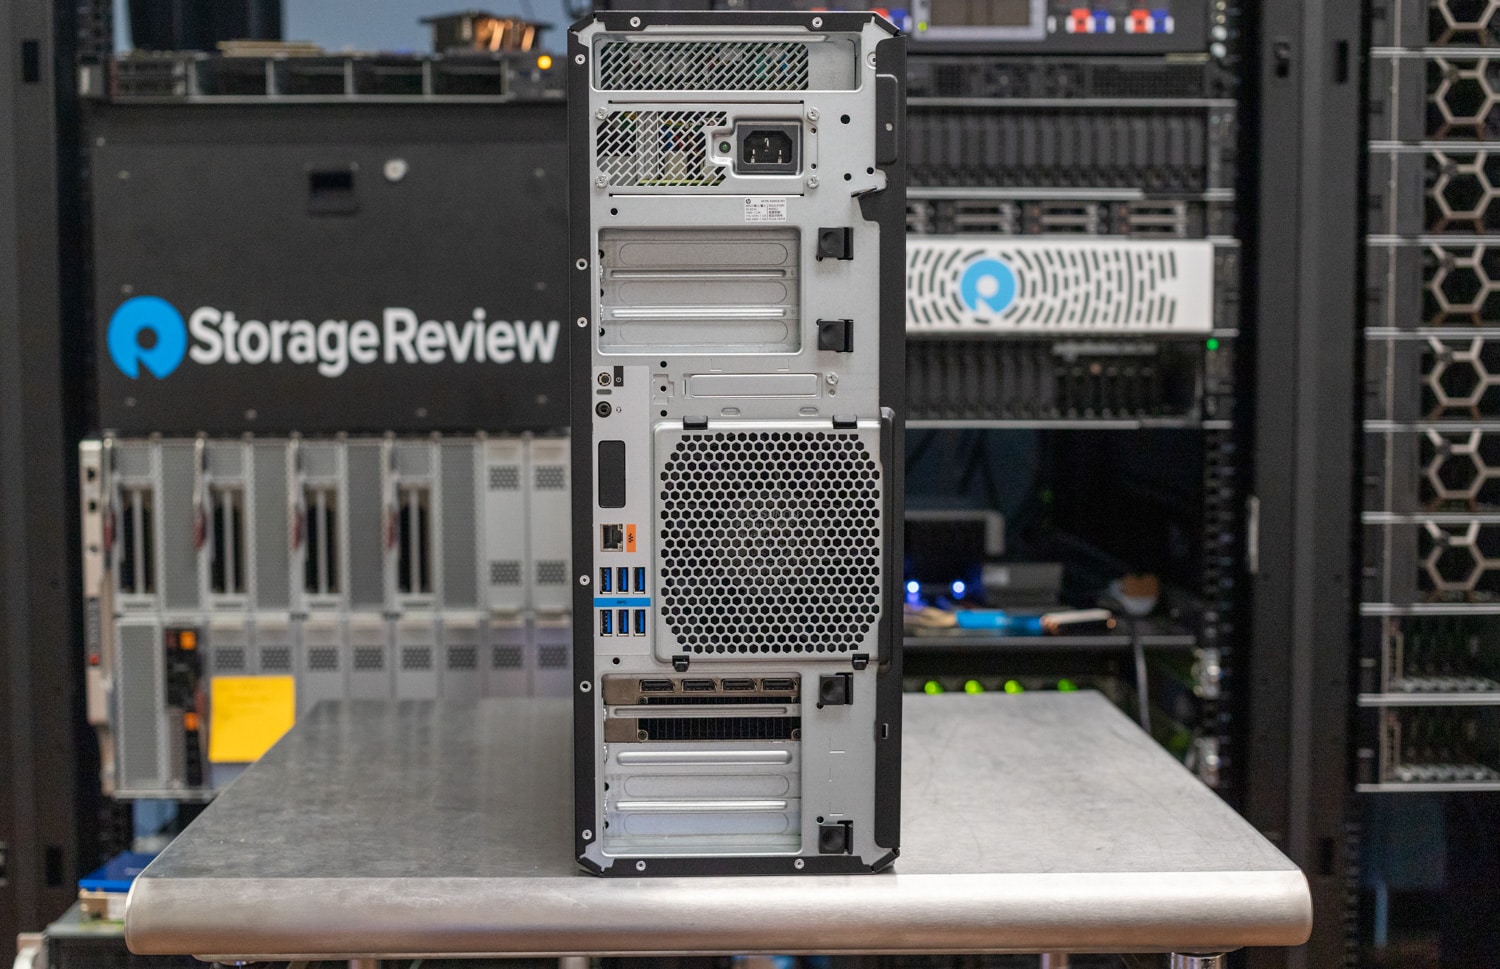
Meanwhile, rear connectivity includes six 5Gbps USB-A ports, a line-out audio jack, one 1GbE Ethernet, and, optionally, two 10GbE. There are power buttons on the front and back of the tower. HP offers many add-in networking cards for additional connectivity.
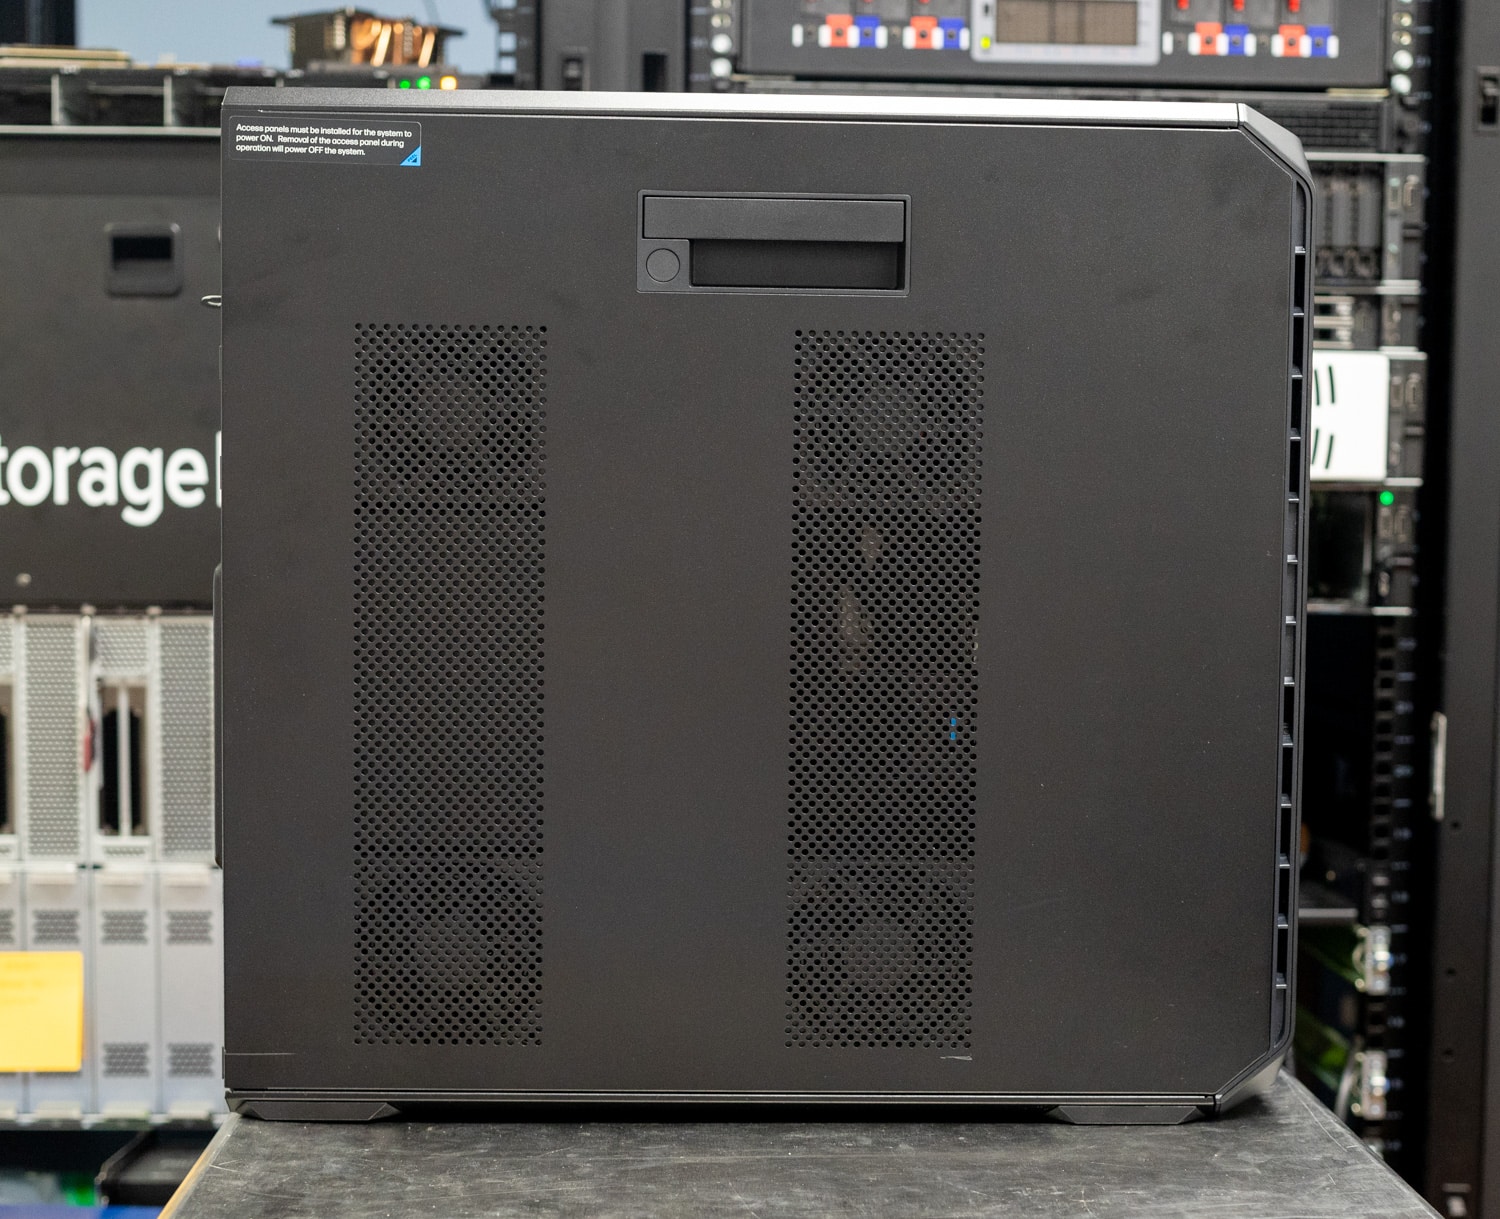
The Z6 G5 A has toolless interior access. The perforated side panel is a not-so-subtle hint that this tower has lots of airflow.
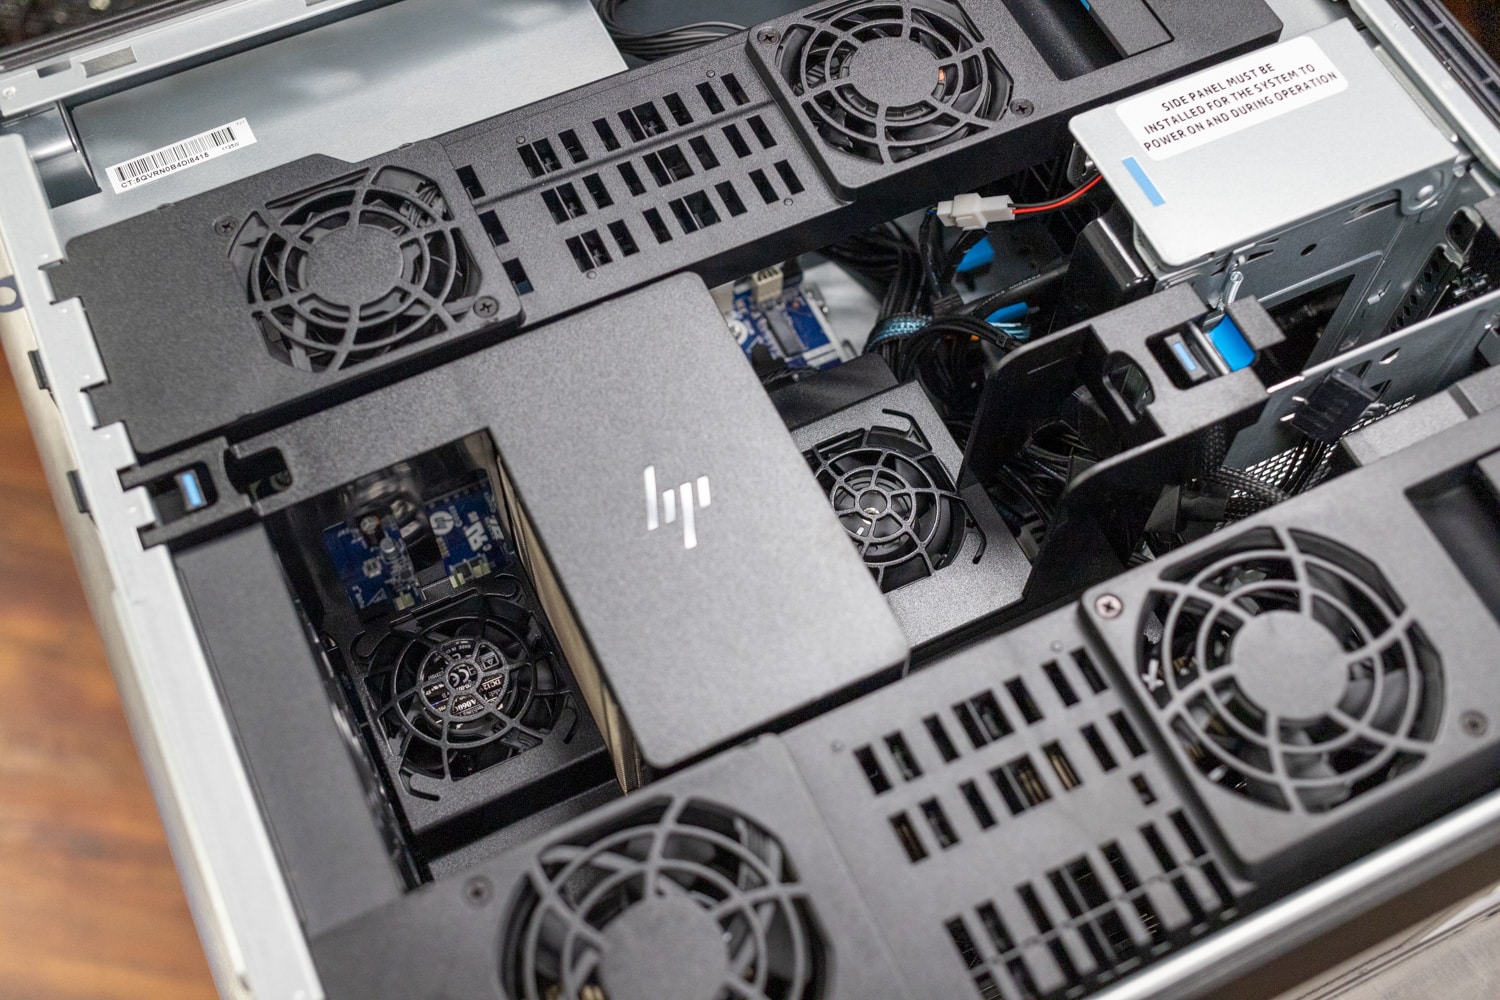
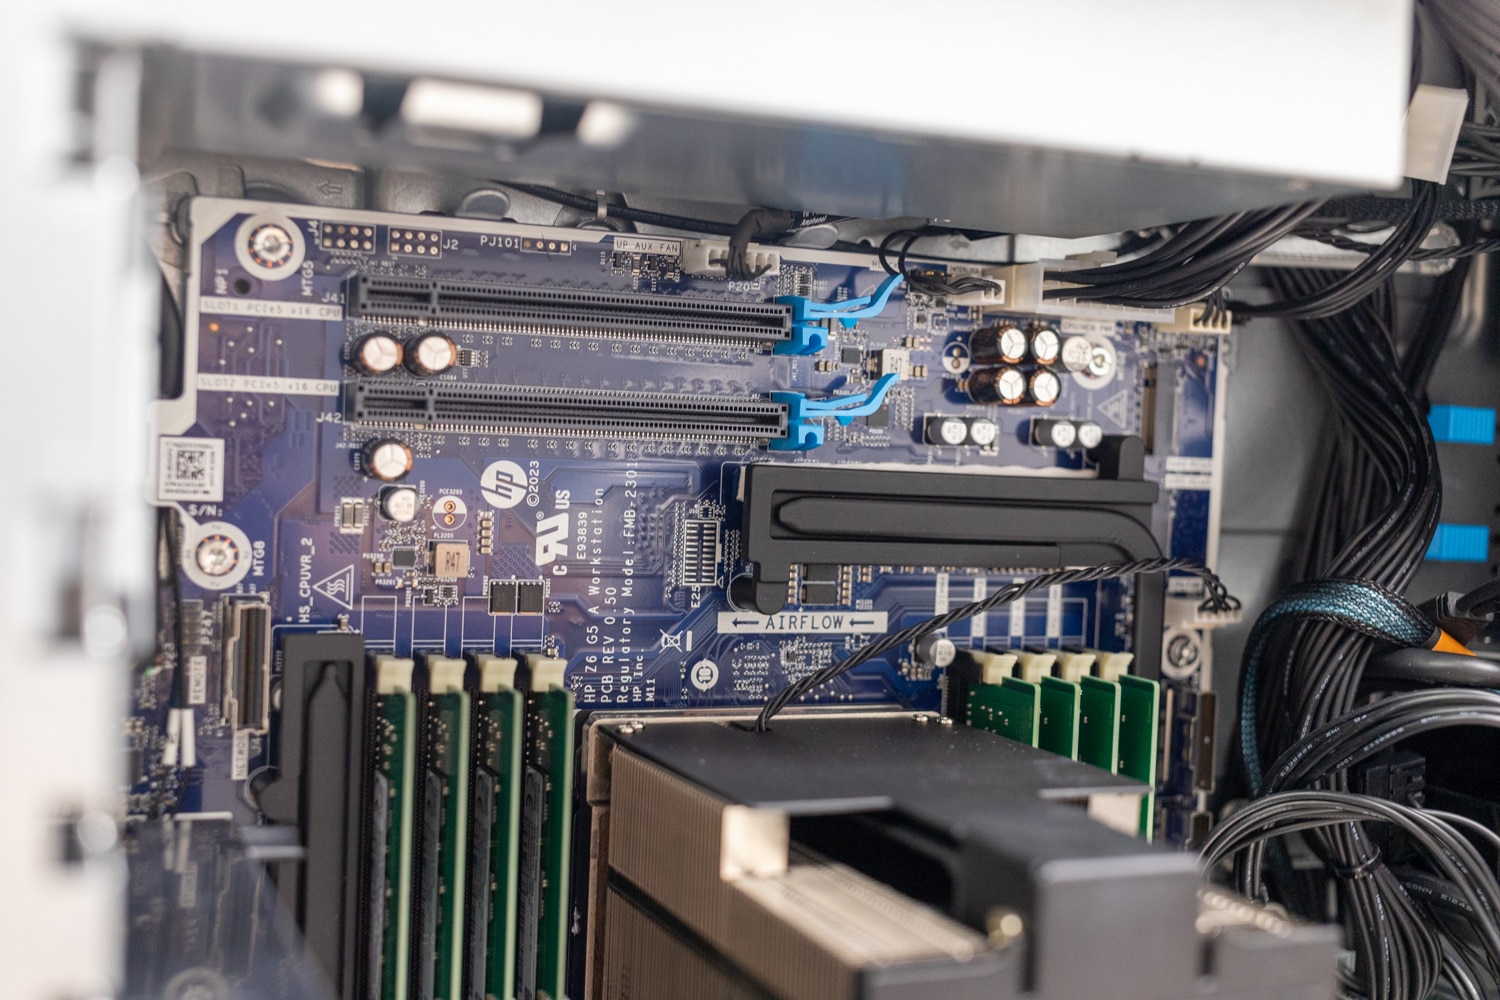
At first glance, most of the interior is shrouded in airflow guides and fan supports. HP uses ocean-bound plastics for sustainability. This photo shows the active cooling solutions over the expansion slots. The eight DIMM slots flanking the tall CPU air cooler also enjoy active cooling.
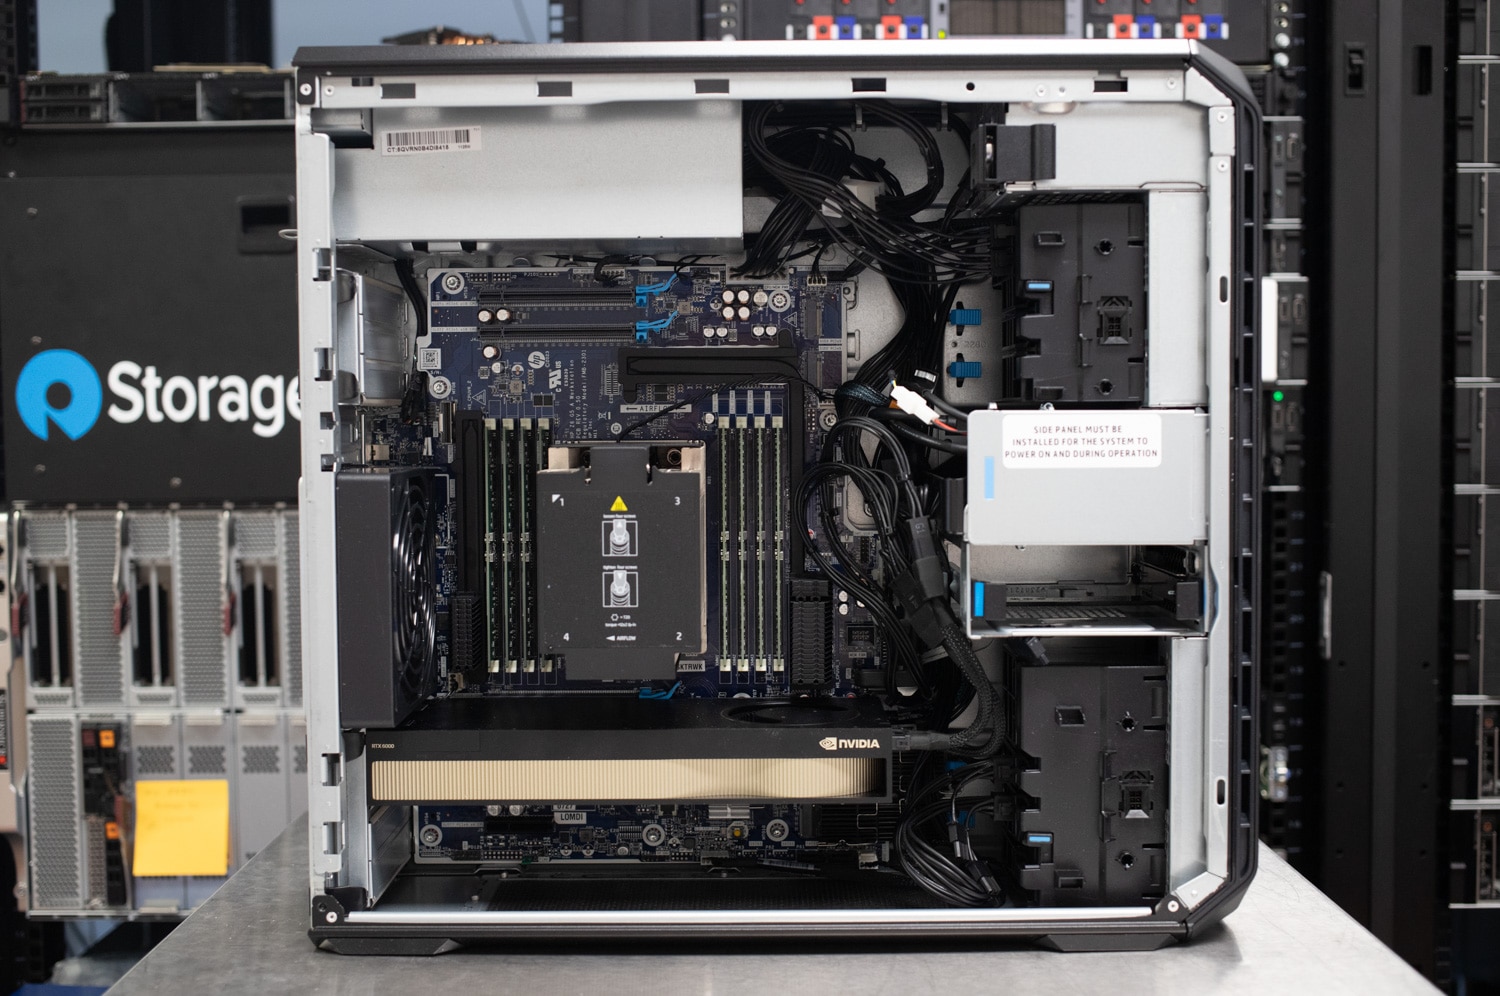
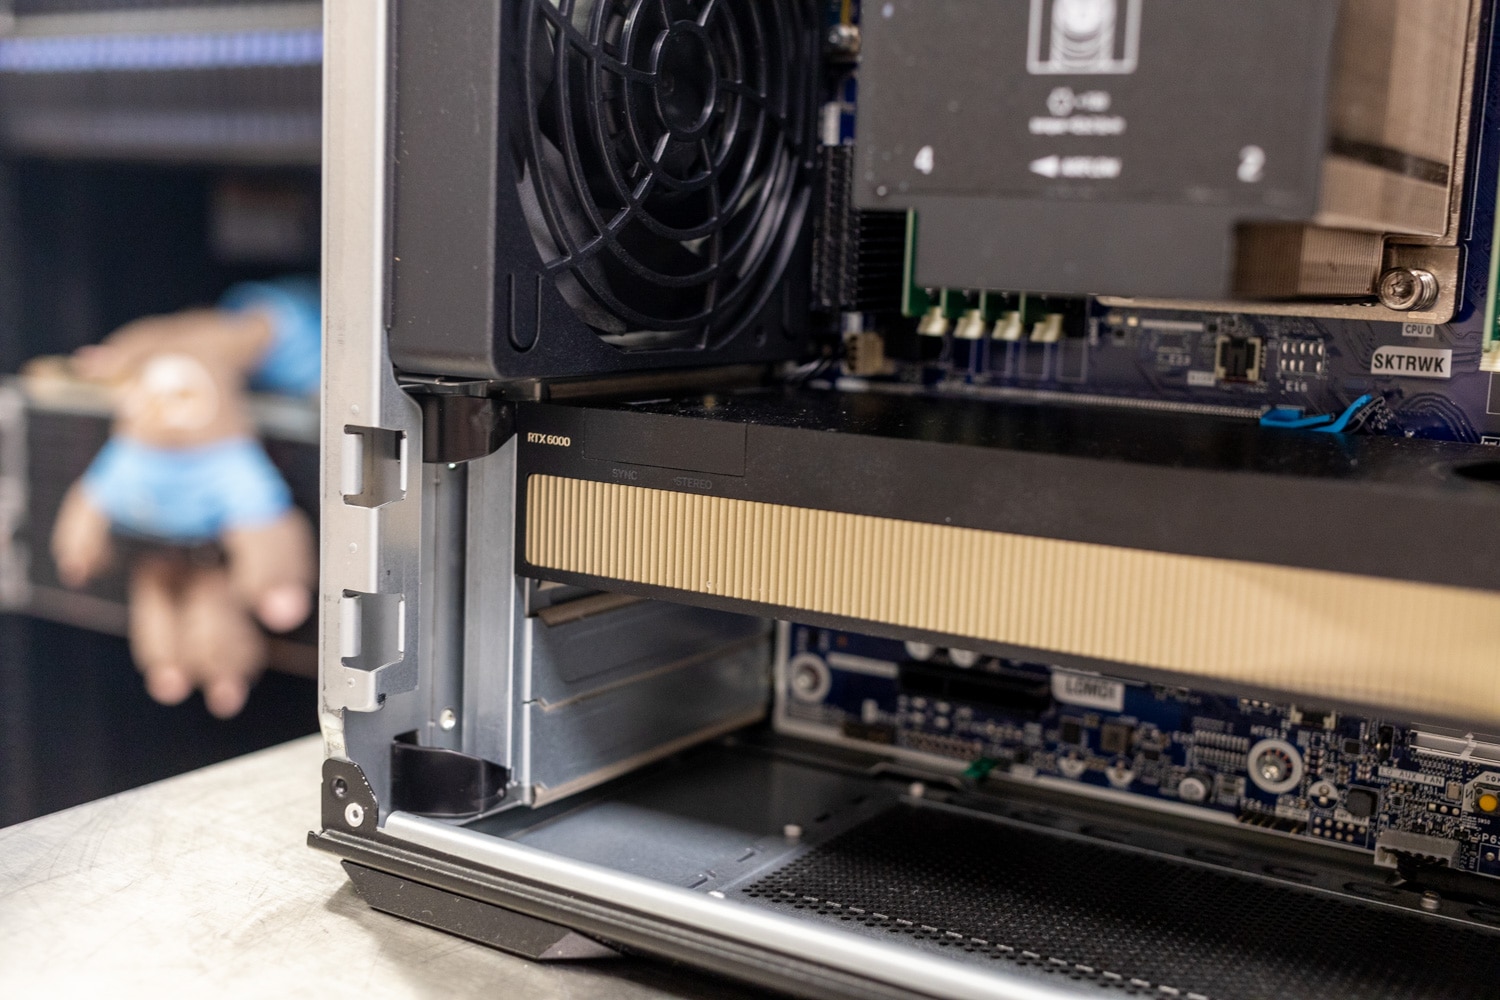
All the blue tabs are release switches or buttons you can use without tools. The motherboard has six PCIe expansion slots, one of which we’ve occupied with an NVIDIA RTX 6000 Ada Generation that we added.
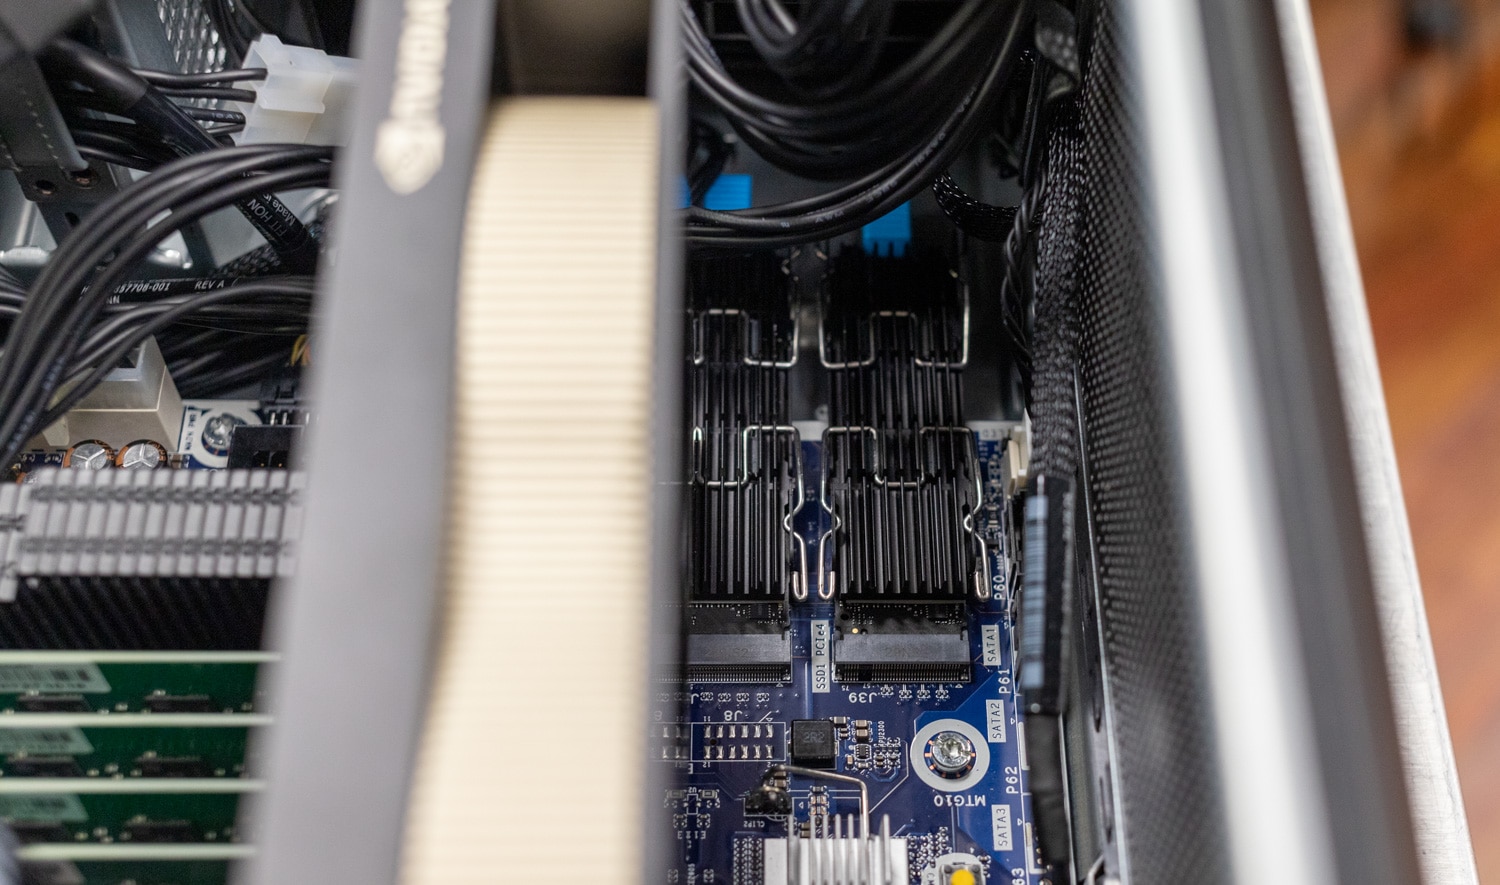
The motherboard’s two M.2 SSD slots are just under the GPU; they’re properly covered with metal heatsinks.
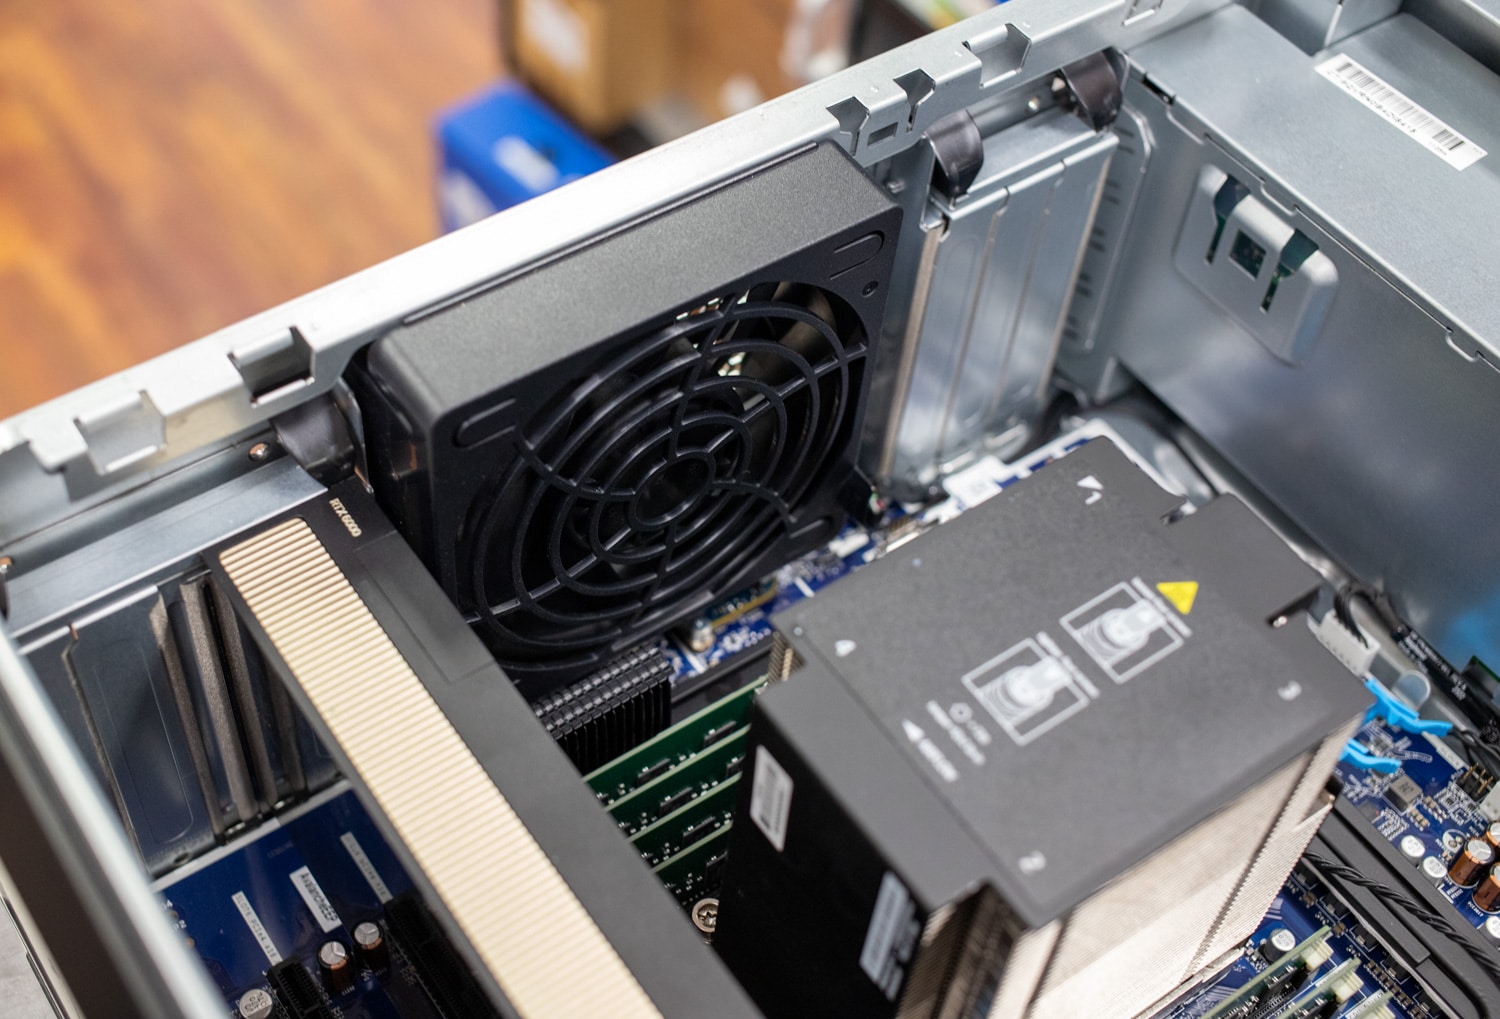
Here’s another view of the CPU air cooler and the 120mm rear exhaust fan.
The motherboard has six PCIe slots and eight DIMM slots. Overall, the interior is cleanly laid out and should be easy to service.
HP Z6 G5 A Performance
We’re reviewing the Z6 G5 A with the following specifications:
- Windows 11 for Workstations
- AMD Threadripper PRO 7995WX (96 cores)
- NVIDIA RTA 6000 Ada Generation
- 128GB DDR5-5600
- 2x 1TB Gen4 drives
This exceptional configuration maxes out the CPU, though there’s room for more RAM (up to 1TB) and two more high-end GPUs. Storage drive configuration options are also numerous, though they’ll naturally be restricted by the number of high-end GPUs.
We will compare the Z6 G5 A to the Dell Precision 7960 configured with Intel’s flagship 56-core Xeon w9-3495X CPU, 128GB of RAM, and an RTX 6000 Ada. The 7960 also used the same GPU model, which is useful in the GPU performance comparisons. If all cores and threads are used, our Z6 G5 A should have no trouble outclassing it on the CPU front. We considered comparing the HP to the Dell Precision 7865 but left it out since we couldn’t test that machine under the same conditions as our usual reviews, our work in that review was all remote.
SPECworkstation 3
SPECworkstation3 specializes in benchmarks designed for testing all key aspects of workstation performance; it uses over 30 workloads to test CPU, graphics, I/O, and memory bandwidth. The workloads fall into broader categories such as Media and Entertainment, Financial Services, Product Development, Energy, Life Sciences, and General Operations. We will list the broad-category results for each instead of the individual workloads. The results are an average of all the individual workloads in each category.
We only have results for the Z6 G5 A in this first test.
| SPECworkstation 3 (Higher is better) | HP Z6 G5 A (Threadripper Pro 7995WX, RTX 6000 Ada) |
| Media and Entertainment | 9.4 |
| Product Development | 11.91 |
| Life Sciences | 16.21 |
| Financial Services | 29.32 |
| Energy | N/A |
| General Operations | 3.56 |
| GPU Compute | 10.99 |
SPECviewperf 2020
Our first test is SPECviewperf 2020, the worldwide standard for measuring graphics performance of professional applications under the OpenGL and Direct X application programming interfaces. The viewsets (or benchmarks) represent graphics content and behavior from actual applications without having to install the applications themselves. The newest version of this benchmark went through significant updates late last year, including new viewsets taken from traces of the latest versions of 3ds Max, Catia, Maya, and Solidworks applications. In addition, they added support within all viewsets for both 2K and 4K resolution displays.
The results are close throughout, with the Z6 G5 A and the Precision 7960 occasionally trading blows and one-upping each other.
| SPECviewperf2020 Viewsets (Higher is better) | HP Z6 G5 A (Threadripper Pro 7995WX, RTX 6000 Ada) | Dell Precision 7960 (Xeon w9-3495X, RTX 6000 Ada) |
| 3dsmax-07 | 214.1 | 218.62 |
| Catia-06 | 138.21 | 114.68 |
| Creo-03 | 181.24 | 128.74 |
| Energy-03 | 87.03 | 84.46 |
| Maya-06 | 573.38 | 424.08 |
| Medical-03 | 131.97 | 74.16 |
| Snx-04 | 993.48 | 932.85 |
| Solidworks-05 | 301.27 | 299.69 |
Blender OptiX
Blender is an open-source 3D modeling application. This benchmark was run using the Blender Benchmark utility. The score is samples per minute, with higher being better. Being GPU-bound, it’s no surprise that the HP and Dell were closely matched here.
| Blender OptiX (Samples per minute, Higher is better) | HP Z6 G5 A (Threadripper Pro 7995WX, RTX 6000 Ada) | Dell Precision 7960 (Xeon w9-3495X, RTX 6000 Ada) |
| Monster | 6,753.6 | 6,709.2 |
| Junkshop | 3,155.86 | 3,165.5 |
| Classroom | 3,162.94 | 3,176.0 |
Luxmark
Another 3D benchmark we will look at is LuxMark, an OpenCL GPU benchmarking utility. The HP and Dell also finished closely as expected.
| Luxmark (Higher is better) | HP Z6 G5 A (Threadripper Pro 7995WX, RTX 6000 Ada) | Dell Precision 7960 (Xeon w9-3495X, RTX 6000 Ada) |
| Hallbench | 32,102 | 31,731 |
| food | 14,530 | 13,471 |
ESRI
Next up is the Environmental Systems Research Institute (Esri) benchmark. Esri is a supplier of Geographic Information System (GIS) software. Esri’s Performance Team designed their PerfTool add-in scripts to launch the ArcGIS Pro automatically. This application uses a “ZoomToBookmarks” function to browse various predefined bookmarks and create a log file with all the key data points required to predict the user experience. The script automatically loops the bookmarks three times to account for caching (memory and disk cache). In other words, this benchmark simulates heavy graphical use that one might see through Esri’s ArcGIS Pro software.
The tests consist of three main datasets. Two are 3-D city views of Philadelphia, PA, and Montreal, QC. These city views contain textured 3-D multipatch buildings draped on a terrain model and draped aerial images. The third dataset is a 2-D map view of the Portland, OR region. This data contains detailed information for roads, land use parcels, parks and schools, rivers, lakes, and hill-shaded terrain.
The GPU-limited Montreal and Philly models saw the HP and Dell finishing similarly, though the HP did better in the CPU-driven Portland model.
First up is the Montreal model.
| ESRI ArcGIS Pro 2.3 Montreal | |
| Average FPS | Average |
| HP Z6 G5 A (Threadripper Pro 7995WX, RTX 6000 Ada) | 809.6 |
| Dell Precision 7960 (Xeon w9-3495X, RTX 6000 Ada) | 809.9 |
| Minimum FPS | Average |
| HP Z6 G5 A (Threadripper Pro 7995WX, RTX 6000 Ada) | 352.8 |
| Dell Precision 7960 (Xeon w9-3495X, RTX 6000 Ada) | 345.5 |
Next up is Philly.
| ESRI ArcGIS Pro 2.3 Philly | |
| Average FPS | Average |
| HP Z6 G5 A (Threadripper Pro 7995WX, RTX 6000 Ada) | 616.6 |
| Dell Precision 7960 (Xeon w9-3495X, RTX 6000 Ada) | 603.8 |
| Minimum FPS | Average |
| HP Z6 G5 A (Threadripper Pro 7995WX, RTX 6000 Ada) | 318.1 |
| Dell Precision 7960 (Xeon w9-3495X, RTX 6000 Ada) | 321.1 |
Last is the Portland model.
| ESRI ArcGIS Pro 2.3 Portland | |
| Average FPS | Average |
| HP Z6 G5 A (Threadripper Pro 7995WX, RTX 6000 Ada) | 2,449.9 |
| Dell Precision 7960 (Xeon w9-3495X, RTX 6000 Ada) | 2,172.2 |
| Minimum FPS | Average |
| HP Z6 G5 A (Threadripper Pro 7995WX, RTX 6000 Ada) | 1,179.1 |
| Dell Precision 7960 (Xeon w9-3495X, RTX 6000 Ada) | 1,270.4 |
OctaneBench
Next, we look at OctaneBench, a benchmarking utility for OctaneRender, another 3D renderer with RTX support similar to V-Ray. The numbers remained close, but the HP had a slight edge throughout.
| OctaneBench (Score, higher is better) | Kernel | HP Z6 G5 A (Threadripper Pro 7995WX, RTX 6000 Ada) | Dell Precision 7960 (Xeon w9-3495X, RTX 6000 Ada) |
| Interior | Info channels | 45.22 | 42.64 |
| Interior | Direct lighting | 133.27 | 125.49 |
| Interior | Path tracing | 165.17 | 156.94 |
| Idea | Info channels | 27.06 | 24.40 |
| Idea | Direct lighting | 105.30 | 99.20 |
| Idea | Path tracing | 125.42 | 118.34 |
| ATV | Info channels | 70.72 | 67.51 |
| ATV | Direct lighting | 132.51 | 127.96 |
| ATV | Path tracing | 167.51 | 161.16 |
| Box | Info channels | 36.43 | 34.24 |
| Box | Direct lighting | 124.41 | 119.04 |
| Box | Path tracing | 135.52 | 130.36 |
Blackmagic RAW Speed Test
We have also started running Blackmagic’s RAW speed test, which tests video playback. The HP had the edge on the CPU side, but the Dell finished ahead in the GPU portion.
| Blackmagic RAW Speed Test (Higher is better) | HP Z6 G5 A (Threadripper Pro 7995WX, RTX 6000 Ada) | Dell Precision 7960 (Xeon w9-3495X, RTX 6000 Ada) |
| 8K CPU | 143 fps | 124 fps |
| 8K CUDA | 182 fps | 194 fps |
7-Zip Compression
The built-in memory benchmark in the popular 7-Zip utility is our next test. The HP’s 96-core Threadripper Pro and eight-channel RAM dominated this test, especially evident in the decompression numbers.
| 7-Zip Compression Benchmark (Higher is better) | HP Z6 G5 A (Threadripper Pro 7995WX, RTX 6000 Ada) | Dell Precision 7960 (Xeon w9-3495X, RTX 6000 Ada) |
| Current CPU Usage | 3,321% | 3,279% |
| Current Rating/Usage | 9.752 GIPS | 6.917 GIPS |
| Current Rating | 323.905 GIPS | 226.810 GIPS |
| Resulting CPU Usage | 3,321% | 3,316% |
| Resulting Rating/Usage | 9.714 GIPS | 6.934 GIPS |
| Resulting Rating | 322.627 GIPS | 229.905 GIPS |
| Decompressing | ||
| Current CPU Usage | 6,113% | 6,106% |
| Current Rating/Usage | 5.784 GIPS | 3.760 GIPS |
| Current Rating | 353.596 GIPS | 229.591 GIPS |
| Resulting CPU Usage | 6,121% | 5,860% |
| Resulting Rating/Usage | 5.724 GIPS | 2.954 GIPS |
| Resulting Rating | 350.375 GIPS | 231.485 GIPS |
| Total Rating | ||
| Total CPU Usage | 4,721% | 4,588% |
| Total Rating/Usage | 7.719 GIPS | 5.444 GIPS |
| Total Rating | 336.501 GIPS | 230.695 GIPS |
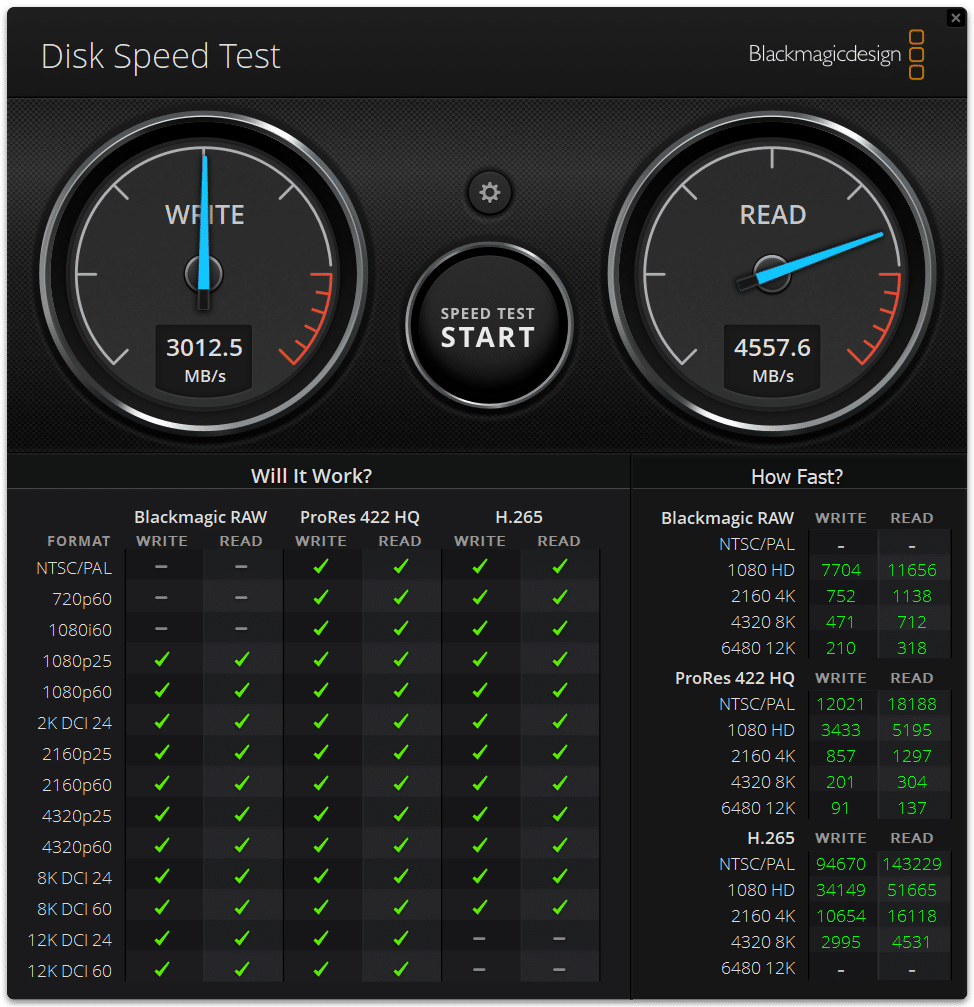
Blackmagic Disk Speed Test
We run the popular Blackmagic Disk Speed Test against the system’s primary storage drive.
UL Procyon AI Inference
UL’s Procyon estimates a workstation’s performance for professional apps. The numbers indicate this testing runs much slower on the CPU, but Dell’s Xeon chip often proved faster, especially in the Real-ESRGAN subtest.
| UL Procyon Average Inference Times (Lower is better) | HP Z6 G5 A (RTX 6000 Ada) – Tensor RT | HP Z6 G5 A (RTX 6000 Ada) – Windows ML | HP Z6 G5 A (Threadripper Pro 7995WX) | Dell Precision 7960 (RTX 6000 Ada) – Tensor RT | Dell Precision 7960 (RTX 6000 Ada) – Windows ML | Dell Precision 7960 (Xeon w9-3495X) |
| MobileNet V3 | 0.42 | 0.51 | 3.57 | 0.59 | 0.54 | 2.22 |
| ResNet 50 | 1.06 | 0.94 | 6.25 | 0.99 | 0.95 | 6.27 |
| Inception V4 | 3.37 | 2.28 | 25.43 | 3.42 | 2.32 | 29.41 |
| DeepLab V3 | 2.78 | 13.46 | 25.25 | 2.95 | 26.87 | 24.27 |
| YOLO V3 | 2.71 | 4.04 | 33.37 | 2.68 | 5.34 | 37.83 |
| Real-ESRGAN | 83.80 | 85.73 | 2,891.39 | 84.15 | 86.18 | 1,527.68 |
| Overall Score | 1,597 | 1,204 | 149 | 1,506 | 1,009 | 173 |
UL 3DMark
We recently started running the consumer 3DMark benchmark on workstations to gauge GPU performance. We only have results for the Z6 G5 A in these tests.
| UL 3DMark (Higher is better) | HP Z6 G5 A (Threadripper Pro 7995WX, RTX 6000 Ada) |
| Speedway | 7,929 |
| Port Royal | 18,431 |
| Time Spy | 9,667 |
| Time Spy Extreme | 10,725 |
| Fire Strike Extreme | 26,242 |
| Fire Strike Ultra | 19,419 |
y-cruncher
y-cruncher is a multi-threaded and scalable program that can compute Pi and other mathematical constants to trillions of digits. Since its launch in 2009, it has become a popular benchmarking and stress-testing application for overclockers and hardware enthusiasts. The HP’s 96-core Threadripper Pro chip dominated here.
| y-cruncher (Total Computation time) | HP Z6 G5 A (Threadripper Pro 7995WX, RTX 6000 Ada) | Dell Precision 7960 (Xeon w9-3495X, RTX 6000 Ada) |
| 1 billion digits | 8.436 seconds | 12.788 seconds |
| 2.5 billion digits | 18.835 seconds | 34.459 seconds |
| 10 billion digits | 72.856 seconds | 157.770 seconds |
Geekbench 6
Geekbench 6 is a cross-platform benchmark that measures overall system performance. You can find comparisons to any system you want in the Geekbench Browser. The HP continued to lead with its 96-core Xeon even in the single-threaded test, where we might have expected the Dell’s Xeon to keep up.
| Geekbench 6 (Higher is better) | HP Z6 G5 A (Threadripper Pro 7995WX, RTX 6000 Ada) | Dell Precision 7960 (Xeon w9-3495X, RTX 6000 Ada) |
| CPU Single-Core | 2,655 | 2,302 |
| CPU Multi-Core | 24,519 | 18,157 |
| GPU | 319,290 | 303,158 |
Cinebench R23
This benchmark uses all CPU cores and threads to generate an overall score. The single-core results were close, but the multi-core score shows that HP’s 96-core CPU is unbeatable when unleashed.
| Cinebench R23 (Higher is better) | HP Z6 G5 A (Threadripper Pro 7995WX, RTX 6000 Ada) | Dell Precision 7960 (Xeon w9-3495X, RTX 6000 Ada) |
| Multi-Core | 100,562 | 58,774 |
| Single-Core | 1,709 | 1,689 |
Cinebench R24
We also started running the latest Cinebench test. We only have numbers for the Z6 G5 A.
| Cinebench R23 (Higher is better) | HP Z6 G5 A (Threadripper Pro 7995WX, RTX 6000 Ada) |
| Multi-Core | 5,683 |
| Single-Core | 102 |
| GPU | 31,457 |
GPUPI 3.3.3
Our last test is the GPUPI compute benchmark; it calculates pi to one billion decimals. The Z6 G5 A finished the test with a calculation + reduction time of 69.650 seconds + 6.445 seconds.
Conclusion
AMD’s latest Threadripper Pro 7000WX series processor is an impressive performer inside HP’s Z6 G5 A. This tower workstation is unstoppable for nearly any task, as we reviewed it with a 96-core Threadripper Pro 7995WX. Loading it up with 1TB of memory and three high-end GPUs means it can tackle almost any conceivable workload, including those typically destined for servers.
We like nearly everything about this workstation beyond its performance, especially its built-in security features, toolless component access, and almost limitless configuration options. The HP Z6 G5 A gets our highest recommendation for a high-end tower workstation and is an easy selection for “Best of 2023.”
Engage with StorageReview
Newsletter | YouTube | Podcast iTunes/Spotify | Instagram | Twitter | TikTok | RSS Feed

