Back in March, AMD released their latest generation of AMD EPYC 7003 processors. The same day several vendors were quick to follow suit, including HPE who launched several server updates. Headlining the updated servers announced is the HPE ProLiant DL365 Gen10 Plus, a 1U dual-processor system that’s primed to deliver class-leading compute strength. The DL365 Gen10 Plus can deliver 128 cores, 4TB of DRAM, and two GPUs as well. Compute-hungry applications surely will rejoice at the prospect of harnessing this kind of dense server power.
Back in March, AMD released their latest generation of AMD EPYC 7003 processors. The same day several vendors were quick to follow suit, including HPE who launched several server updates. Headlining the updated servers announced is the HPE ProLiant DL365 Gen10 Plus, a 1U dual-processor system that’s primed to deliver class-leading compute strength. The DL365 Gen10 Plus can deliver 128 cores, 4TB of DRAM, and two GPUs as well. Compute-hungry applications surely will rejoice at the prospect of harnessing this kind of dense server power.
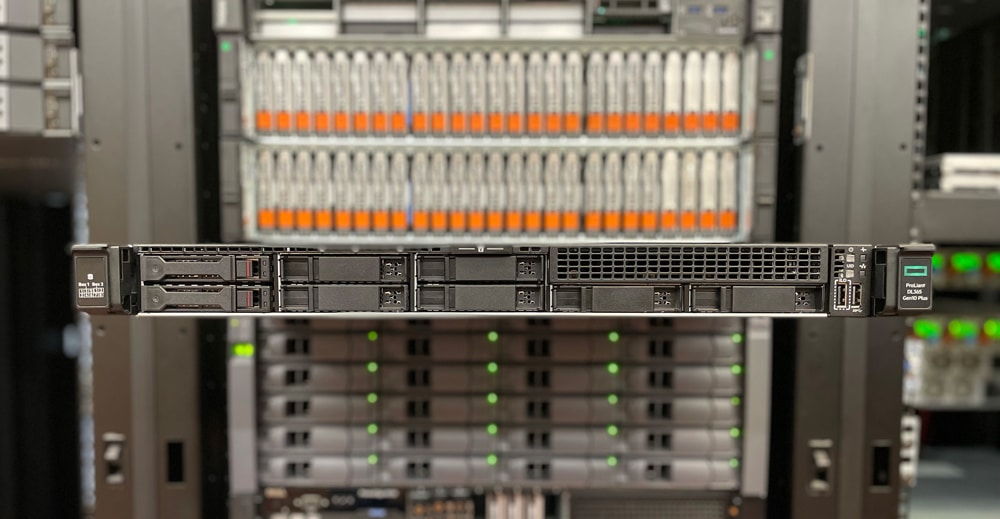
Where the HPE ProLiant DL365 Gen10 Plus Sits
When the new CPUs were announced HPE announced four new server solutions on day one (plus three Apollo solutions and three Cray solutions). Currently, there are four servers that support the new AMD EPYC 7003’s including the HPE ProLiant DL325 Gen 10 Plus v2, HPE ProLiant DL345 Gen 10 Plus, HPE ProLiant DL365 Gen 10 Plus, and the HPE ProLiant DL385 Gen 10 Plus v2.
The DL365 sits in a spot where it doesn’t bring as much storage as the DL345 or DL385, but houses two CPUs bringing much more potential performance than the DL325’s.
The HPE ProLiant DL365 Gen10 Plus can house two AMD EPYC 7003 processors. With two EPYC 7713s that means 128 cores. In the memory department, the server supports 3200MHz memory and with 32 DIMM slots (16 per CPU) it can support up to 4TB of RAM.
Looking at storage, there are 8 SFF (2.5-inch) hot-swap bays in the front though two more can be added bringing a total of 153.6TB (10 drives x 15.36TB) of NVMe storage in a 1U footprint. The 7003 CPUs support PCIe Gen4 throughout. There are also two slots for GPUs, a full-height, 3/4-length slot, and a full-height, full-length slot.
HPE has touted its security for some time and the new batch of servers is no exception. The new ProLiants are tied into the company’s silicon root of trust. Additionally, they support AMD Secure Processor, a dedicated security processor embedded in the AMD EPYC system on a chip (SoC). Every step and component is monitored on the supply chain for added security. If a server is compromised, HPE says they know quickly and can take action including refusing it the ability to boot. The server has automated recovery that includes the restoration of validated firmware. This gets the server back into operation in a timely manner.
For remote management, the HPE ProLiant DL365 Gen10 Plus offers several options including the HPE Integrated Lights-Out (iLO). And the new server is part of the company’s as-a-Service suite including in HPE GreenLake.
HPE ProLiant DL365 Gen10 Plus Specifications
| Form Factor | 1U |
| CPU | AMD EPYC 7003 Series |
| Processor Core Available | Up to 64 per CPU |
| Processor Cache Installed | Up to 256 MB L3 cache, depending on the processor model |
| Maximum Memory | 4.0 TB with 128GB DDR4 |
| Memory Slots | 32 |
| Memory Type | HPE DDR4 SmartMemory |
| Memory Protection Features | ECC |
| Drive Supported | 8 SFF SAS/SATA/NVMe with optional 1x 2 SFF SAS/SATA or 1x 2 SFF NVMe |
| Network Controller | Optional OCP and/or optional PCIe Network adapters, depending on model |
| Remote Management Software | HPE iLO Standard with Intelligent Provisioning (embedded), HPE OneView Standard (requires download) HPE iLO Advanced (require a license) |
| Power Supply Type | 2 Flexible Slot power supplies maximum depending on customer configuration |
| Expansion Slots | 3 |
| Storage Controller | HPE Smart Array SAS/SATA Controllers or Tri-Mode Controllers |
| Warranty | 3/3/3: Server Warranty includes three years of parts, three years of labor, and three years of on-site support coverage |
| Weight | 29.51 lb (13.39 kg) |
| Product Dimensions | 1.69 x 17.11 x 29.21 in (4.28 x 43.46 x 74.19 cm) |
Design and Build
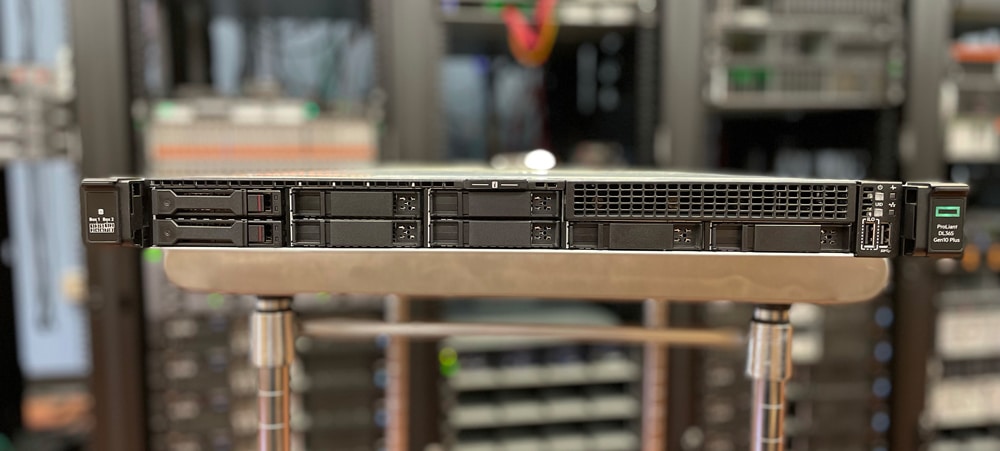
Overall, the HPE ProLiant DL365 Gen10 Plus looks more or less like the rest of the ProLiant line over the last few years. Across the front of the device are the eight, 2.5” drive bays. The 8 bays in this pre-production build are Gen4 U.3 NVMe bays, which did present some SSD compatibility issues. Full production builds won’t have this same issue that we had during our initial testing of the beta platform.
Our normal assortment of U.2 drives wouldn’t work, the drives simply weren’t seen by the system. As such, our performance testing was limited to the two supplied Samsung SSDs, which incidentally are marked U.3 only. There won’t be a problem with SSDs bought from HPE working in this server, but it should be noted that non-qualified drives may have issues.
On the right are all the important stuff like the indicator LEDs, a USB 3.1 port, the power/standby button, the UID button, and an iLO service port. There is a slot for an optional optical media bay or more drive bays can be added here.
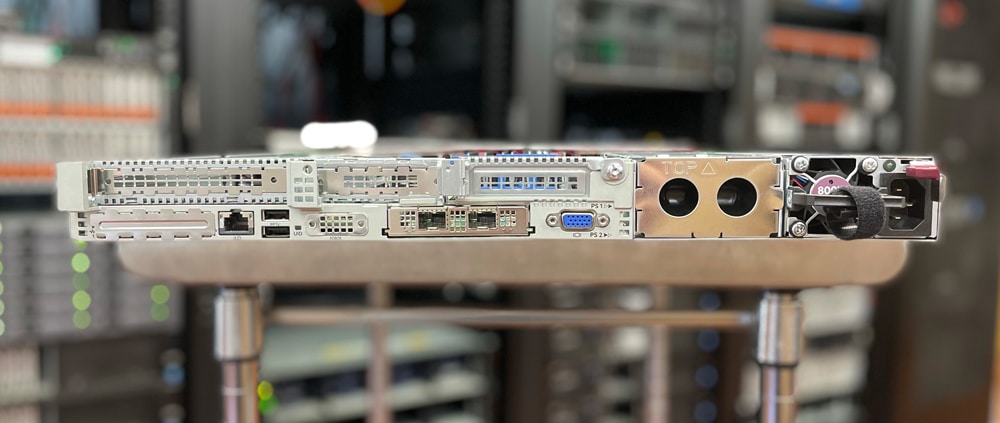
Flipping it around to the back, the PSUs are on the right. Along the top are the PCIe Gen4 slots. Along the bottom from left to right is another iLO port, two USB 3.1 ports, a UID LED, an OCP 3.0 slot, and a VGA port.
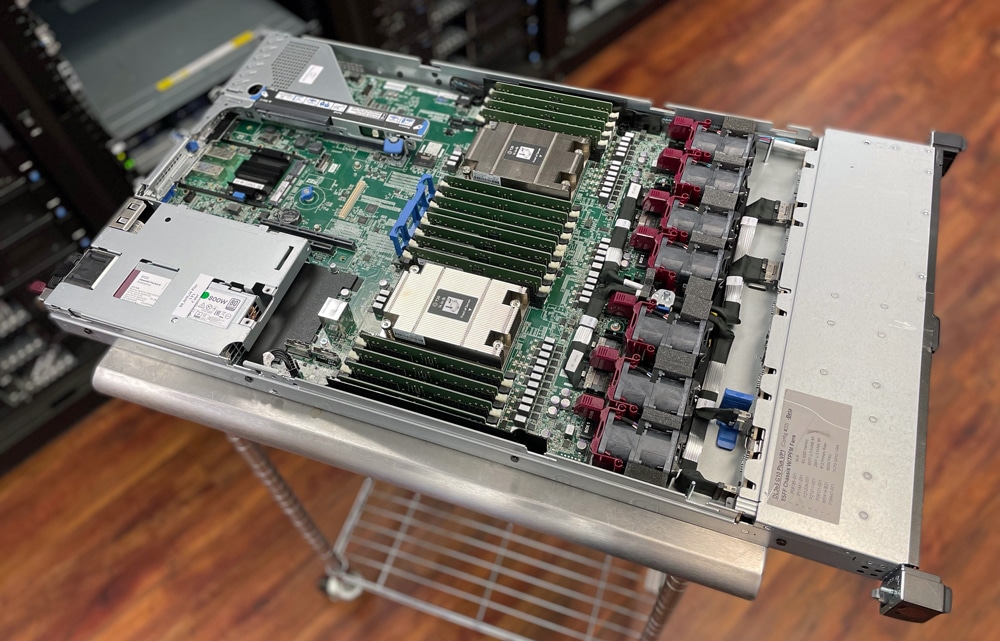
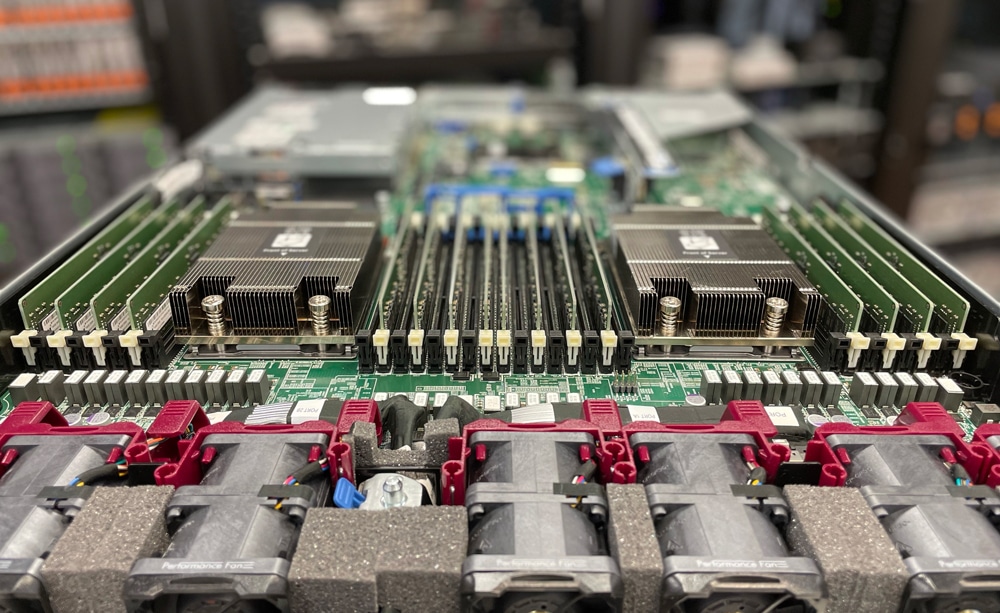
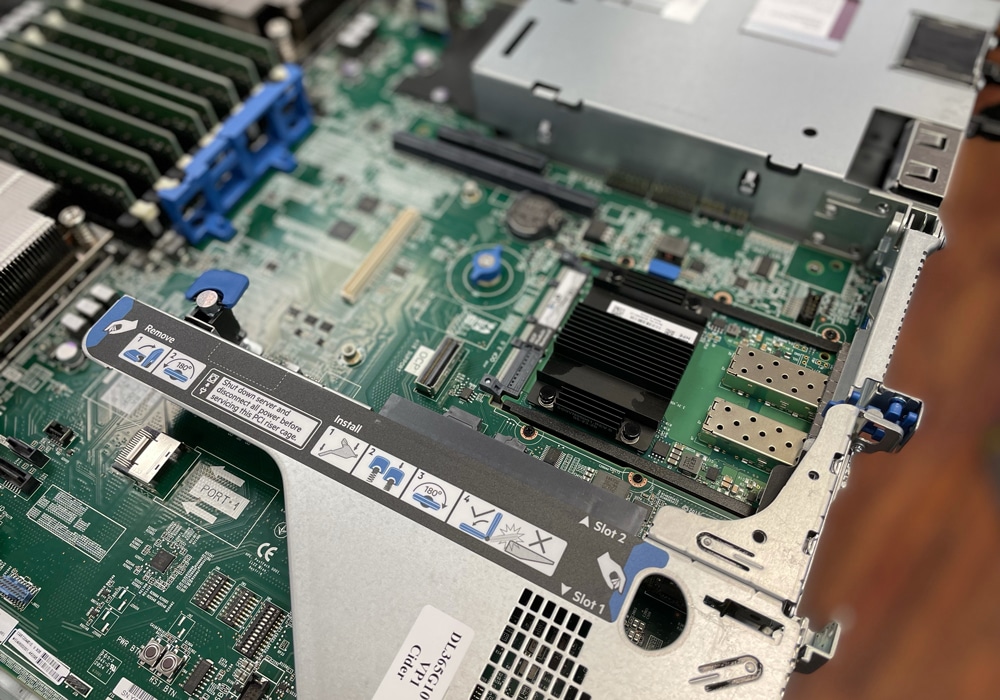
Opening up the server, we can see the two CPUs in the middle surrounded by the 32 DIMM slots.
While the rest of the inside is fairly typical server guts, there is a chassis intrusion detection connector for added safety.
HPE ProLiant DL365 Gen10 Plus Performance
HPE ProLiant DL365 Gen10 Plus Testing Configuration:
- 2 x 3.2 TB Samsung PM1735 Gen4 U.3 SSDs
- 16 x 16GB DDR4 RAM
- 2 x 7713 AMD Epyc Gen3 CPUs
SQL Server Performance
StorageReview’s Microsoft SQL Server OLTP testing protocol employs the current draft of the Transaction Processing Performance Council’s Benchmark C (TPC-C), an online transaction processing benchmark that simulates the activities found in complex application environments. The TPC-C benchmark comes closer than synthetic performance benchmarks to gauging the performance strengths and bottlenecks of storage infrastructure in database environments.
Each SQL Server VM is configured with two vDisks: 100GB volume for boot and a 500GB volume for the database and log files. From a system resource perspective, we configured each VM with 16 vCPUs, 60GB of DRAM and leveraged the LSI Logic SAS SCSI controller.
SQL Server Testing Configuration (per VM)
- Windows Server 2012 R2
- Storage Footprint: 600GB allocated, 500GB used
- SQL Server 2014
-
- Database Size: 1,500 scale
- Virtual Client Load: 15,000
- RAM Buffer: 48GB
- Test Length: 3 hours
-
- 2.5 hours preconditioning
- 30 minutes sample period
For SQL Server average latency, the HPE ProLiant DL365 Gen10 Plus had an aggregate latency of 1.5ms with individual VMs ranging from 1ms to 2ms. We’ve measured higher from this class of CPU, although we’ve used more SSDs for backend storage to drive the I/O.
Sysbench MySQL Performance
Our first local-storage application benchmark consists of a Percona MySQL OLTP database measured via SysBench. This test measures average TPS (Transactions Per Second), average latency, and average 99th percentile latency as well.
Each Sysbench VM is configured with three vDisks: one for boot (~92GB), one with the pre-built database (~447GB), and the third for the database under test (270GB). From a system resource perspective, we configured each VM with 16 vCPUs, 60GB of DRAM and leveraged the LSI Logic SAS SCSI controller.
Sysbench Testing Configuration (per VM)
- CentOS 6.3 64-bit
- Percona XtraDB 5.5.30-rel30.1
- Database Tables: 100
-
- Database Size: 10,000,000
- Database Threads: 32
- RAM Buffer: 24GB
- Test Length: 3 hours
-
- 2 hours preconditioning 32 threads
- 1 hour 32 threads
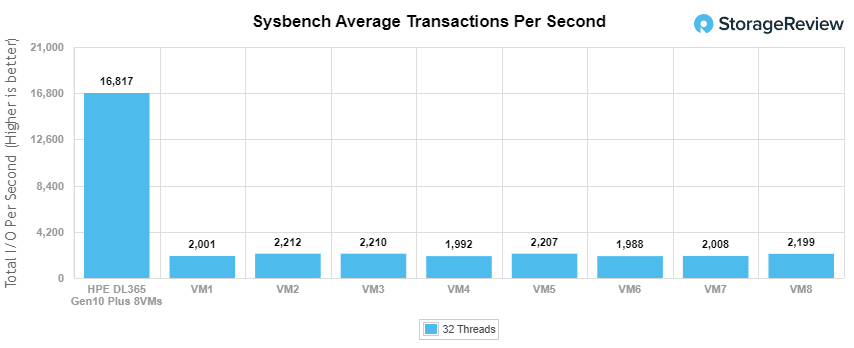
With the Sysbench OLTP, we recorded an aggregate score of 16,817 TPS with individual VMs running from 1988 TPS to 2210 TPS. We left a lot of CPU on the table with the limited storage configuration, although it goes to show just how little Gen4 NVMe SSD you need to get the huge potential out of these next-gen platforms.
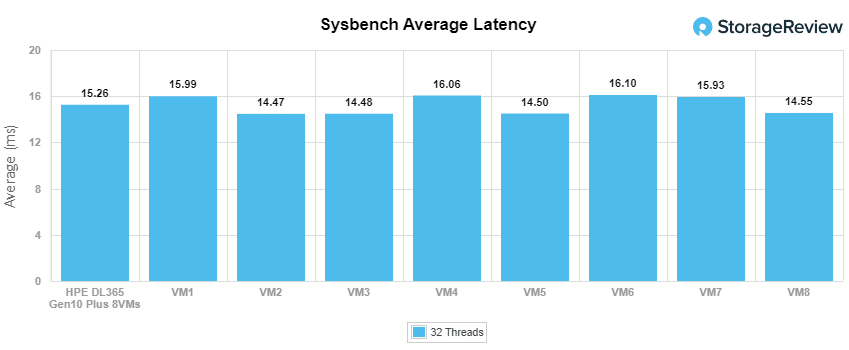
With Sysbench average latency, the server had an aggregate of 15.26ms with individual VMs ranging from 14.47ms to 16.1ms.
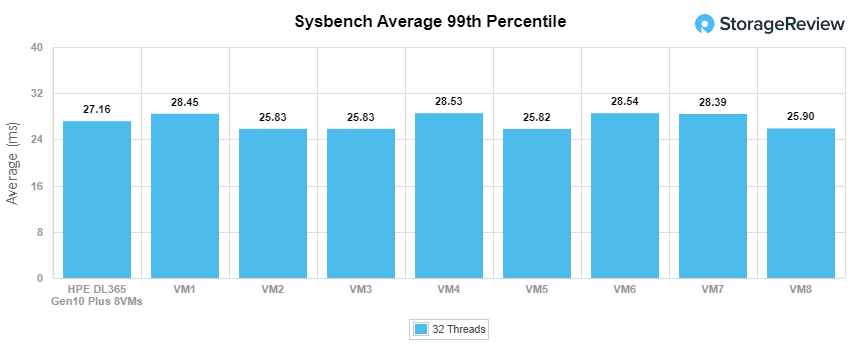
In our worst-case scenario (99th percentile) latency the DL365 had an aggregate of 27.16ms with individual VMs ranging from 25.82ms to 28.54ms.
VDBench Workload Analysis
When it comes to benchmarking storage arrays, application testing is best, and synthetic testing comes in second place. While not a perfect representation of actual workloads, synthetic tests do help to baseline storage devices with a repeatability factor that makes it easy to do apples-to-apples comparisons between competing solutions.
These workloads offer a range of different testing profiles ranging from “four corners” tests, common database transfer size tests, as well as trace, captures from different VDI environments. All of these tests leverage the common vdBench workload generator, with a scripting engine to automate and capture results over a large compute testing cluster. This allows us to repeat the same workloads across a wide range of storage devices, including flash arrays and individual storage devices.
Profiles:
- 4K Random Read: 100% Read, 128 threads, 0-120% iorate
- 4K Random Write: 100% Write, 128 threads, 0-120% iorate
- 64K Sequential Read: 100% Read, 32 threads, 0-120% iorate
- 64K Sequential Write: 100% Write, 16 threads, 0-120% iorate
- Synthetic Database: SQL and Oracle
- VDI Full Clone and Linked Clone Traces
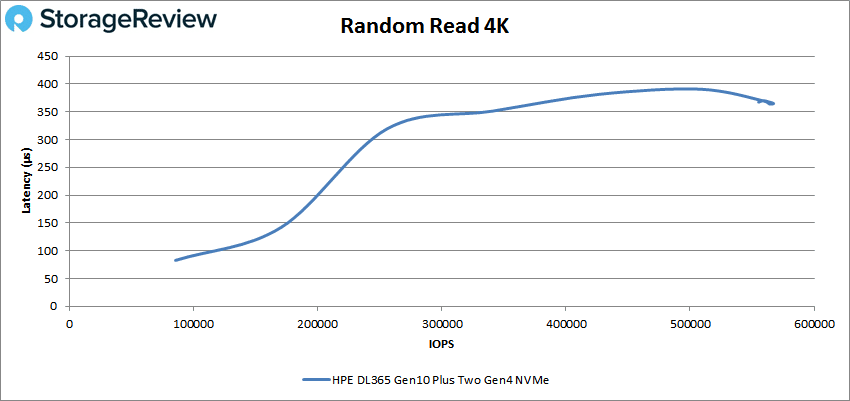
Looking at random 4K read, the HPE ProLiant DL365 Gen10 Plus with two PCIe Gen4 NVMe SSDs started below 100µs for a bit and went on to peak at 567,341 IOPS with a latency of 365µs.
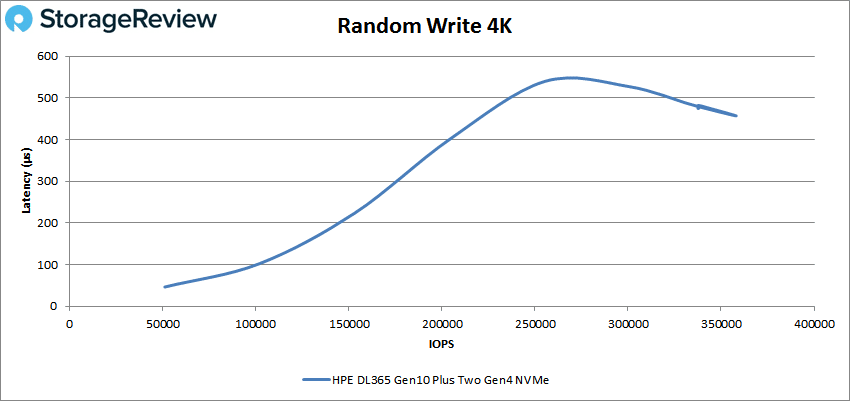
4K write also was the DL365 start beneath 100µs. The server went on to peak at 358,073 IOPS and a latency of 457µs.
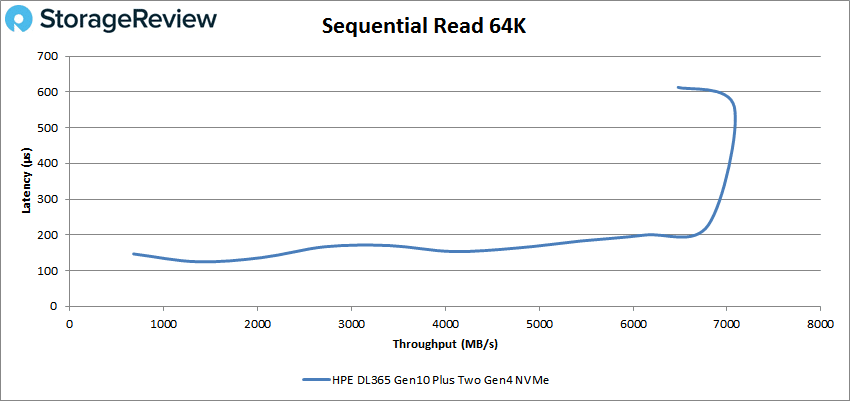
Switching over to our 64K sequential workloads, in read we saw the HPE server peak at roughly 113K IOPS or 7.1GB/s at 560µs before dropping off a bit.
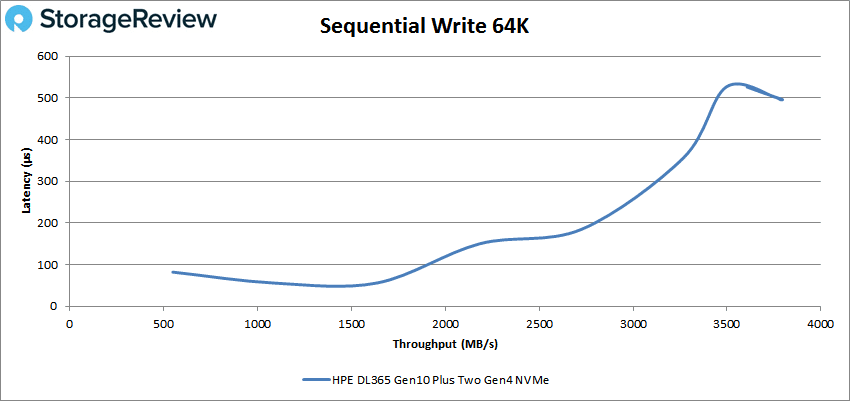
64K write saw a sub-100µs latency until about 30K IOPS or 1.5GB/s and a peak of 60,715 IOPS or 3.79GB/s at a latency of 496µs.
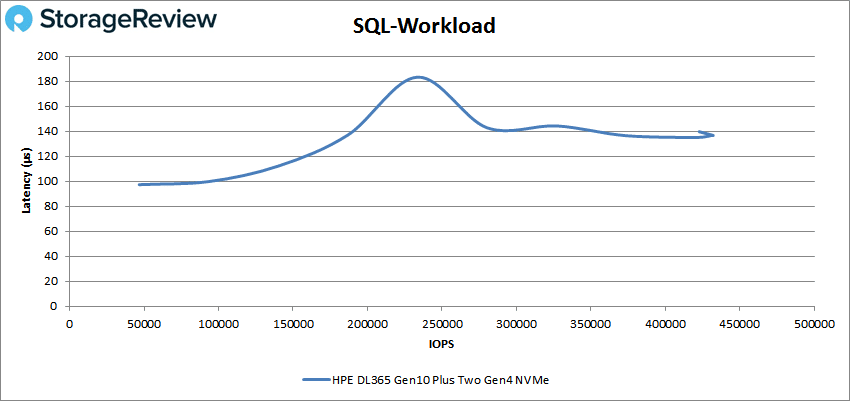
Next up are our SQL workloads, SQL, SQL 90-10, and SQL 80-20. With SQL, the DL365 started just a hair under 100µs and went on to peak at 431,077 IOPS with a latency of 137µs before a very slight drop-off.
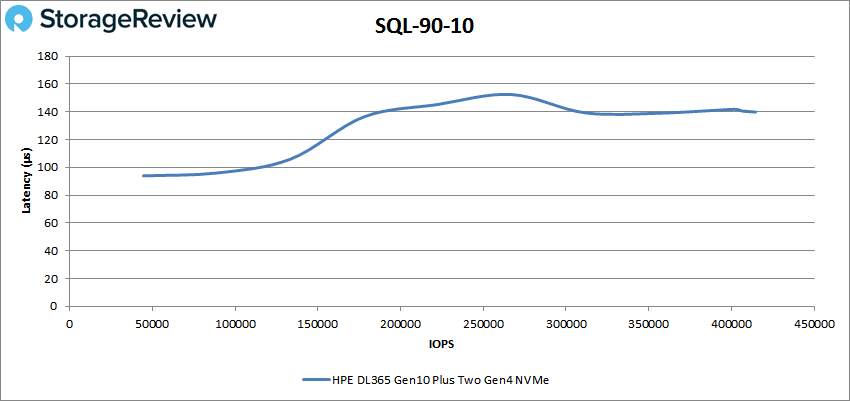
In SQL 90-10 we see the same at the start before going on to peak at 414,544 IOPS and a latency of 140µs.
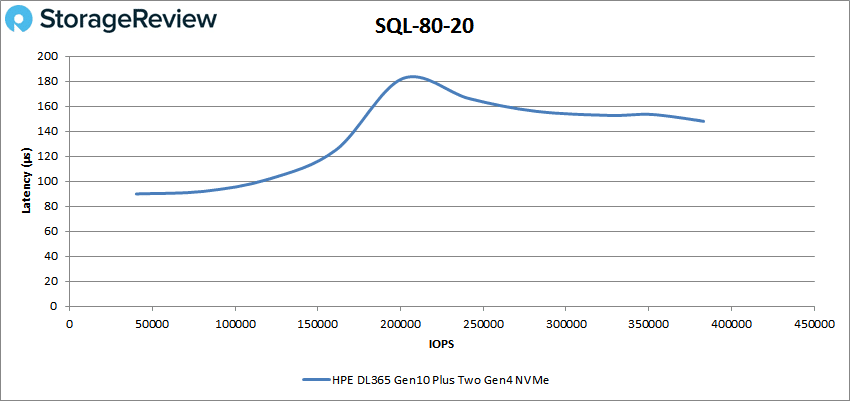
SQL 80-20 once again saw a similar low latency start before peaking at 383,171 IOPS and a latency of 148µs.
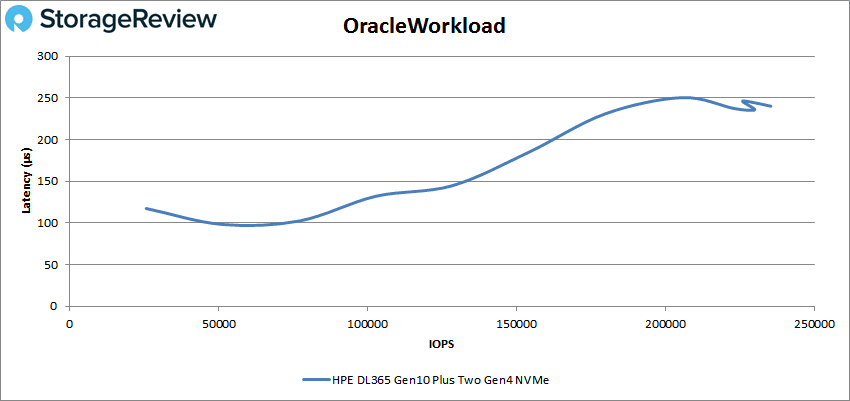
Now we move on to our Oracle workloads, Oracle, Oracle 90-10, and Oracle 80-20. With Oracle, the DL365 Plus peaked at 235,477 IOPS and a latency of 240µs.
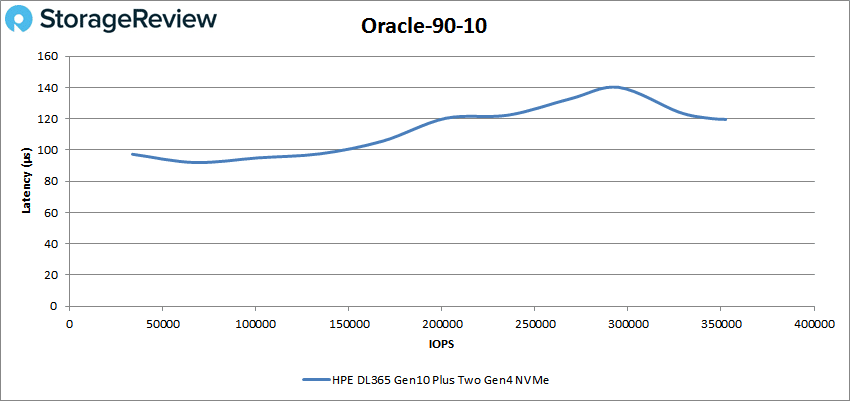
Oracle 90-10 saw the HPE server start under 100µs and stay there for a good part of the run. The server went on to peak at 352,478 IOPS with a latency of 120µs.
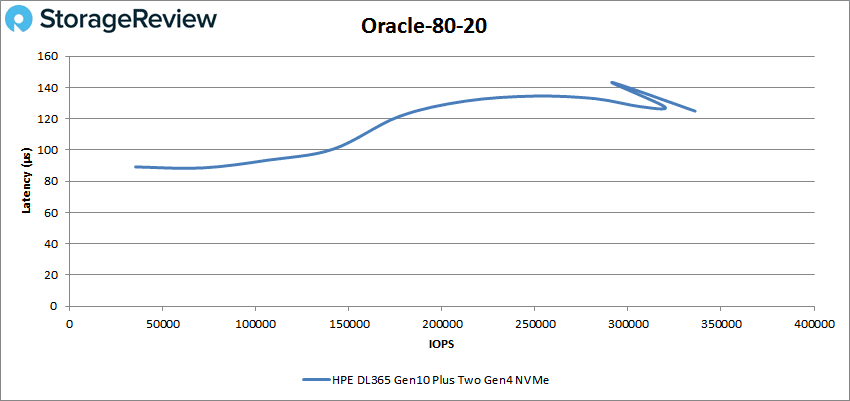
With Oracle 80-20 the server again started under 100µs, staying there until breaking 15K IOPS. It went on to peak at 336,046 IOPs and latency of 125µs.
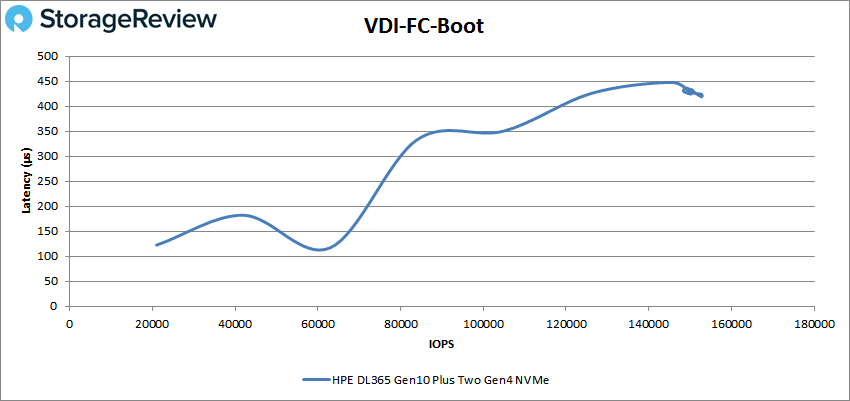
Next, we switched over to our VDI clone test, Full and Linked. For VDI Full Clone (FC) Boot, the HPE ProLiant DL365 Gen10 Plus hit a peak of 152,725 IOPS and a latency of 419µs.
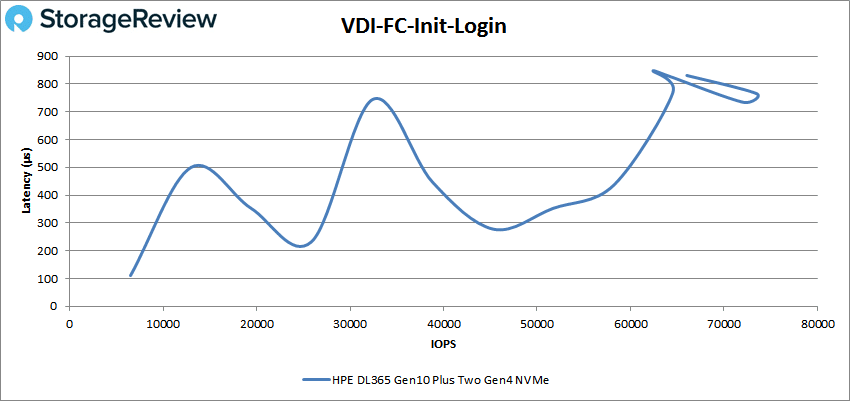
VDI FC Initial Login saw a peak of 73,535 IOPS at a latency of 765µs before dropping off some.
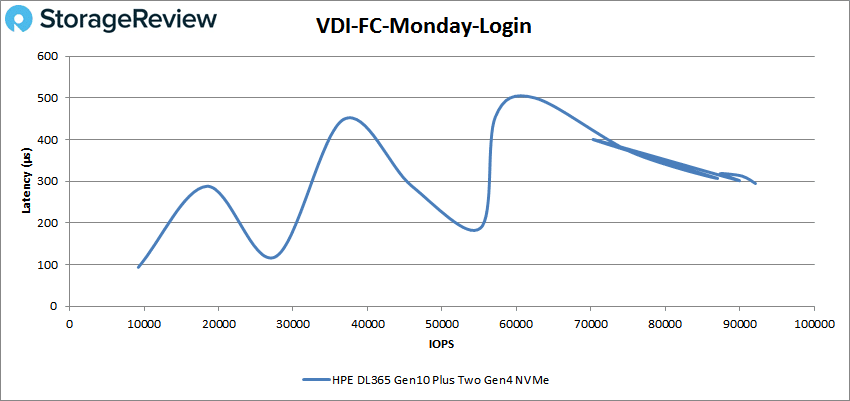
With VDI FC Monday Login, the server gave us a peak of 92,118 IOPS and a latency of 295µs.
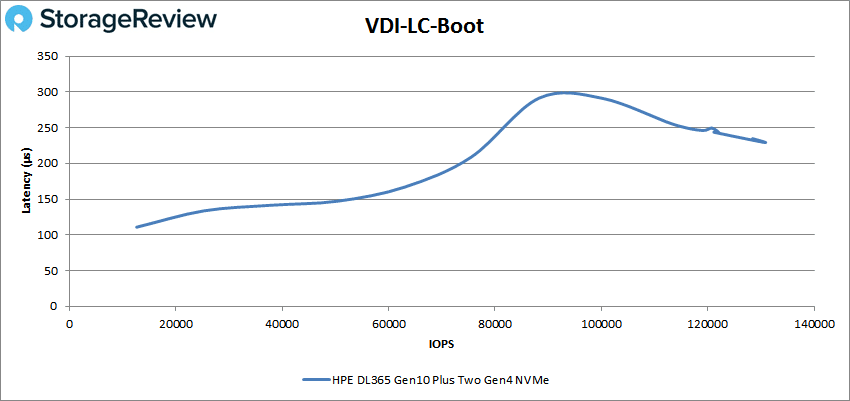
Next, we look at VDI Linked Clone (LC) tests. Starting with boot, the server had a peak of 130,062 IOPS and a latency of 230µs.
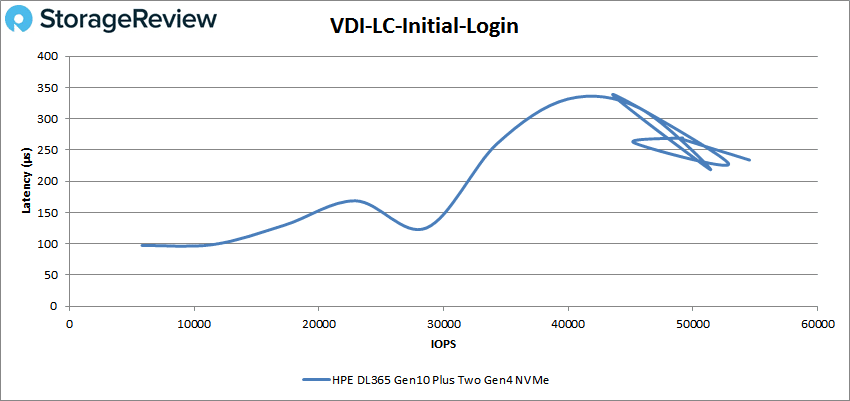
For VDI LC Initial Login the HPE server had a peak performance of 54,548 IOPS and a latency of 234µs.
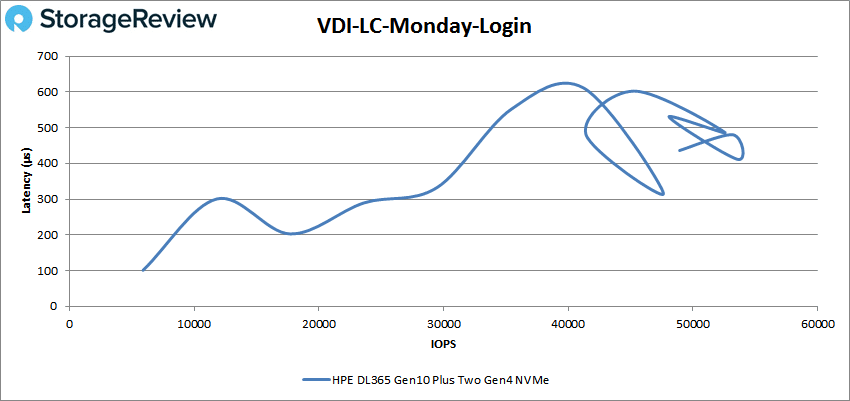
Finally, with VDI LC Monday Login we saw a peak of about 53,250 IOPS and 450µs before a drop-off in performance.
Conclusion
The HPE ProLiant DL365 Gen10 Plus is a 1U server that features two AMD EPYC 7003 processors. This can bring up to 128 cores and up to 4TB of 3200MHz RAM to this little server. While it is not made to be storage heavy, users can put up to 153TB of NVMe storage into its tiny footprint. The DL365 comes with some HPE specific benefits include the silicon root of trust and other security measures. HPE iLO management to monitor the server status and help relieve issues. And support for HPE GreenLake allowing this server to fall under the company’s larger as-a-Service umbrella.
For performance, we ran our Application Workload Analysis including SQL Server latency and Sysbench. We also ran our VDBench tests. In SQL Server latency, the HPE ProLiant DL365 Gen10 Plus had an aggregate average latency of 1.5ms. In Sysbench we saw aggregate scores of 16,817 TPS, 15.26ms in average latency, and just 27.16ms in worst-case scenario latency. Both of these workloads would have measured much higher, although we had a more limited set of SSDs to test with given the U.3 SSD backplane in the system.
With VDBench we saw several good results as well, highlights include: 567K IOPS in 4K read, 358K IOPS in 4K write, 7.1GB/s in 64K read, and 3.79GB/s in 64K write. In SQL we saw peaks of 431K IOPS, 415K IOPS in SQL 90-10, and 383K IOPS in SQL 80-20. For Oracle, we saw 235K IOPS, 352K IOPS in Oracle 90-10, and 336K IOPS in Oracle 80-20. In our VDI Full Clone benchmarks, we saw 153K IOPS in boot, 74K IOPS in Initial Login, and 92K IOPS in Monday Login. For VDI Linked Clone we saw 130K IOPS in boot, 55K IOPS in Initial Login, and 53K IOPS in Monday Login.
The HPE ProLiant DL365 Gen10 Plus sits in the middle of the newly announced AMD-based servers from HPE. Being a 1U it can’t bring as much storage (though you can still pack in a reasonable 153TB), it does come with AMD EPYC 7003 CPUs that can deliver 128 cores, 4TB of RAM and GPU support. This packs plenty of dense compute performance for a wide range of workloads.
Engage with StorageReview
Newsletter | YouTube | LinkedIn | Instagram | Twitter | Facebook | TikTok | RSS Feed

