

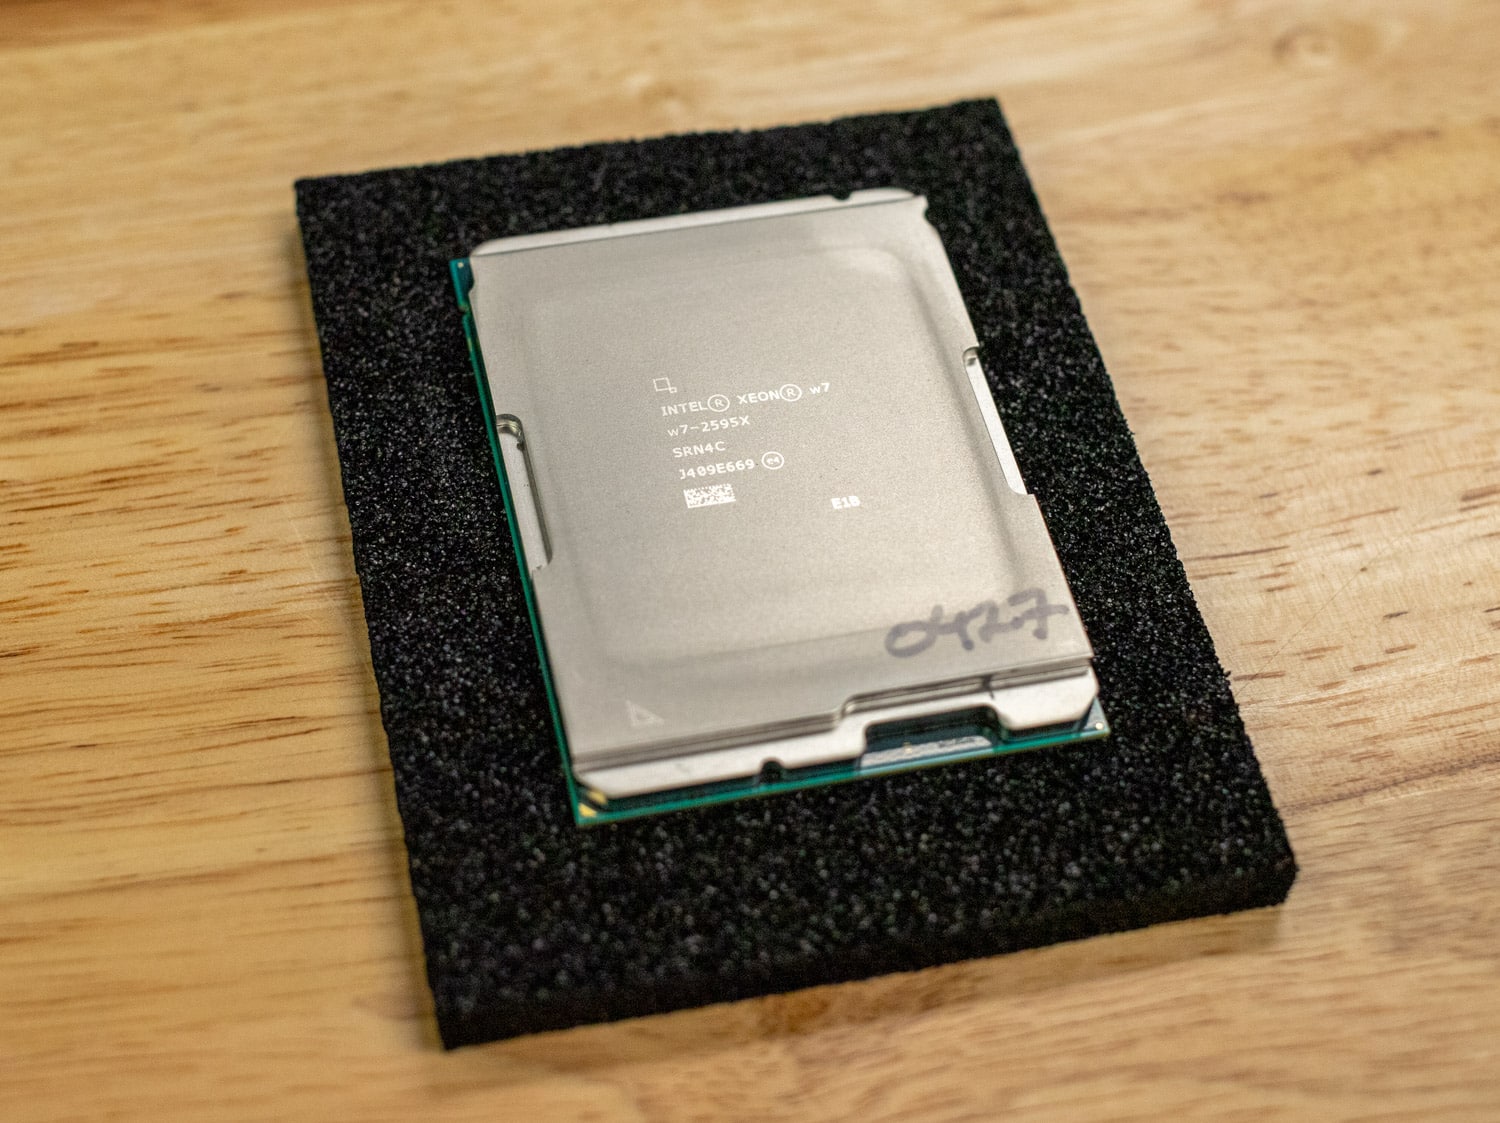
The Intel Xeon w7-2595X processor is the latest addition to the Xeon W-2500 series, targeting high-performance workstation applications. It is designed for AI development, data science, media, and engineering workloads. This 26-core, 52-thread processor comes with a maximum clock speed of 4.8 GHz, an incremental improvement over previous models, and features 48.75 MB of L3 Smart Cache to aid in handling data-heavy tasks.
Architecture and Features
The Xeon w7-2595X is based on Intel’s 7 Processor and designed with 26 Performance cores and 52 threads. This allows it to tackle heavy parallel workloads such as rendering, AI inferencing, and simulations. Clock speeds reach up to 4.8 GHz, a considerable improvement over previous generations, especially in multi-threaded applications.

Intel has significantly expanded the compute capabilities of the Xeon W platform, and the w7-2595X benefits from the increased L2 and L3 caches, designed to optimize data access and boost performance in compute-heavy scenarios. With 48.75 MB of Smart Cache, the processor can handle large datasets and intensive multitasking without significant latency.
The processor supports up to 2TB of DDR5 ECC RDIMMs running at 4800MT/s, making it suitable for memory-intensive workloads like deep learning model training or large-scale simulations. The introduction of Intel Advanced Matrix Extensions (AMX) further enhances AI performance, providing up to a 3x boost in AI inferencing workloads, according to Intel’s estimates.

Another key feature is the PCIe 5.0 support, which has up to 64 lanes directly connected to the CPU. This allows for advanced system configurations involving multi-GPU setups, ultra-fast storage, and network interfaces. Whether a NAS deployment or a high-end rendering farm, the Xeon w7-2595X can scale accordingly.
Platform Integration
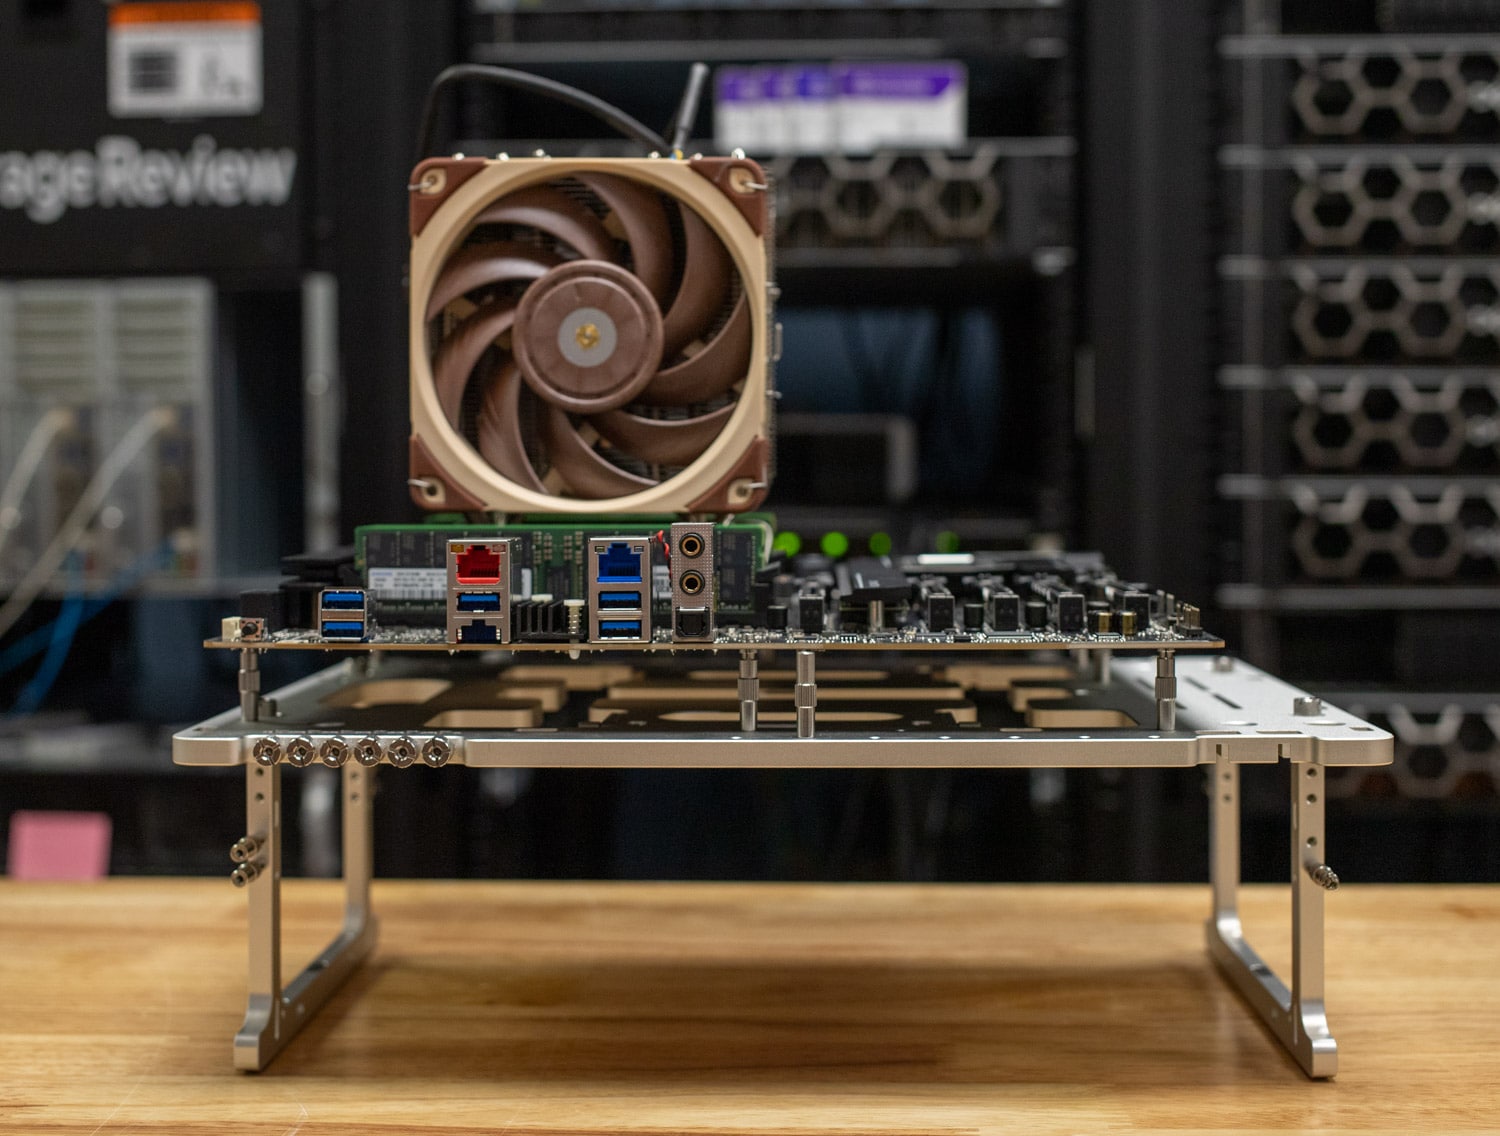
The Xeon w7-2595X works alongside Intel’s W790 chipset, which provides additional PCIe lanes, integrated Wi-Fi 6E, and enhanced security features through Intel vPro technology. This makes the platform powerful but also secure and manageable in enterprise environments. Furthermore, the ASRock W790 WS R2.0 motherboard used in our test setup showcased the necessary bandwidth and stability to handle this processor’s capabilities, particularly when running multiple GPUs or storage arrays.

For those concerned with system cooling and power efficiency, it’s worth noting that the Xeon w7-2595X has a substantial TDP of 250W. However, with proper cooling solutions like the Noctua NH-U14S used in our test setup, the system remains stable even under heavy multi-threaded loads. Overclocking, including Intel XMP 3.0 memory profiles, is also supported, allowing enthusiasts to push their systems further.
Performance Claims and Workload Suitability
Intel’s internal testing shows the Xeon w7-2595X excelling in various professional workloads, from 3D rendering to AI inferencing. Benchmarks like Blender, PugetBench for Adobe Premiere Pro, and Cinebench R23 are all areas where the processor shines. Specifically, Intel claims up to a 6% performance boost in multi-threaded workloads over previous generations when optimizations such as extended Package Power Time Window are applied.
Another area where the Xeon w7-2595X is positioned is in AI model training and inferencing. With support for Intel AMX, the processor can accelerate operations like matrix multiplications, which are critical in deep learning workloads. Combined with Intel OpenVINO optimizations, the w7-2595X delivers improved inferencing performance across frameworks.

This processor also benefits businesses with Intel vPro technology, enhancing system security, remote manageability, and stability. Industries such as financial services, media and entertainment, and engineering, which rely on these mission-critical systems, will find these features highly relevant.
Comparables
We will be comparing our rig’s results, as noted above, the ASRock w790 motherboard, 8x 96GB DDR5 Kingston DIMMS, to the following:
Dell Precision 3680 (Intel Core i9-14900K)
The Dell Precision 3680 has the last-gen Intel Core i9-14900K, a high-performance CPU designed for gaming and professional workloads. It features a 24-core, 32-thread processor hybrid architecture with a mix of Performance-cores (P-cores) and Efficient-cores (E-cores), reaching boost clock speeds of up to 6.0 GHz. This architecture allows the i9-14900K to excel in applications that benefit from high single-thread performance while still offering substantial multi-threaded processing power. Paired with 64GB of DDR5 RAM and an NVIDIA RTX 6000 Ada Generation GPU, this setup is well-suited for tasks such as 3D rendering, video editing, and complex simulations. The i9-14900 K’s high clock speeds make it particularly effective for single-threaded applications and workloads that require rapid processing speeds.
AMD Ryzen 9 9950X (w/ PBO enabled)
The AMD Ryzen 9 9950X is part of AMD’s Zen 5 architecture, offering a blend of performance and efficiency with its 16-core, 32-thread configuration. Our testing rig features an ASUS ROG CROSSHAIR X670E HERO motherboard and is cooled by the ASUS ROG RYUJIN III 360 AIO. As indicated, the Ryzen 9 9950X is designed to push its limits under Precision Boost Overdrive (PBO). This technology allows the CPU to dynamically boost its clock speeds while optimizing performance across single- and multi-threaded tasks. It also supports DDR5 memory and PCIe Gen5, making it ideal for demanding workloads such as gaming, content creation, and software development. Our testing rig also features the XFX Radeon 7900 GRE GPU.
Benchmark Results
Blender OptiX
First is the Blender benchmark, which evaluates performance using an open-source 3D modeling and rendering application. The benchmark measures the number of samples processed per minute, with higher scores indicating better performance.
The Intel Xeon w7-2595X shows respectable performance across the board, scoring 307.705, 216.70, and 155.83 samples per minute for the Monster, Junkshop, and Classroom scenes, respectively. While the AMD Ryzen 9 9950X follows closely behind, the Dell Precision 3680 with the Intel Core i9-14900K vastly outperforms both, achieving significantly higher scores. However, it’s important to note that this discrepancy is primarily due to the Dell system’s reliance on a powerful GPU rather than the CPU itself.
Since Blender’s OptiX benchmark heavily utilizes GPU resources, the Intel Xeon w7-2595X’s scores should not be seen as a direct measure of its CPU-only performance but rather as a combination of its CPU and GPU capabilities. When focusing solely on CPU performance, the Xeon demonstrates solid, consistent results, especially in multi-threaded tasks, given its 26 cores and 52 threads, which outpace the Ryzen 9 in multi-core workloads.
| Blender OptiX (Samples per minute, Higher is better) | Intel Xeon w7-2595X (26c, 52t) | AMD Ryzen 9 9950X PBO (Zen5, 16c, 32t) | Dell Precision 3680 (Intel Core i9-14900K (24c, 32t) |
| Monster | 307.705 | 285.489 | 5,805.6 |
| Junkshop | 216.70 | 201.311 | 2,649.8 |
| Classroom | 155.83 | 142.251 | 2,800.76 |
Blackmagic RAW Speed Test
We have also started running Blackmagic’s RAW speed test. This benchmark tests CPU performance in handling high-resolution video playback.
The Intel Xeon w7-2595X takes the lead with 160 fps in the 8K CPU test, likely attributed to its higher core count (26c, 52t). The Ryzen 9 9950X trails behind with 101 fps, and the Dell Precision 3680, equipped with an Intel Core i9-14900K, also lags at 108 fps. Even in the 8K CUDA test, the new Xeon CPU remains competitive with 138 fps.
| Blackmagic RAW Speed Test (Higher is better) | Intel Xeon w7-2595X (26c, 52t) | AMD Ryzen 9 9950X PBO (Zen5, 16c, 32t) | Dell Precision 3680 (Intel Core i9-14900K (24c, 32t) |
| 8K CPU | 160 fps | 101 fps | 108 fps |
| 8K CUDA | 138 fps | 119 fps | 119 fps |
7-Zip Compression
The 7-Zip Compression benchmark evaluates the CPUs’ ability to compress data, a task that benefits from high core counts and efficient memory handling.
The Intel Xeon w7-2595X shows exceptional performance in this test, with a total rating of 210.255 GIPS (Giga Instructions Per Second), which is considerably higher than the last-gen Intel Core i9-14900 K’s 162.318 GIPS. The Xeon’s high core and thread count contribute significantly to its ability to handle compression workloads more efficiently, as evidenced by its superior GIPS ratings and CPU usage metrics (e.g., 2718% current CPU usage).
Despite its higher CPU usage percentages, the Xeon w7-2595X maintains a consistent performance advantage over the Core i9. It competes closely with the AMD Ryzen 9 9950X, which achieved a slightly higher rating in some cases (e.g., 225.200 GIPS). This likely means that the Xeon w7-2595X is particularly optimized for high-intensity, multi-threaded tasks and can effectively leverage its core architecture to outperform its competitors in CPU-centric applications.
| 7-Zip Compression Benchmark (Higher is better) | Intel Xeon w7-2595X (26c, 52t) | AMD Ryzen 9 9950X PBO (Zen5, 16c, 32t) | Dell Precision 3680 (Intel Core i9-14900K (24c, 32t) |
| Current CPU Usage | 2,718% | 1,235% | 1,080% |
| Current Rating/Usage | 7.562 GIPS | 14.050 GIPS | 11.763 GIPS |
| Current Rating | 205.522 GIPS | 173.536 GIPS | 127.011 GIPS |
| Resulting CPU Usage | 2714% | 1211% | 1,153% |
| Resulting Rating/Usage | 7.559 GIPS | 14.436 GIPS | 11.099 GIPS |
| Resulting Rating | 205.518 GIPS | 174.506 GIPS | 127.542 GIPS |
| Current CPU Usage | 5,149% | 3,128% | 3,021% |
| Current Rating/Usage | 4.176 GIPS | 8.879 GIPS | 6.521 GIPS |
| Current Rating | 215.016 GIPS | 277.706 GIPS | 197.036 GIPS |
| Resulting CPU Usage | 5095% | 3111% | 3,022% |
| Resulting Rating/Usage | 4.227 GIPS | 8.868 GIPS | 6.523 GIPS |
| Resulting Rating | 215.331 GIPS | 275.894 GIPS | 197.094 GIPS |
| Total CPU Usage | 3,905% | 2,161% | 2,087% |
| Total Rating/Usage | 5.893 GIPS | 11.652 GIPS | 8.811 GIPS |
| Total Rating | 210.255 GIPS | 225.200 GIPS | 162.318 GIPS |
UL Procyon AI Inference
The UL Procyon AI Inference benchmark assesses CPUs’ AI model inference performance using different frameworks. The Intel Xeon w7-2595X shows strong performance, mainly when using Intel’s OpenVINO toolkit, with significantly lower average inference times across several models than the same CPU running Windows ML. For instance, in the MobileNet V3 test, the Xeon achieves 0.75ms with OpenVINO versus 1.15ms with Windows ML. Similarly, for more complex models like Inception V4 and DeepLab V3, OpenVINO offers a clear advantage with inference times of 12.51ms and 12.69ms, respectively, compared to 15.94ms and 21.75ms using Windows ML.
Compared to the AMD Ryzen 9 9950X and Dell Precision 3680, the Xeon w7-2595X using OpenVINO consistently outperforms both systems, showcasing the advantages of optimized AI inference libraries. While the Ryzen 9 performs similarly to the Xeon in some models (e.g., YOLO V3 and MobileNet V3), it generally lags when more demanding models are tested, such as Real-ESRGAN, where the Xeon with OpenVINO completes in 678.53ms versus the Ryzen’s 2,029.39ms.
The Intel Xeon w7-2595X performed best in this benchmark when utilizing Intel OpenVINO, demonstrating its efficiency in AI inference tasks. This makes it suitable for workloads involving AI model deployments where inference speed is critical.
| UL Procyon Average Inference Times (Lower is better) | Intel Xeon w7-2595X (26c, 52t) (Windows ML) |
Intel Xeon w7-2595X (26c, 52t) (Intel OpenVINO) |
AMD Ryzen 9 9950X PBO (Zen5, 16c, 32t) |
Dell Precision 3680 (Intel Core i9-14900K (24c, 32t) |
| MobileNet V3 | 1.15ms | 0.75ms | 1.03ms | 0.89 ms |
| ResNet 50 | 5.98ms | 5.07ms | 5.59ms | 7.13 ms |
| Inception V4 | 15.94ms | 12.51ms | 14.86ms | 20.79 ms |
| DeepLab V3 | 21.75ms | 12.69ms | 21.49ms | 24.05 ms |
| YOLO V3 | 26.61ms | 37.99ms | 26.83ms | 50.92 ms |
| Real-ESRGAN | 1,215.30ms | 678.53ms | 2,029.39ms | 2,413.15 ms |
| Overall Score | 242 | 316 | 232 | 184 |
y-cruncher
The y-cruncher benchmark measures computational efficiency and speed for calculating large numbers of Pi digits, leveraging CPUs’ multi-core and multi-threaded capabilities. Since its launch in 2009, it has become a popular benchmarking and stress-testing application for overclockers and hardware enthusiasts.
In this test, the Intel Xeon w7-2595X performs very well, completing the calculation of 1 billion digits in just 10.819 seconds. This is significantly faster than the AMD Ryzen 9 9950X and Dell Precision 3680, which take 17.494 seconds and 22.246 seconds, respectively.
As the computation size increases, the expected performance gap widens. For 2.5 billion digits, the Xeon completes the task in 31.393 seconds, substantially faster than the Ryzen’s 50.120 seconds and the Dell’s 62.443 seconds. At the 5 billion digits mark, the Xeon’s advantage is even more pronounced, finishing in 70.952 seconds, compared to the Ryzen’s 116.049 seconds and the Dell’s 138.698 seconds.
The Xeon w7-2595X’s superior performance in y-cruncher can be attributed to its high core count and efficient utilization of resources, allowing it to handle intensive computational workloads more effectively.
| y-cruncher (Total computation time in seconds; lower is better) | Intel Xeon w7-2595X (26c, 52t) | AMD Ryzen 9 9950X PBO (Zen5, 16c, 32t) | Dell Precision 3680 (Intel Core i9-14900K (24c, 32t) |
| 1 billion digits | 10.819 seconds | 17.494 seconds | 22.246 seconds |
| 2.5 billion | 31.393 seconds | 50.120 seconds | 62.443 seconds |
| 5 billion | 70.952 seconds | 116.049 seconds | 138.698 seconds |
y-cruncher BBP
The y-cruncher BBP (Bailey-Borwein-Plouffe) benchmark evaluates CPU performance in computing large hexadecimal digits of Pi, focussing on multi-core efficiency and total computation time. In this benchmark, the Intel Xeon w7-2595X showcases its solid multi-core performance and efficiency.
In the 1 BBP test, the new Xeon CPU takes 0.584 seconds, with a high CPU utilization of 3,581.07% and a multi-core efficiency of 68.87%. The AMD Ryzen 9 9950X completes this test faster at 0.326 seconds but has significantly lower CPU utilization (732.71%) and multi-core efficiency (22.90%), suggesting less effective use of its available cores. The Xeon’s results indicate a more balanced and efficient use of its cores under heavy computational loads.
As the number of BBP computations increases, the Xeon maintains a high multi-core efficiency, reaching 97.50% for 10 BBP and 99.73% for 100 BBP, with total times of 5.536 seconds and 60.647 seconds, respectively. Despite its faster times in the 1 BBP test, the Ryzen CPU shows less consistent efficiency at higher counts. This consistency in multi-core efficiency and total computation time positions the Xeon w7-2595X as a strong contender for workloads that demand sustained multi-core performance.
| Benchmark | Intel Xeon w7-2595X (26c, 52t) |
AMD Ryzen 9 9950X PBO (Zen5, 16c, 32t) |
Dell Precision 3680 (Intel Core i9-14900K (24c, 32t) |
| 1 BBP | · Total Time: 0.584 seconds
|
|
N/A |
| 10 BBP |
|
|
N/A |
| 100 BBP |
|
|
N/A |
Geekbench 6
The Geekbench 6 benchmark measures overall system performance across different platforms, emphasizing CPU performance. The benchmark provides separate scores for single-core and multi-core performance, giving a well-rounded view of how a processor performs under various workloads. You can find comparisons to any system you want in the Geekbench Browser.
Single-Core Performance
In the Geekbench 6 single-core test, the Intel Xeon w7-2595X scores 2,436, which is lower than both the AMD Ryzen 9 9950X (3,346) and the Intel Core i9-14900K (3,059). This outcome is expected, as Geekbench favors higher CPU clock speeds over core count, and both the Ryzen 9 and Core i9 have higher base and boost clock speeds than the Xeon w7-2595X. The Ryzen 9 9950X leads the pack, indicating it has the highest single-threaded performance among the three, which makes it the more robust choice for tasks that rely heavily on single-core performance, such as certain gaming and light computational tasks.
Multi-Core Performance
For multi-core performance, the Intel Xeon w7-2595X showed a score of 19,676, slightly trailing the AMD Ryzen 9 9950X’s 20,801 but outperforming the Intel Core i9-14900 K’s score of 19,216. The Xeon’s relatively high multi-core score reflects its strength in workloads that can effectively leverage its 26 cores and 52 threads, such as video rendering, 3D modeling, and other parallelized tasks. Despite this, the Ryzen 9 9950X takes the lead in multi-core performance, likely due to its combination of higher clock speeds and efficient core architecture, which offers better performance per core. The Core i9-14900 K’s competitive performance is hampered by its lower core count compared to the Xeon, though it still benefits from its high clock speeds.
| Geekbench 6 (Higher is better) |
Intel Xeon w7-2595X (26c, 52t) | AMD Ryzen 9 9950X PBO (Zen5, 16c, 32t) | Dell Precision 3680 (Intel Core i9-14900K (24c, 32t) |
| CPU Single-Core | 2,436 | 3,346 | 3,059 |
| CPU Multi-Core | 19,676 | 20,801 | 19,216 |
Maxon Cinebench Results
- Cinebench R15: An older benchmark tool that evaluates CPU performance using a scene rendering task, primarily measuring multi-core performance.
- Cinebench R20: An updated version of Cinebench R15 with more complex scenes and higher computational requirements, reflecting real-world usage and supporting newer instruction sets.
- Cinebench R23: Builds on R20 with longer test times to assess thermal throttling and includes both multi-core and single-core scores for a comprehensive CPU performance evaluation.
- Cinebench 2024 (R24): The latest version with a demanding rendering task, optimized for modern CPUs and extended loads, offering both multi-core and single-core performance results.
Cinebench R15 Multi-Core Performance
In the Cinebench R15 multi-core test, the Intel Xeon w7-2595X scores 7,114 cb, closely trailing the AMD Ryzen 9 9950X, which achieves 7,168 cb. The results suggest that both CPUs perform effectively in workloads that leverage multiple cores, although the Xeon does not take full advantage of its higher core count in this older benchmark version.
Cinebench R20 Multi-Core Performance
Moving to Cinebench R20, the Intel Xeon w7-2595X improves its standing with a score of 18,905 points, outperforming the Ryzen 9 9950X’s 18,032 points. This indicates that the Xeon’s 26-core, 52-thread configuration starts to leverage its parallel processing capabilities more effectively in this benchmark, which utilizes more complex scenes and demands more from the CPU than the R15. This makes the Xeon a slightly better option for newer multi-threaded workloads that can use its extended core count.
Cinebench R23 Performance
The Cinebench R23 multi-core results show a more noticeable lead for the Intel Xeon w7-2595X, which scores 48,442 points compared to the AMD Ryzen 9 9950X’s 45,571 points and significantly outperforms the Dell Precision 3680’s last-gen Intel Core i9-14900K, scoring 35,108 points. This large margin highlights the Xeon’s strength in heavy multi-threaded tasks that can fully exploit its additional cores and threads. However, in the Cinebench R23 single-core test, the Xeon scores 1,715 points, lagging behind the Ryzen 9 9950X (2,296 points) and the Core i9-14900K (2,266 points). This means that while the Xeon excels in multi-threaded tasks, it is less competitive in single-threaded workloads due to its lower clock speeds.
Cinebench 2024 Performance
The Cinebench 2024 results provide further insights into the performance dynamics between these processors. In the multi-core test, the Intel Xeon w7-2595X scores 2,657 points, outperforming the Dell Precision 3680’s score of 1,950 points. The new Xeon CPU’s advantage here reflects its suitability for workloads that continue to scale with core count. In contrast, the Cinebench 2024 single-core test sees the Xeon scoring 103 points. This is, again, significantly lower than the Core i9-14900 K’s 131 points, which further reinforces the Xeon’s relative disadvantage in scenarios where single-thread performance is critical.
| Benchmark | CPU Test | Intel Xeon w7-2595X (26c, 52t) | AMD Ryzen 9 9950X PBO (Zen5, 16c, 32t) | Dell Precision 3680 (Intel Core i9-14900K, 24c, 32t) |
| Cinebench R15 | Multi-Core | 7,114 cb | 7,168 cb | N/A |
| Cinebench R20 | Multi-Core | 18,905 pts | 18,032 pts | N/A |
| Cinebench R23 | Multi-Core | 48,442 pts | 45,571 pts | 35,108 pts |
| Cinebench R23 | Single-Core | 1,715 pts | 2,296 pts | 2,266 pts |
| Cinebench 2024 | Multi-Core | 2,657 pts | N/A | 1,950 pts |
| Cinebench 2024 | Single-Core | 103 pts | N/A | 131 pts |
But Where is Emerald Rapids in Workstation?
When asked for comment from Intel, it was stated that the changes made to the Emerald Rapids, also known as 5th generation Xeon Scalable, were incompatible with the chipsets for workstations and would have resulted in PCIe lane limitations.
Conclusion
The Intel Xeon w7-2595X processor offers a strong option for high-performance workstation applications, particularly in multi-core tasks like 3D rendering, AI development, and data-heavy simulations. Its 26-core, 52-thread design, PCIe 5.0 support, and Intel AMX for AI workloads provide a capable platform. While its single-core performance may not lead in benchmarks compared to alternatives, the Xeon w7-2595X demonstrates reliable multi-threaded performance, making it a solid choice for those seeking scalable, parallel processing power.


 Amazon