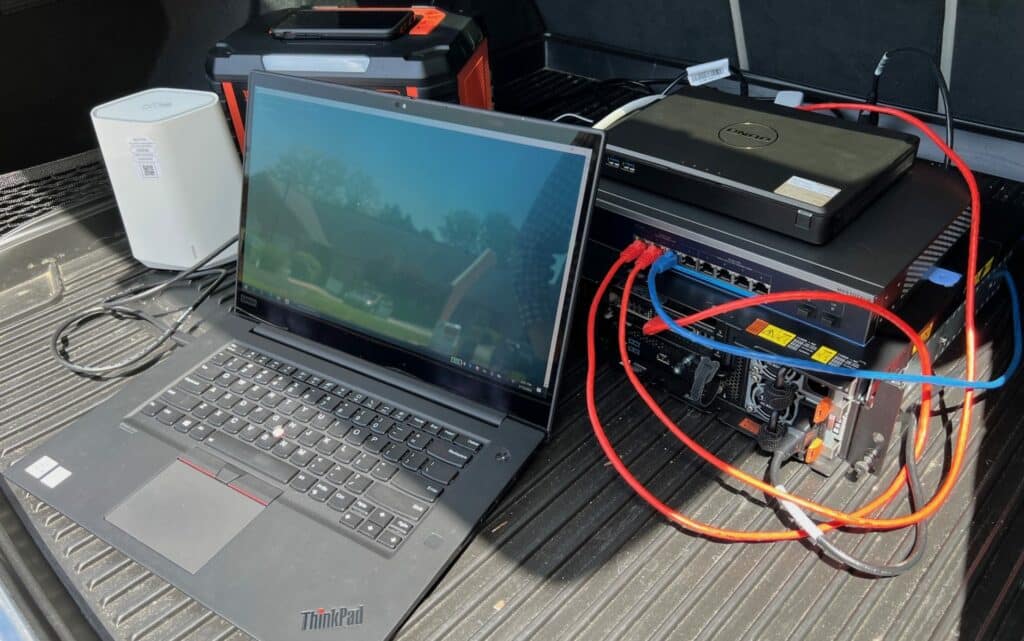
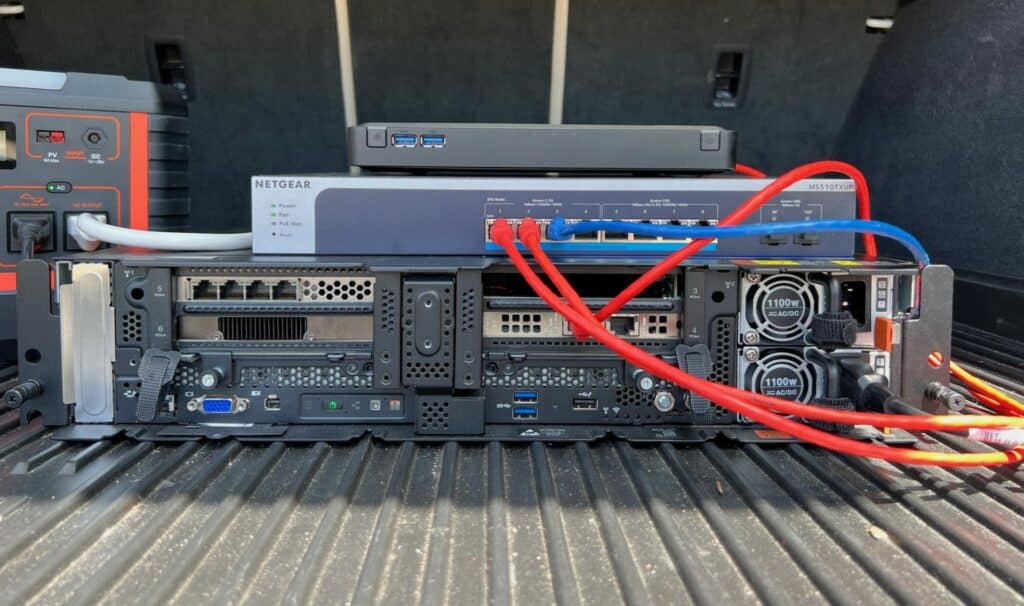
No data center, no problem; Lenovo’s ThinkEdge SE450 edge rugged server can be deployed standalone, outside a data center, and in harsher conditions than normal rack servers. Available in 300mm or 360mm depth, it’s wall-mountable and stackable without a rack, and it can even include 5G wireless connectivity. This single-CPU server is highly configurable for everything from general usage and storage to HPC and AI, and is a great way to bring computing resources where full-scale data centers can’t go.
No data center, no problem; Lenovo’s ThinkEdge SE450 edge rugged server can be deployed standalone, outside a data center, and in harsher conditions than normal rack servers. Available in 300mm or 360mm depth, it’s wall-mountable and stackable without a rack, and it can even include 5G wireless connectivity. This single-CPU server is highly configurable for everything from general usage and storage to HPC and AI, and is a great way to bring computing resources where full-scale data centers can’t go.
Lenovo ThinkEdge SE450 Specifications
The ThinkEdge SE450 is a 2U, single-CPU edge server based on Intel’s third-generation Intel Xeon Scalable “Ice Lake” processors. Despite being much shorter than a normal rackmount server, it has surprisingly good expansion, with up to 1TB of memory (10 DIMM slots, including support for two Intel Optane Persistent Memory modules; the latter can be used to bring the total memory to 1.5TB), six NVMe drives, one OCP 3.0 and four PCIe Gen4 slots.
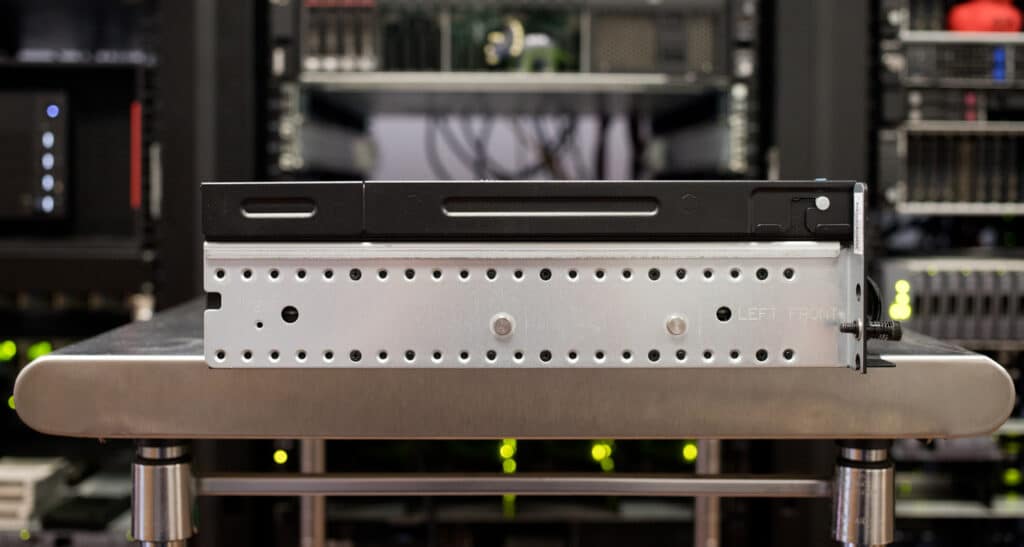
Lenovo ThinkEdge SE450 Side View
It can also accept four GPUs, up to four single-width or two double-wide. The 300mm chassis is limited to half-length cards but the 360mm chassis accepts full-length. Note that most of the expansion is either/or; for instance, installing four expansion cards precludes having internal storage. (More about that in the next section.)
The ThinkEdge SE450 is Lenovo’s high-end edge server. It also offers the ThinkEdge SE350, a smaller 1U model with a broader operating temperature range (0 to 55 degrees C versus the ThinkEdge SE450’s 5 to 45 degrees C). Naturally, it’s not as powerful, only scaling to 16-core Xeon D-2100 processors, 256GB of RAM, and one GPU. It also relies exclusively on M.2 storage. The ThinkEdge SE450 has dual M.2 boot drives but also supports up to six 7mm 2.5-inch drives or two 15mm drives.
The ThinkEdge SE450’s full specifications are as follows:
| Form Factor | 2U rack server 300mm (11.8in) depth with 4 FHHL adapter or 2U rack server 360mm (14.2in) depth with 4 FHFL adapter |
| Processor | Up to 1x 3rd Gen Intel® Xeon® Platinum processor, up to 36 cores, up to 225W TDP |
| Drive Bays | Up to 6x 2.5-inch 7mm drives; Up to 6x NVMe drives supported; 2x M.2 boot drives (RAID 1) |
| Memory | 10x DDR4 memory slots; Maximum 1TB using 8x 128GB 3DS RDIMMs; Supports up to 2x Intel® Optane™ Persistent Memory 200 Series modules (PMem) |
| Expansion Slots | Up to 4x PCIe 4.0 slots, 1x OCP 3.0 slot |
| GPUs | Up to 4x single-width GPUs or 2x double-width GPUs |
| Network Interface | LOM adapter installed in the OCP 3.0 slot; PCIe adapters |
| Ports | Front: 1x Power Button, 1x system locator, health with LED, 1x VGA, 2x USB 3.1, 1x Serial Port (optional), 1x RJ-45 1Gb for dedicated management, 1x system locator LED Optional WIFI (management) |
| HBA/RAID Support | SW RAID standard; optional HW RAID with/without cache or SAS HBAs |
| Power | Dual redundant power supplies AC (up to 1100W Platinum) or Dual redundant power supplies -48V DC 1100W |
| Systems Management | Lenovo XClarity Controller |
| OS Support | Microsoft, Red Hat, Ubuntu, CentOS, VMware. Visit lenovopress.com/osig for details. |
| Limited Warranty | 3-year customer-replaceable unit and onsite service, next business day 9×5; optional service upgrades |
Lenovo ThinkEdge SE450 Build and Design
The ThinkEdge SE450 isn’t your typical rackmount server. The short depth 300mm (11.8-inch) chassis we’re testing is an obvious difference, though as mentioned it can also be had in a longer 360mm chassis should you need full-length accelerator cards. It can, of course, be rack-mounted, being the standard 434mm (17.1-inch) width. Here’s what it looks like mixed into one of ours:
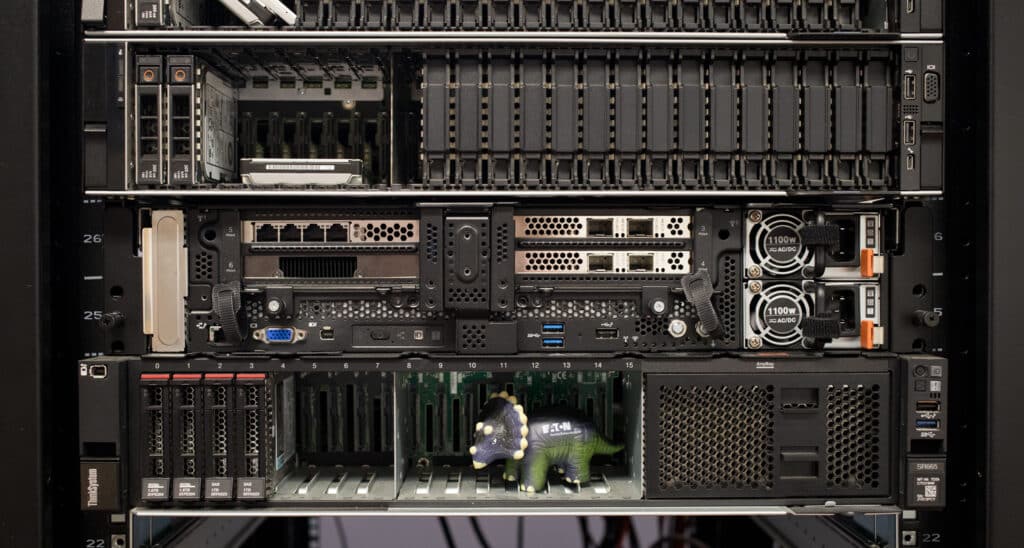
Lenovo ThinkEdge SE450 Racked In-Lab
But the idea with an edge server is that it’s usable where a typical rackmount server isn’t – that is, outside the data center. The ThinkEdge SE450’s 300mm short depth makes it wall- or shelf-mountable or even usable on the floor or on top of a desk. Its wide operating temperature range (5 to 45 degrees C) means it doesn’t require tight environmental controls, either.
The server’s front, shown below, has all the connectivity, which includes VGA, two USB 3.2 Gen 1 Type-A ports, one USB 2.0 service port, and dedicated Ethernet for IPMI 2.0.
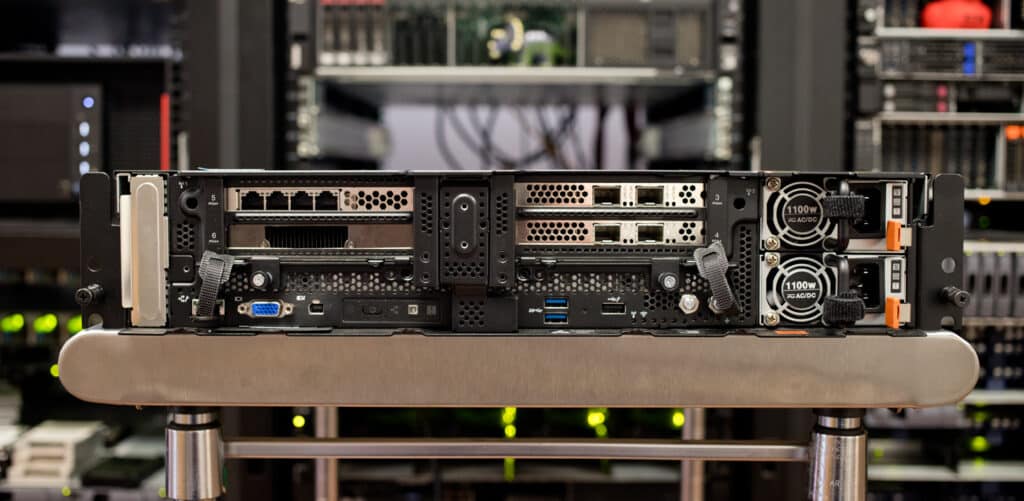
Lenovo ThinkEdge SE450 Front-Facing Connectivity
Remote management support offers a few options including Redfish support. You can also see server status and use management functions through the Lenovo XClarity Mobile app (Android/iOS), which requires you to connect to the server through the USB service port. XClarity support is courtesy of a built-in XClarity Controller. Lenovo offers different XClarity tiers; the Advanced tier gives you remote control functions and Enterprise allows you to mount media files. XClarity is an important feature for an edge server since a console might not be available.
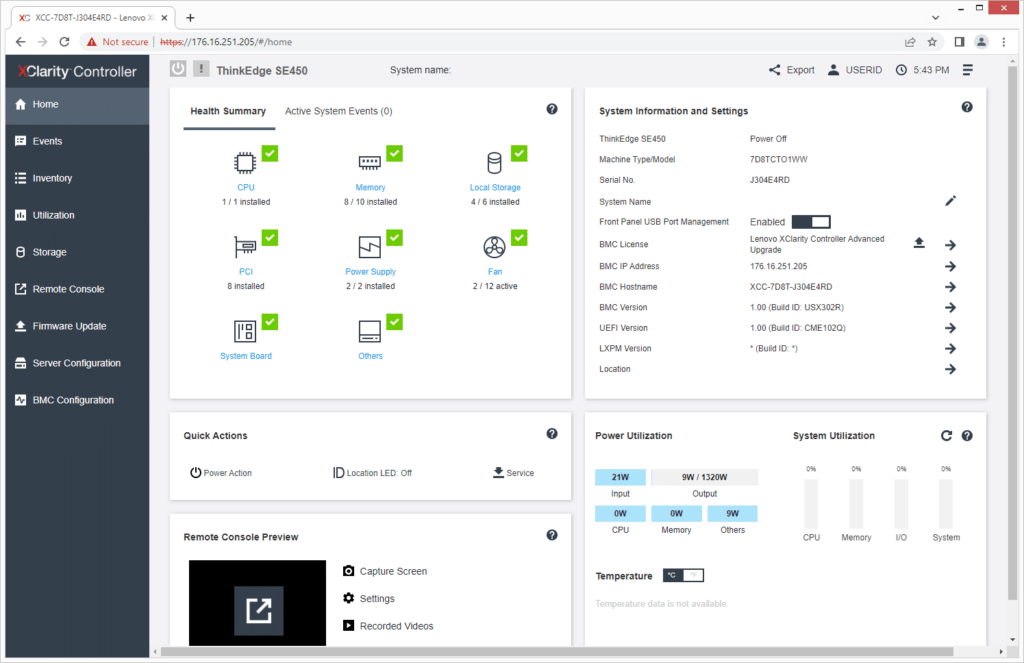
Here’s what XClarity provides through a standard web browser. The Home landing screen starting with an overall summary and settings plus quick actions. It also tracks power and utilization stats.
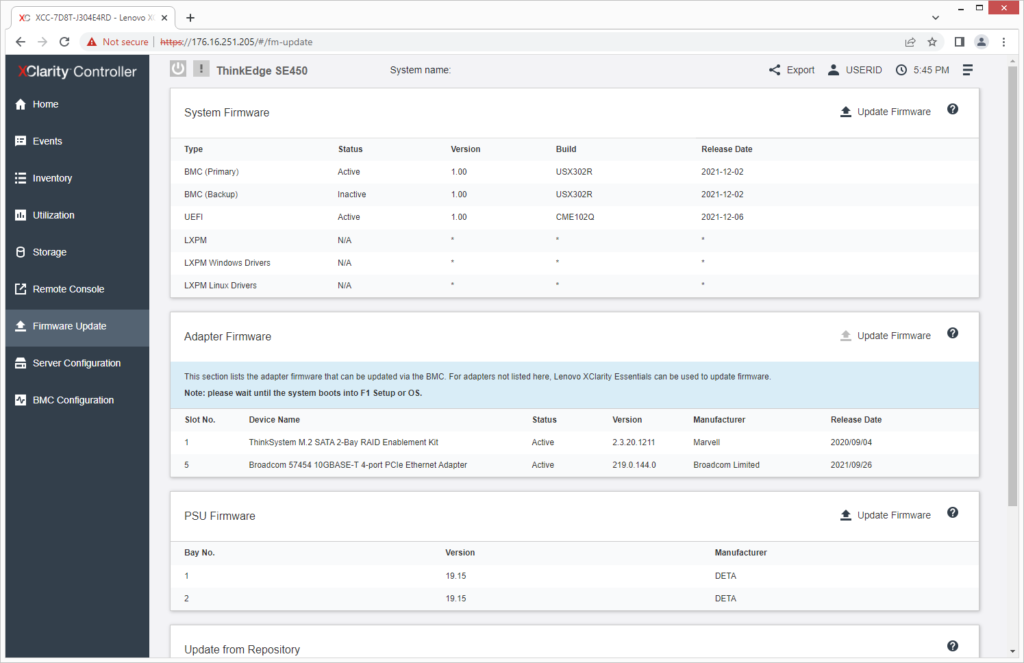
It also makes identifying and updating server firmware seamless.
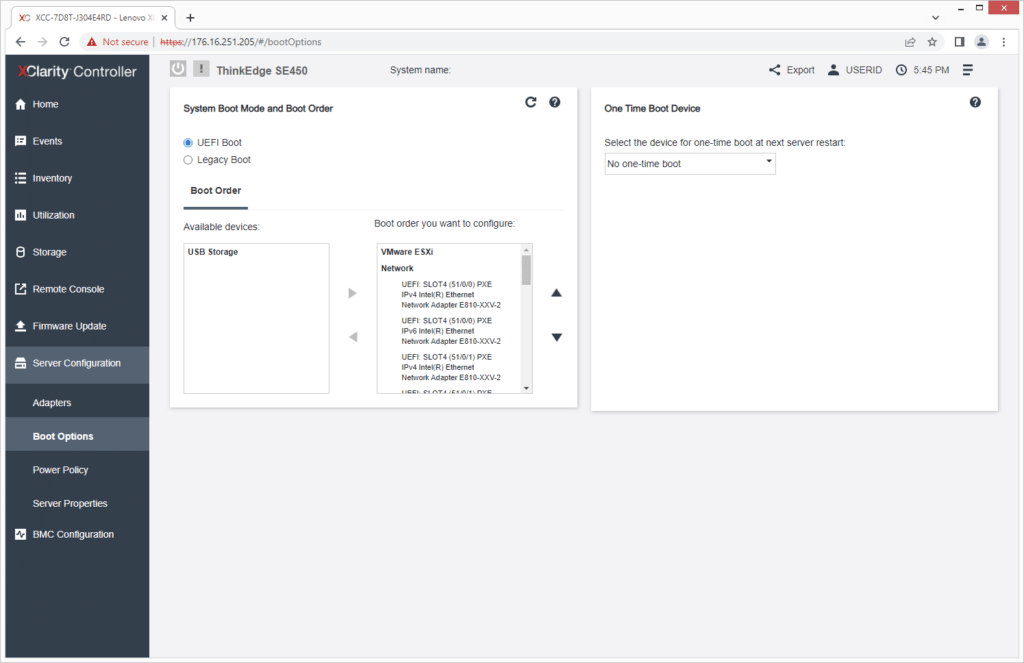
Boot and one-time boot options can be set from Server Configuration.
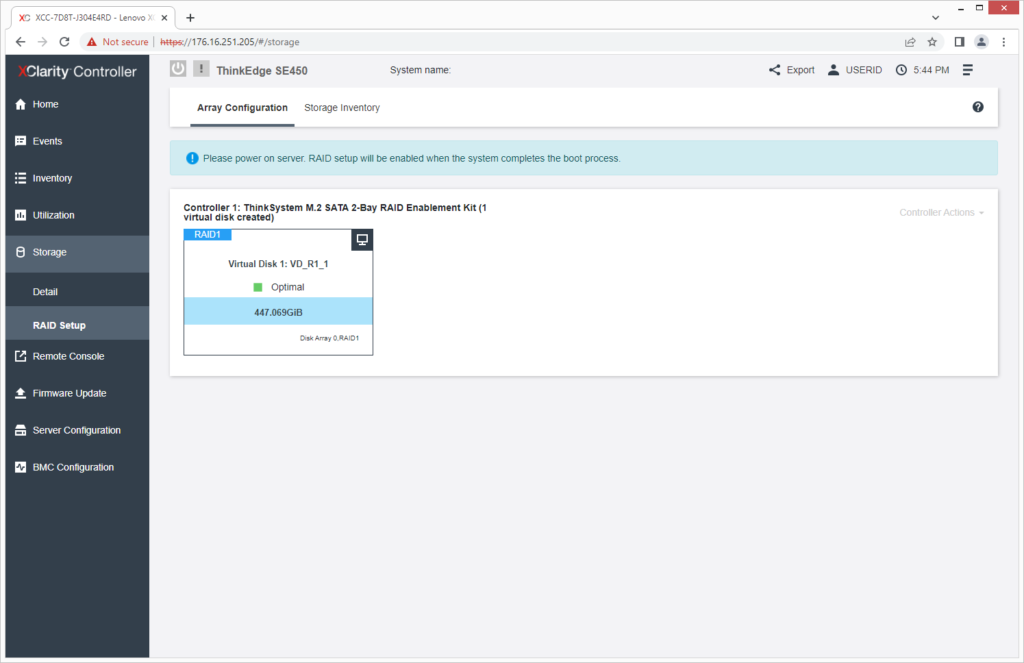
XClarity also allows you to control RAID settings; below is for the two boot drives.
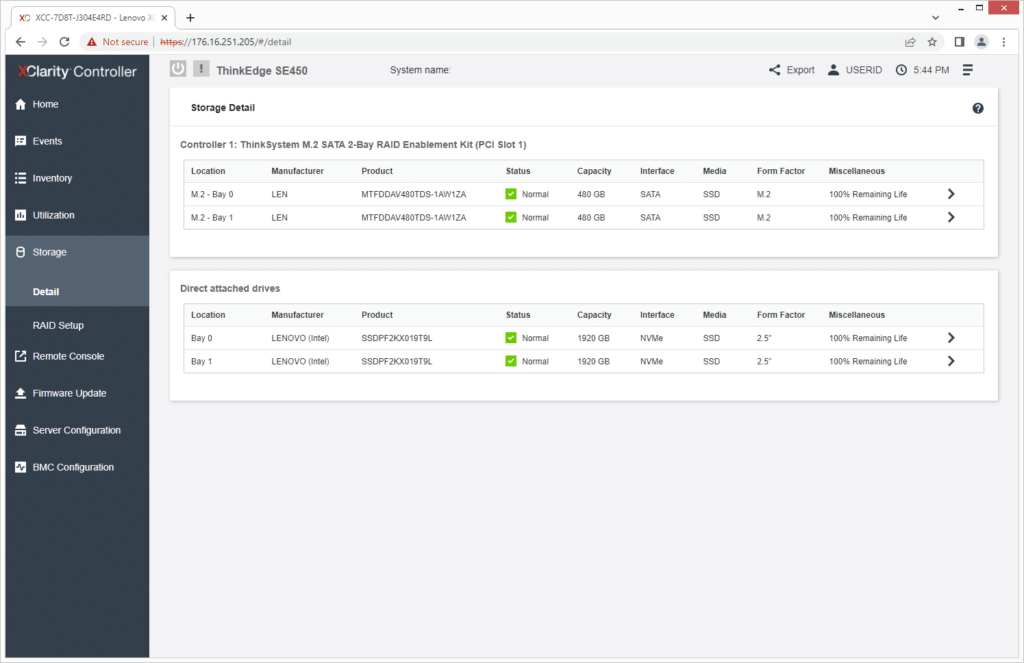
Selecting a storage device gives you details such as status and capacity.
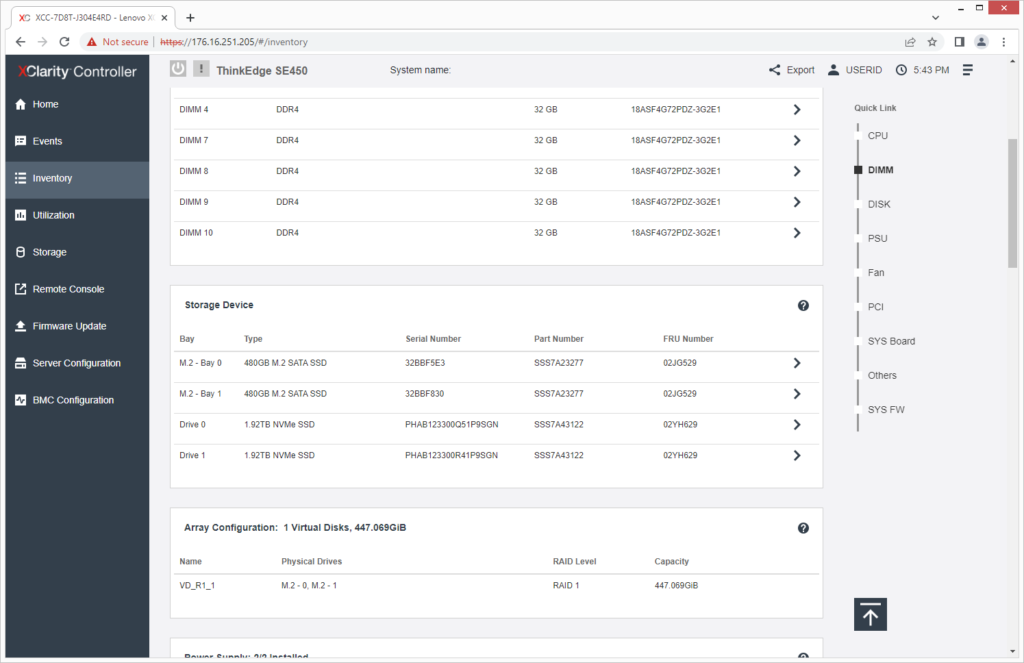
Notice the quick nav bar on the right in the Inventory section; you can access all server configuration information with just a few clicks.
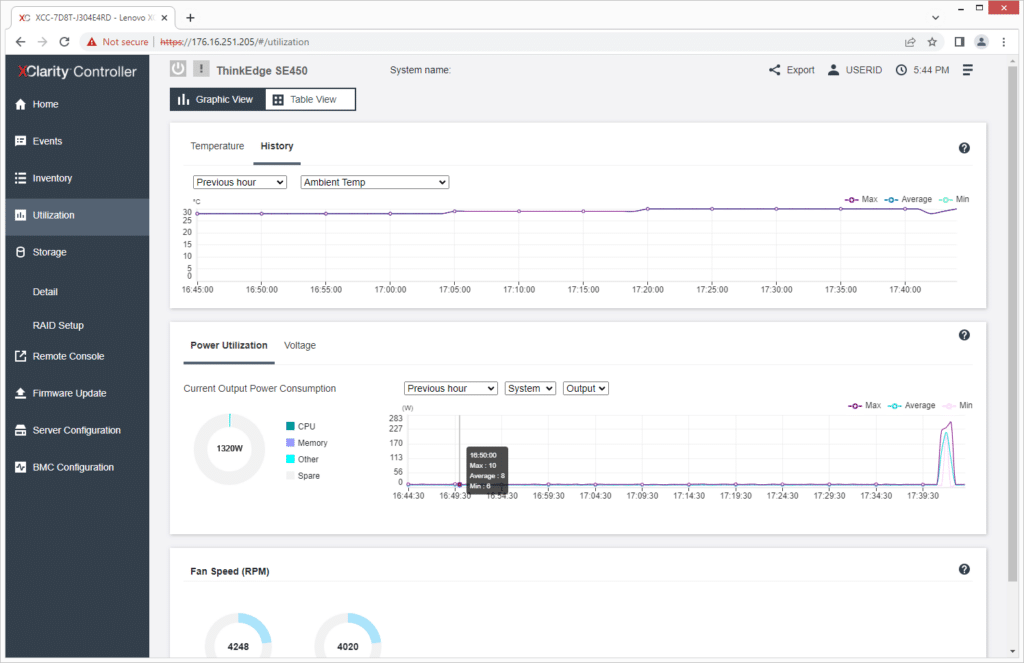
Finally, the Utilization section shows important status such as temperature and power utilization, including history.
Back to the physical realm, the ThinkEdge SE450’s front has the expected status LEDs plus one for Wi-Fi signal strength. Our unit doesn’t have wireless (it’s slated for availability later in 2022) but it does have two PCIe network cards, a Broadcom card with four 1GbE and an Intel E810-DA2 with two 10/25GbE. Far-right are the redundant power supplies. Our unit has the most powerful 1100W Platinum models.
Granted, all that connectivity is out in the open isn’t ideal if you’re outside a data center. The ThinkEdge SE450 has an optional locking front security bezel that covers all ports and supports a dust filter for high-dust environments yet still allows you to see the status LEDs. The lid is also under lock and key.
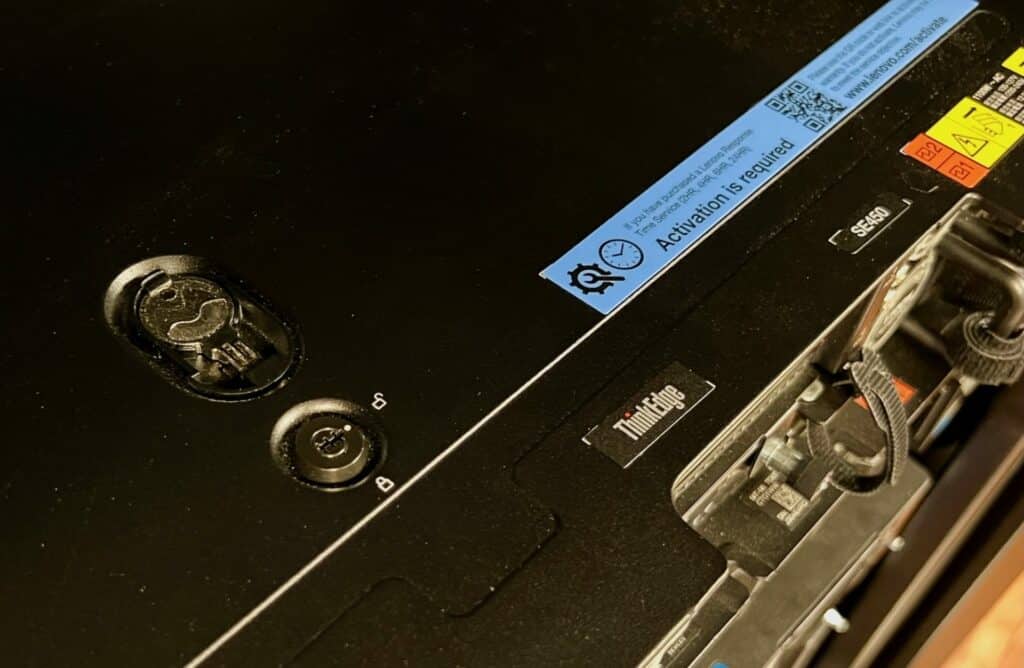
Lenovo ThinkEdge SE450 Lock
As expected, there are no features on the sides, but this view does remind us how small this package really is.
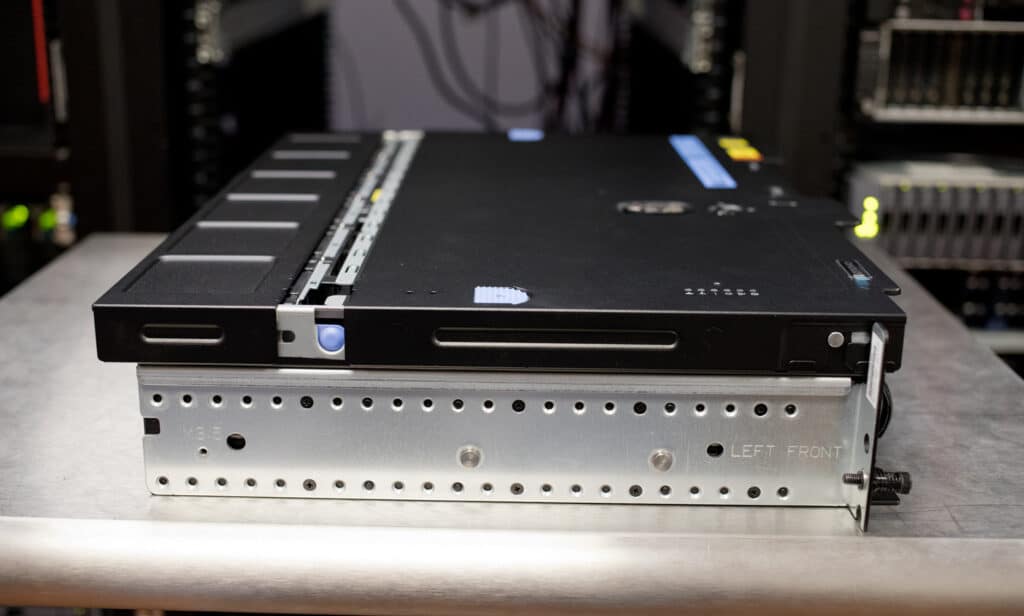
Lenovo ThinkEdge SE450 Side
And now we’ll get inside. The single CPU is dead center and topped by a passive heatsink. The expansion cards on risers flank it. The OCP 3.0 slot isn’t visible here but is immediately left of the first (left) riser.
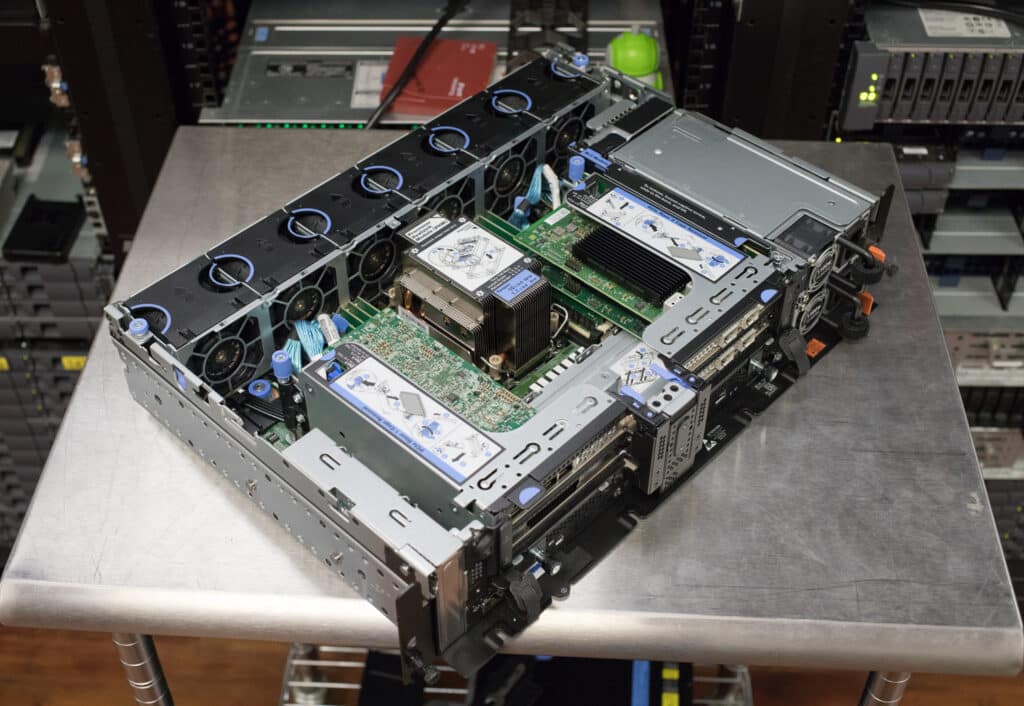
Lenovo ThinkEdge SE450 Lid Removed
The expansion cards mostly block the view of the 10 DIMM slots, five on either side of the CPU, though you can see them in the second photo below where the six simple-swap fans are removed.
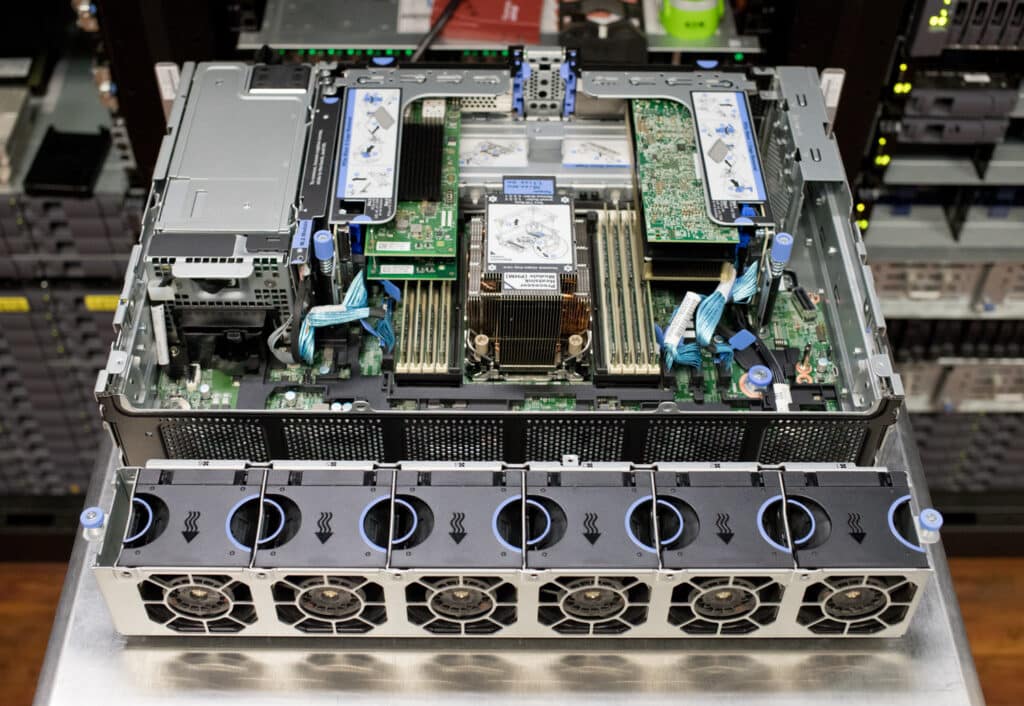
Lenovo ThinkEdge SE450 Fans Removed
Achieving the ThinkEdge SE450’s 1TB of RAM ceiling means using only eight of the slots for 256GB 3DS RDIMMs; the two black slots are only reserved for persistent memory. (You could technically get up to 1.5TB of RAM with four 128GB RDIMMs and four 256GB persistent memory modules.) The photo above also shows how the four PCIe expansion cards fit on the risers. The M.2 boot drive bracket is the black strip next to the power supplies. It supports 42 to 110mm drives and has hardware RAID 1.
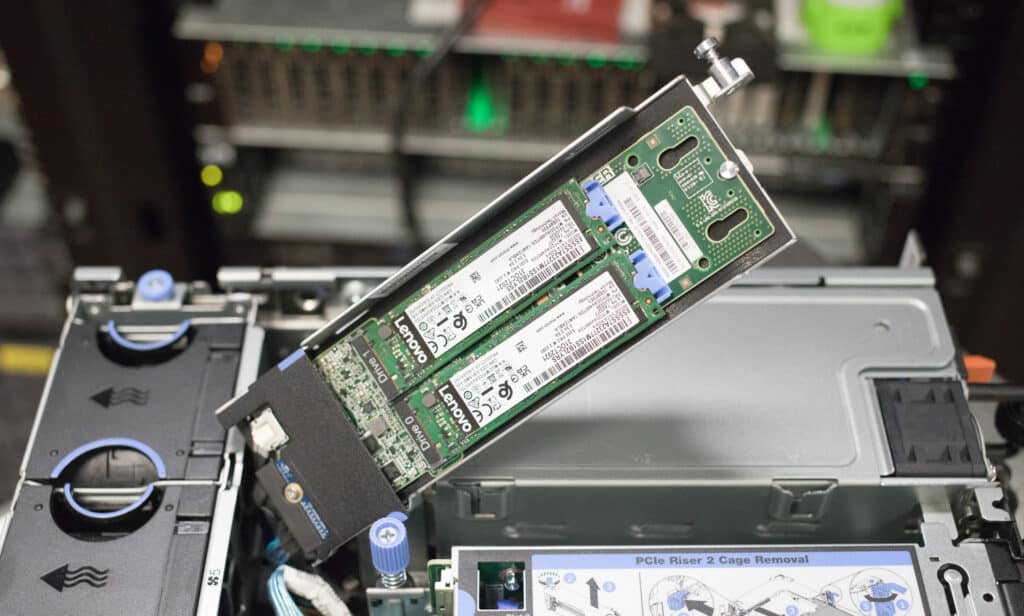
Lenovo ThinkEdge SE450 M.2 Storage
The optional internal drive cage goes under the PCIe expansion cards, accommodating four 7mm or two 15mm drives, an ideal spot since they would be unaffected by CPU temperatures. The ThinkEdge SE450 can additionally be outfitted with a drive bay supporting two 2.5-inch hot-swap drives next to the power supply, replacing the second riser. These are the supported drive bay combinations:
- Up to 4x internal SATA drives (no hot-swap drives)
- Up to 4x internal NVMe drives (no hot-swap drives)
- Up to 4x internal SATA drives + 2x hot-swap SATA drives
- Up to 4x internal SATA drives + 2x hot-swap NVMe drives
- Up to 2x internal NVMe drives + 2x hot-swap SATA drives
- Up to 2x internal NVMe drives + 2x hot-swap NVMe drives
Importantly (and unfortunately), the ThinkEdge SE450 must be ordered with the drive bays from the get-go as field upgrades aren’t available. Also note that if drives are installed, the server’s maximum operating temperature is reduced to 35 or 40 degrees C, depending on the drive configuration.
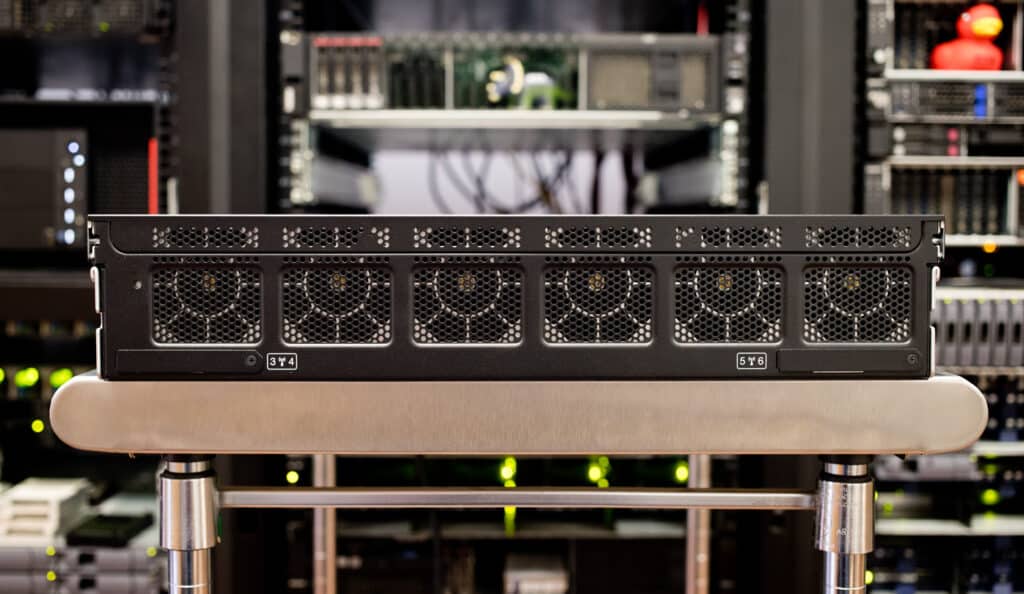
Lenovo ThinkEdge SE450 Rear
Lenovo ThinkEdge SE450 Performance
The ThinkEdge SE450 we’re testing is equipped with these components:
- Intel Xeon Gold 6338N CPU (32-core/64-thread, 2.2GHz base, 3.5GHz Turbo, 185-watt TDP, 64 PCIe lanes)
- 256GB DDR4-3200 ECC RAM (32GB x8)
- 2x 1.92TB Intel P5500 NVMe SSDs
- One Nvidia T4 or A2 Tensor Core GPU
This configuration isn’t quite maxed out, especially in memory, though it’s a fair representation of the server’s capabilities. In addition to our standard tests, we will have several GPU-heavy tests where we benchmark the ThinkEdge SE450 with a single Nvidia T4 and A2 Tensor Core GPU. Let’s go.
SQL Server Performance
StorageReview’s Microsoft SQL Server OLTP testing protocol employs the current draft of the Transaction Processing Performance Council’s Benchmark C (TPC-C), an online transaction processing benchmark that simulates the activities found in complex application environments. The TPC-C benchmark comes closer than synthetic performance benchmarks to gauging the performance strengths and bottlenecks of storage infrastructure in database environments.
Each SQL Server VM is configured with two vDisks: 100GB volume for boot and a 500GB volume for the database and log files. From a system resource perspective, we configured each VM with 16 vCPUs, 64GB of DRAM and leveraged the LSI Logic SAS SCSI controller. While our Sysbench workloads tested previously saturated the platform in both storage I/O and capacity, the SQL test looks for latency performance.
SQL Server Testing Configuration (per VM)
- Windows Server 2012 R2
- Storage Footprint: 600GB allocated, 500GB used
- SQL Server 2014
- Database Size: 1,500 scale
- Virtual Client Load: 15,000
- RAM Buffer: 48GB
- Test Length: 3 hours
- 5 hours preconditioning
- 30 minutes sample period
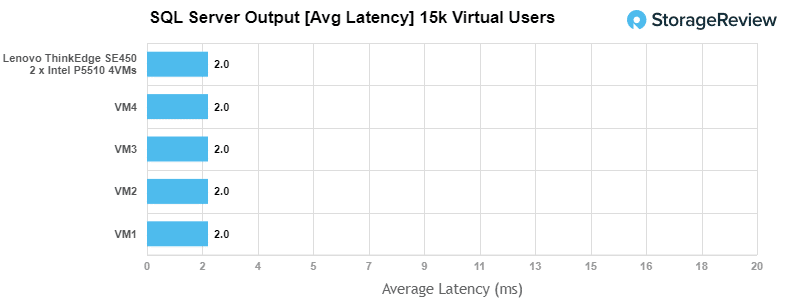
In our SQL Server test we were able to fit 4 of our SQL VMs onto the Lenovo ThinkEdge SE450 with 256GB RAM. We used an even split of 2 VMs per SSD, which offered an average latency of 2ms across the board.
Our first local-storage application benchmark consists of a Percona MySQL OLTP database measured via SysBench. This test measures average TPS (Transactions Per Second), average latency, and average 99th percentile latency as well.
Each Sysbench VM is configured with three vDisks: one for boot (~92GB), one with the pre-built database (~447GB), and the third for the database under test (270GB). From a system resource perspective, we configured each VM with 16 vCPUs, 60GB of DRAM and leveraged the LSI Logic SAS SCSI controller.
Sysbench Testing Configuration (per VM)
- CentOS 6.3 64-bit
- Percona XtraDB 5.5.30-rel30.1
- Database Tables: 100
- Database Size: 10,000,000
- Database Threads: 32
- RAM Buffer: 24GB
- Test Length: 3 hours
- 2 hours preconditioning 32 threads
- 1 hour 32 threads
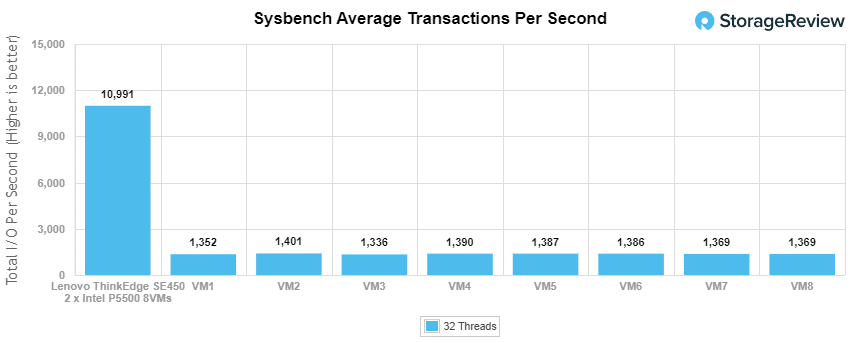
Having only two NVMe drives in our ThinkEdge SE450 doesn’t lead to high Sysbench average transactions per second; it managed 10,991 TPS while the VMs ranged from 1,352 to 1,401 TPS.
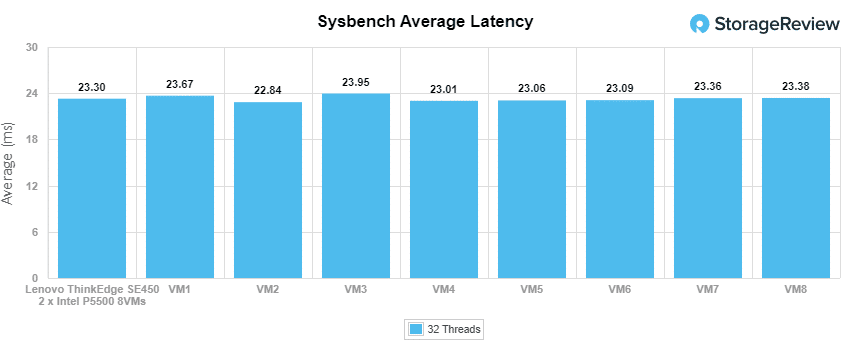
Sysbench average latencies were also high, ranging 22.84ms to 23.95ms.
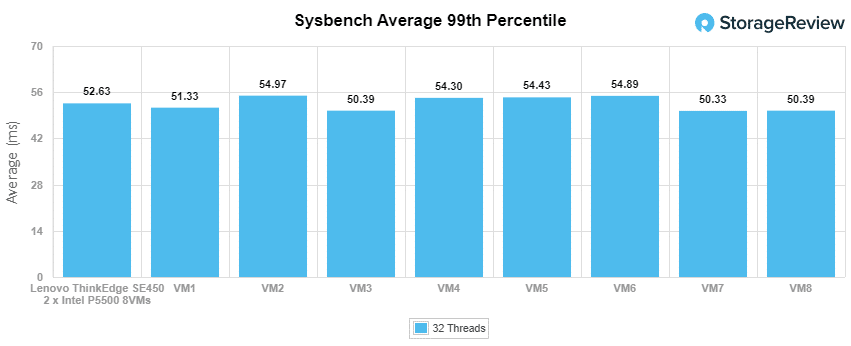
Our last Sysbench test is 99th percentile where we saw an average 52.63ms latency. The VMs ranged between 50.33 to 54.97ms.
VDBench Workload Analysis
When it comes to benchmarking storage devices, application testing is best, and synthetic testing comes in second place. While not a perfect representation of actual workloads, synthetic tests do help to baseline storage devices with a repeatability factor that makes it easy to do apples-to-apples comparison between competing solutions.
These workloads offer a range of different testing profiles ranging from “four corners” tests, common database transfer size tests, as well as trace captures from different VDI environments. All of these tests leverage the common vdBench workload generator, with a scripting engine to automate and capture results over a large compute testing cluster. This allows us to repeat the same workloads across a wide range of storage devices, including flash arrays and individual storage devices.
Profiles:
- 4K Random Read: 100% Read, 128 threads, 0-120% iorate
- 4K Random Write: 100% Write, 128 threads, 0-120% iorate
- 64K Sequential Read: 100% Read, 32 threads, 0-120% iorate
- 64K Sequential Write: 100% Write, 16 threads, 0-120% iorate
- Synthetic Database: SQL and Oracle
- VDI Full Clone and Linked Clone Traces
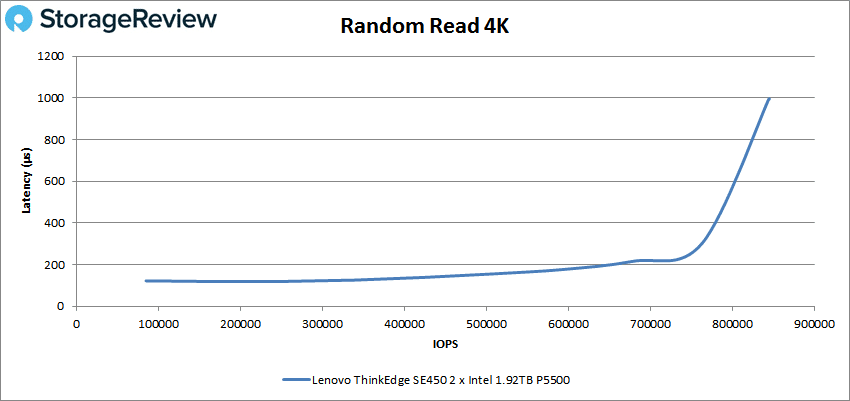
We start with random read 4K. The ThinkEdge SE450 performed well enough given its two-drive configuration, maintaining sub-200µs latency through 600,000 IOPS then spiking to end at 844,965 IOPS with 993µs latency. It could have performed better with faster NVMe drives, such as the Intel P5510.
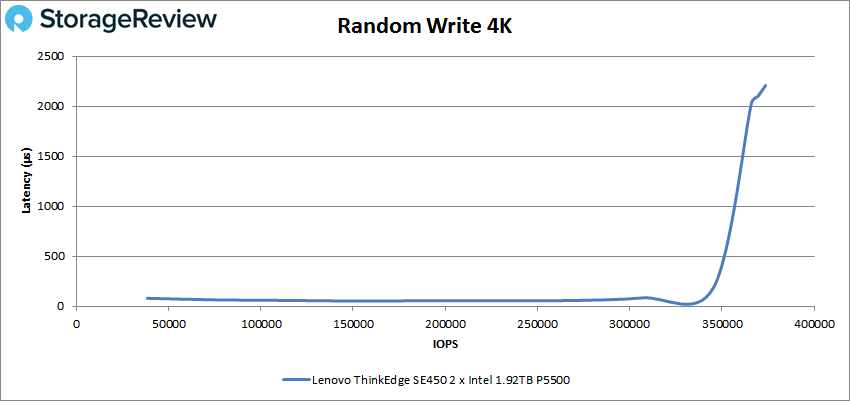
The random write 4K results are similar, the ThinkEdge SE450 showing stable performance right up to the end; it finished at 373,645 IOPS with 2.2ms latency.
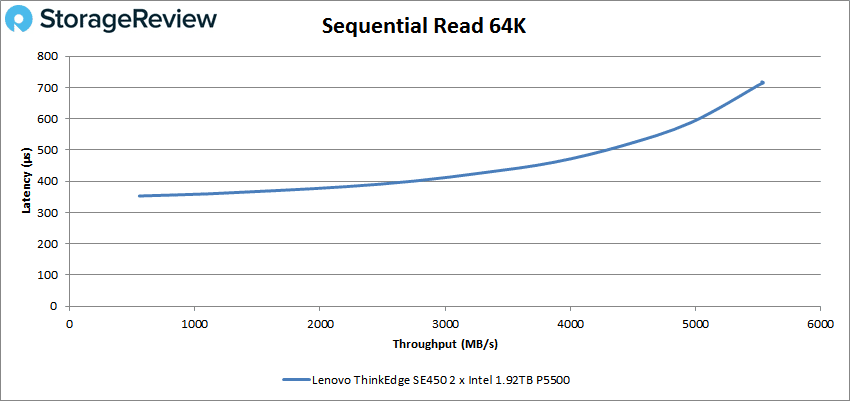
Sequential read 64K is next. Its best showing was 5,527MB/s at 718µs latency.
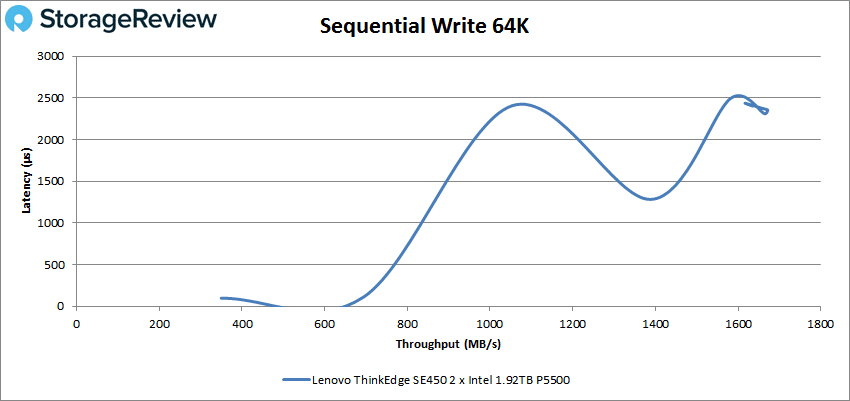
In sequential write 64K, the ThinkEdge SE450 showed instability past 700MB/s. It had a top-end range measuring 1,671MB/s at 2.35ms.
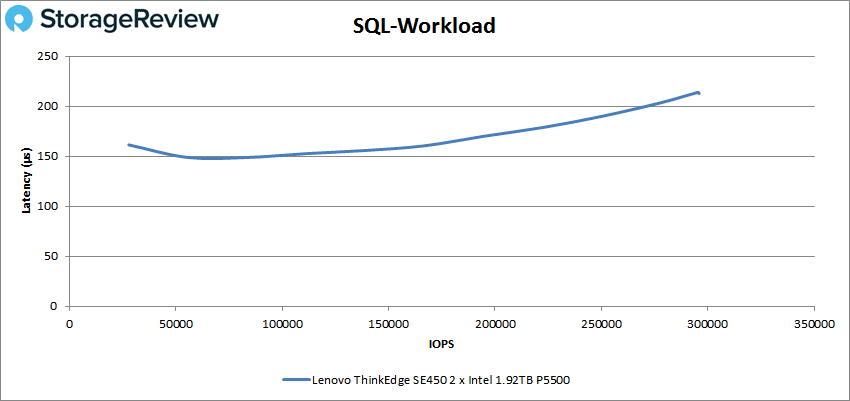
We now move into our SQL workload tests: SQL, SQL 90-10, and SQL 80-20. SQL is first, where we see a reasonable curve. Latencies stayed relatively low until about 154µs/141,167 IOPS and ending at 204µs/304,276 IOPS.
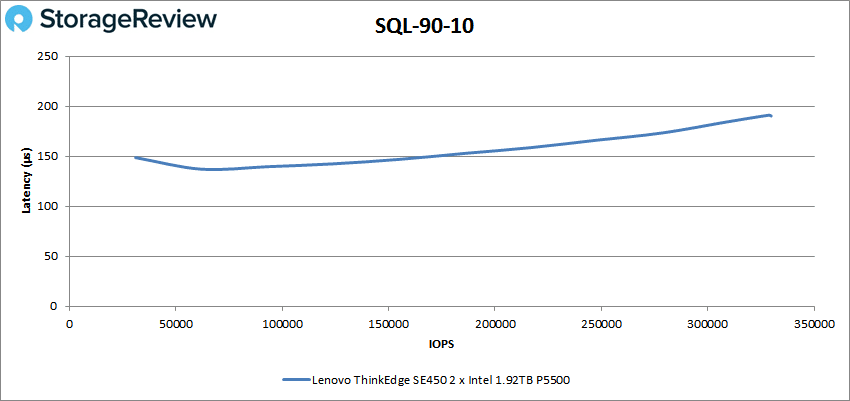
The curve looked similar in SQL 90-10, the final number being 329,769 IOPS at 190µs latency.
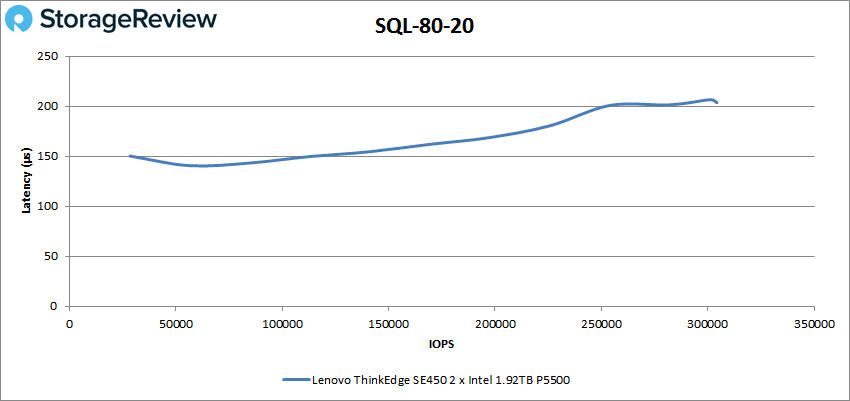
The SQL 80-20 curve shows slight instability towards the end; the finishing number is 304,276 IOPS/204µs latency.
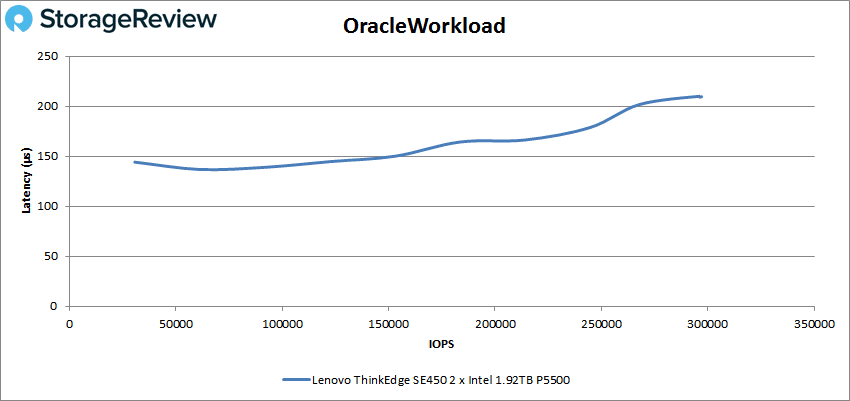
Next up are our Oracle workload tests: Oracle, Oracle 90-10, and Oracle 80-20. In the first test, Oracle, the ThinkEdge SE450 maintained reasonably low latencies and completed the test at 297,096 IOPS and 210µs latency.
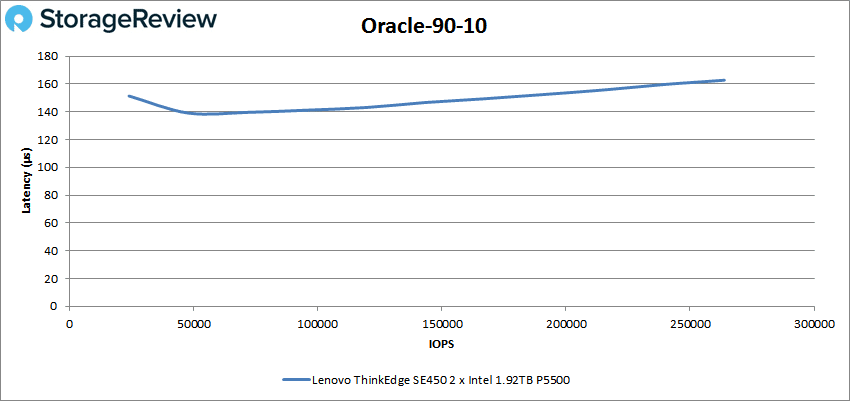
ThinkEdge SE450 showed lower, stabler latencies in Oracle 90-10; the top number is 236,805 IOPS at 163µs latency.
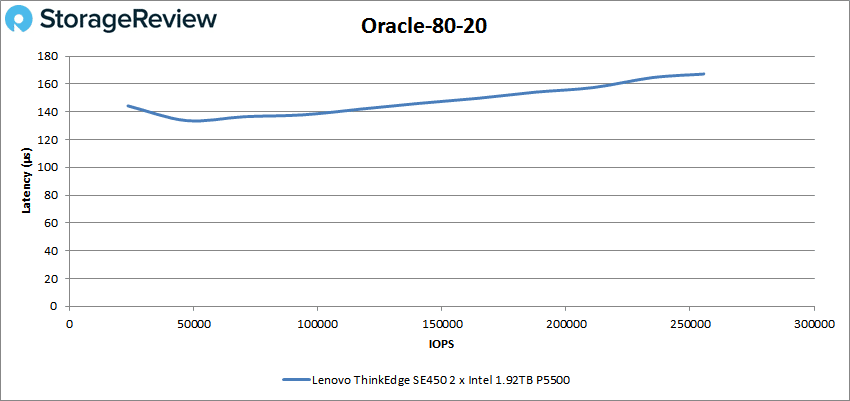
The numbers continue looking good in Oracle 80-20. The lowest latency is 134µs at 46,988 IOPS.
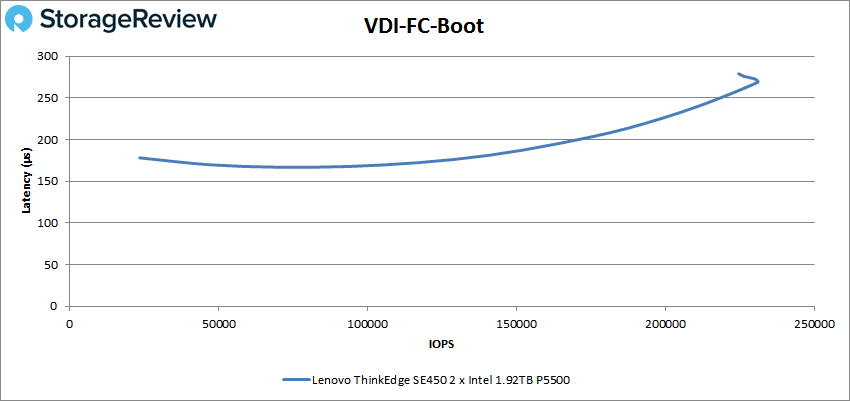
The final tests in this group are VDI Full Clone (FC) and Linked Clone (LC). First is VDI FC Boot; the ThinkEdge SE450 showed a touch of instability at the end, where it achieved 224,661 IOPS at 279µs latency.
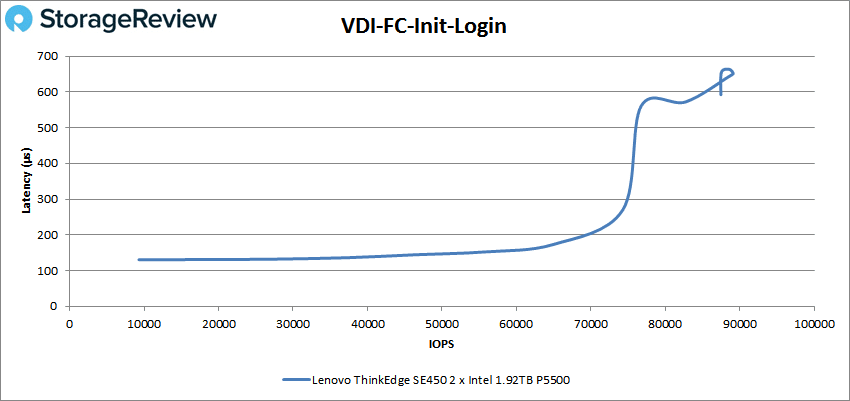
We saw significant instability in VDI FC Initial Login, latencies spiking right after 74,293 IOPS at 270µs latency.
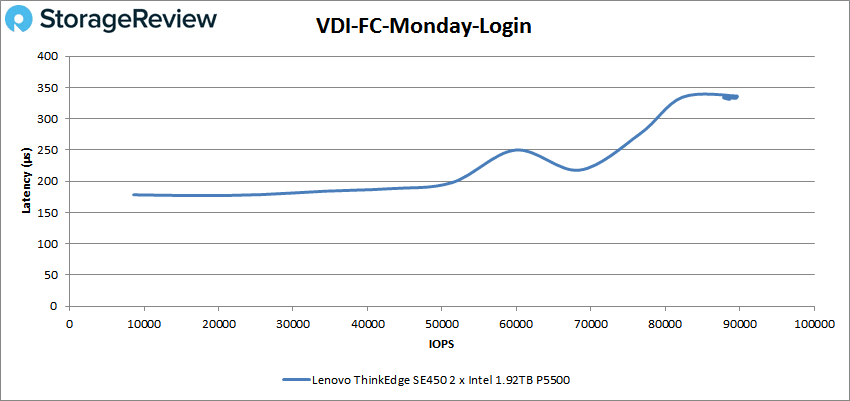
The instability wasn’t as bad in VDI FC Monday Login. The ThinkEdge SE450 reached 88,676 IOPS at 332µs latency.
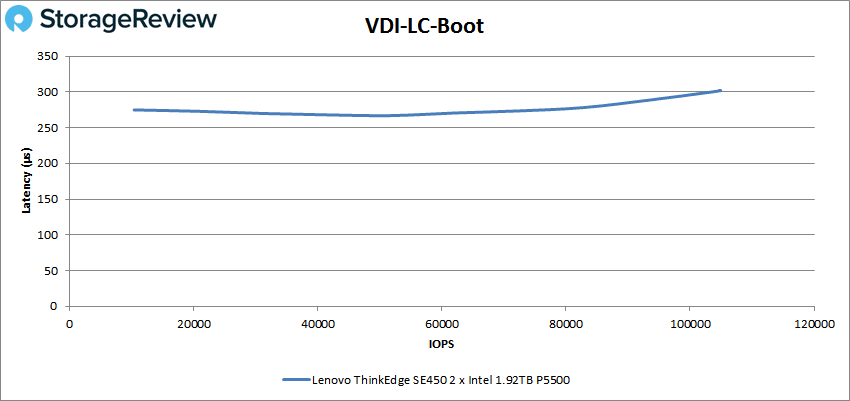
Now we’ll looked at the Linked Clone (LC) tests, starting with VDI LC Boot. The ThinkEdge SE450 produced a nice, stable curve, ending at 104,925 IOPS at 302µs latency.
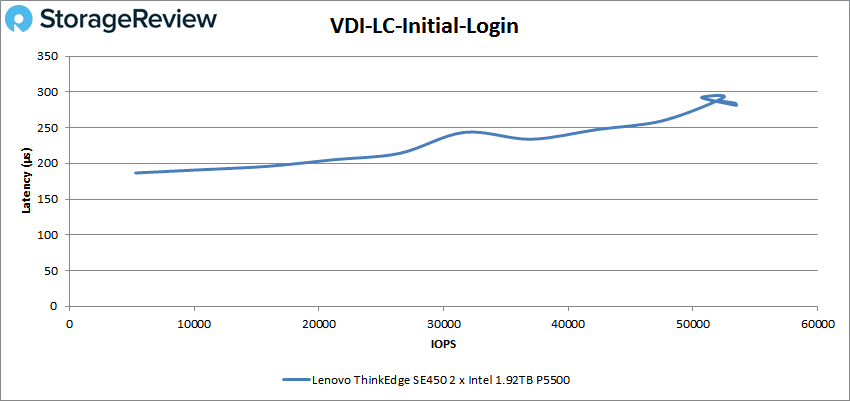
We see some instability at the tail end of VDI LC Initial Login, though not as bad as it was in VDI FC Initial Login. The ThinkEdge SE450’s final number was 53,261 IOPS at 283µs latency.
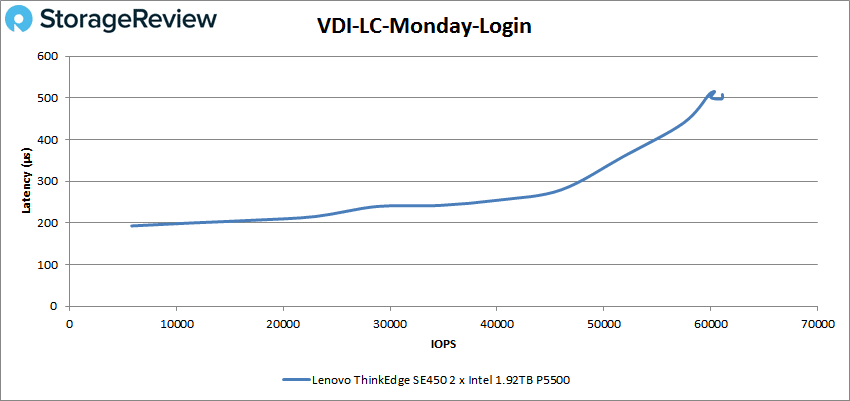
Last in the VDI LC tests is Monday Login. This also looks better than VDI FC Monday Login. The ThinkEdge SE450 finished at 61,091 IOPS at 508µs latency.
Luxmark
Now we’ll move on to tests we normally don’t run on servers, but the ThinkEdge SE450’s versatility demands it. We’re testing with the Nvidia A2 Tensor Core and the Tesla 4 (T4) graphics cards. Using a Windows 11 guest VM with the full card offered to it in passthrough-mode, we ran benchmarks on the VM over a VMware Horizon View client. The guest VM had the VMware direct connect drivers installed to allow connection without a broker. The VM leveraged for these tests was allocated 8 vCPUs and 32GB of RAM.
The A2 is based on the newer “Ampere” instead of “Turing” architecture like the T4. In isolated cases, Nvidia claims the A2 is 1.2X to 1.3X faster than the T4 despite having a 40-60-watt TDP compared to the T4’s 65-70 watts. Either GPU is ideal for the ThinkEdge SE450 because of its low-profile, low-power nature. Equipped with GPUs, the ThinkEdge SE450 could be an AI inference/hybrid cloud platform.
We start the testing with LuxMark, an OpenCL GPU benchmarking utility. This test relies more on GPU brute power, and so the ThinkEdge SE450 performed much better with the T4.
| Category | Lenovo ThinkEdge SE450 (Nvidia A2) | Lenovo ThinkEdge SE450 (Nvidia T4) |
| hallbench | 3422 | 5836 |
| food | 1238 | 2024 |
OctaneBench
Next, we look OctaneBench, a benchmarking utility for OctaneRender, which is another 3D renderer with RTX support that is similar to V-Ray. Higher scores are better. The T4-equipped ThinkEdge SE450 continued to pull ahead as this test doesn’t take explicit advantage of the A2’s more advanced Ampere architecture, either.
| Scene | Kernel | Lenovo ThinkEdge SE450 (Nvidia A2) | Lenovo ThinkEdge SE450 (Nvidia T4) |
| Interior | Info channels | 4.4 | 6.2 |
| Interior | Direct lighting | 13.23 | 21.55 |
| Interior | Path tracing | 16.5 | 25.73 |
| Idea | Info channels | 2.68 | 3.81 |
| Idea | Direct lighting | 10.71 | 16.56 |
| Idea | Path tracing | 12.93 | 19.99 |
| ATV | Info channels | 6.23 | 9.26 |
| ATV | Direct lighting | 14.05 | 21.52 |
| ATV | Path tracing | 17.48 | 26.86 |
| Box | Info channels | 3.68 | 5.20 |
| Box | Direct lighting | 13.28 | 20.58 |
| Box | Path tracing | 14.73 | 23.03 |
Blender OptiX
Our last test is Blender, an open-source 3D modeling application. This benchmark was run using the Blender Benchmark utility. NVIDIA OptiX was the chosen render method. The score is in samples per minute, with higher being better. As in LuxMark and OctaneBench, the A2-equipped ThinkEdge SE450 trailed its T4 cousin by a significant margin. See our Nvidia RTX A6000 review for a look at how Ampere can be faster than Turing. It depends on the application.
| Category | Lenovo ThinkEdge SE450 (Nvidia A2) | Lenovo ThinkEdge SE450 (Nvidia T4) |
| classroom | 257.3 | 516.3 |
| monster | 486.3 | 985.6 |
| junkshop | 298.2 | 563.0 |
Conclusion
The Lenovo ThinkEdge SE450 is radically different than a typical rackmount server, designed to operate outside the data center in minimally controlled environments. For one, it can fit in more places, thanks to its 300mm or 360mm chassis depth, and it doesn’t need to be in a rack (though it can be). Its optional security bezel prevents port access and accommodates a dust filter. The operating temperature range is an impressive 5 to 45 degrees C.
This unconventional server’s performance and expansion don’t disappoint. Based on a single 3rd generation Intel Xeon Scalable processor with up to 36 cores and supporting up to six NVMe drives with 1TB of RAM (or 1.5TB with persistent memory). Chassis depth limits expansion, so it can’t fit many drives if you want to use its four PCIe slots (plus one OCP), which can be used to add half- or full-length GPUs or other cards of your choosing. Therein lies the ThinkEdge SE450’s versatility; it could be a hybrid cloud storage platform, a database server, AI/VDI, and so on, all in a transportable design that isn’t particularly environment-sensitive.
The ThinkEdge SE450 also doesn’t sacrifice remote management, with a dedicated XClarity controller. That allows it to be controlled from a mobile Android or iOS device – no need for a console. There’s also Redfin support for those who have scripts or methodologies there. And did we mention Lenovo’s going to be adding 5G wireless connectivity, so you won’t even need to hardwire it?
Overall, the ThinkEdge SE450 is remarkably flexible and a great way to bring formidable computing resources to places where data centers aren’t practical. We already loved the SE350, the SE450 builds on that amazing edge pedigree. We think Lenovo customers will be equally enamored by this latest effort, discovering all sorts of new use cases for this small and mighty server.
Engage with StorageReview
Newsletter | YouTube | Podcast iTunes/Spotify | Instagram | Twitter | Facebook | TikTok | RSS Feed

