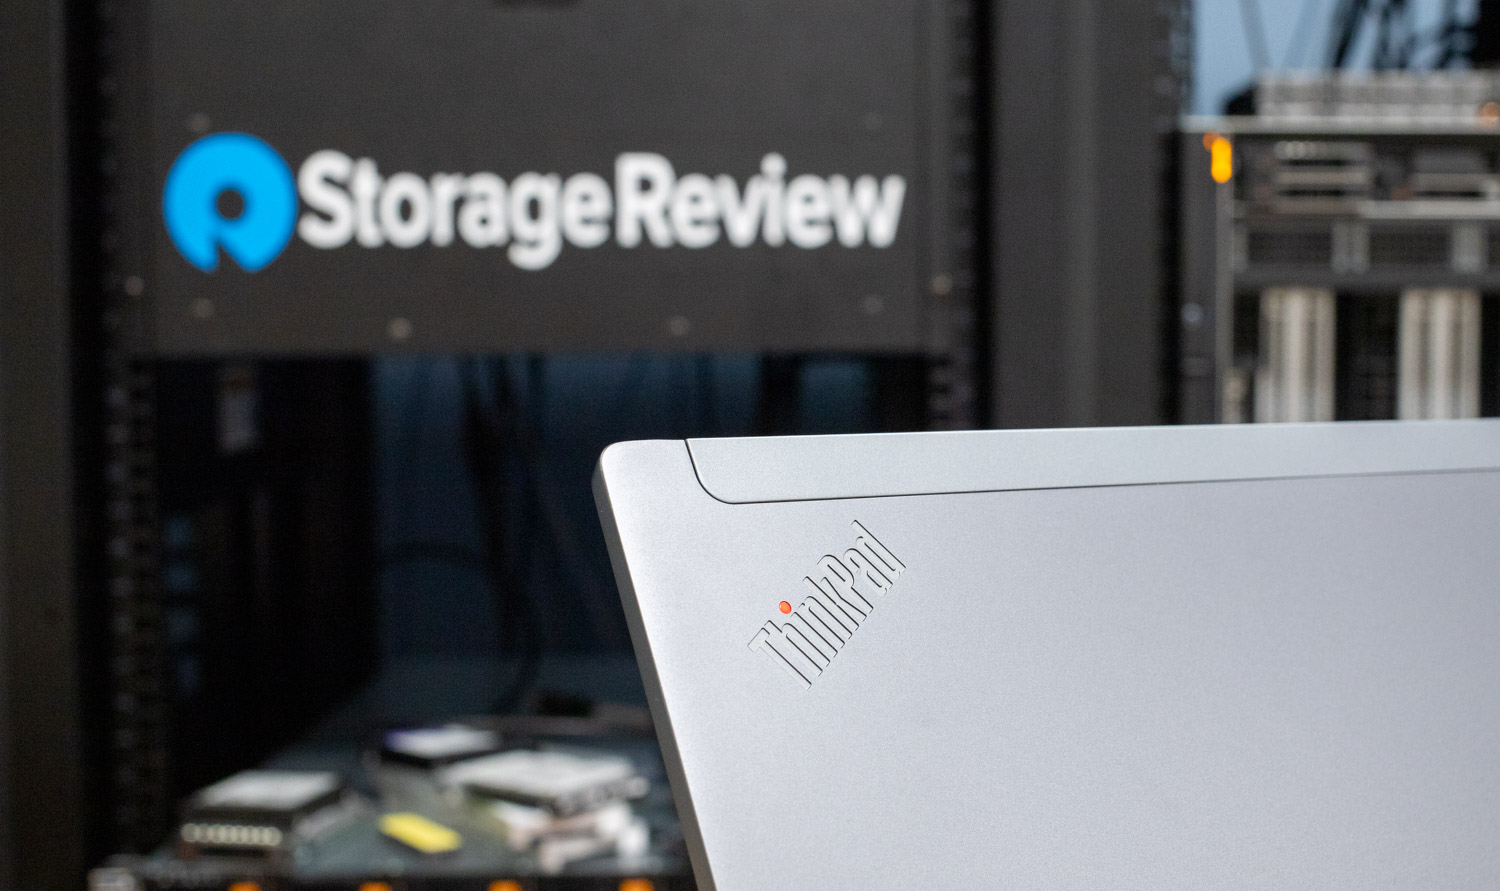
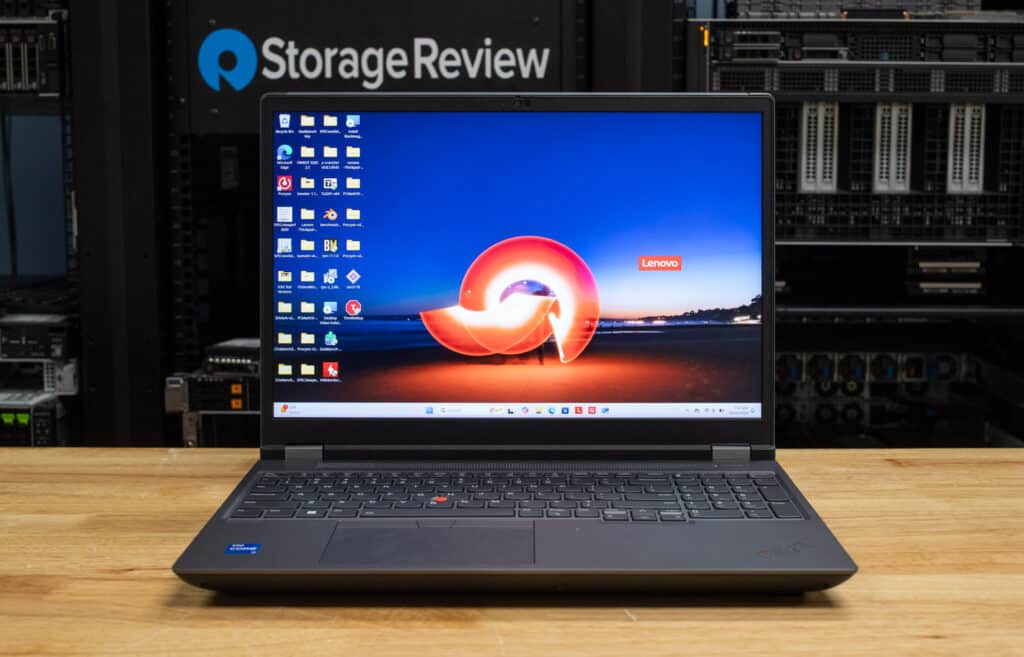
The ThinkPad P16 Gen 2 is an exceptionally capable 16″ workstation with Intel Core HX-class CPUs, Nvidia RTX Ada, and up to 192GB of RAM.
The ThinkPad P16 Gen 2 is Lenovo’s flagship mobile workstation. It is based around the 14th-generation Intel Core processors and features up to an Nvidia RTX 5000 Ada Generation GPU. It boasts exceptional expansion, with up to 192GB of RAM and two storage drives. With many Independent Software Vendor (ISV) certifications and comprehensive security features, there’s no task this laptop can’t handle.
Lenovo ThinkPad P16 Gen 2 Specifications
| Processor | 13th and 14th Gen Intel Core HX-class |
| Graphics |
|
| Memory |
|
| Battery | 94Wh |
| Storage | Up to 2 x 4TB PCIe SSD Gen4 Performance |
| Ports/Slots |
|
| Wireless | WLAN:
WWAN:
Optional:
|
| Display |
|
| Dimensions (H x W x D) | 30.23mm x 363.98mm x 265.94mm / 1.19″ x 14.33″ x 10.47″ |
| Weight | Starting at 2.95kg / 6.5lbs |
| Material |
|
| Certifications/Registries |
|
| ThinkShield Security |
|
| ISV Certifications |
|
Lenovo ThinkPad P16 Gen 2 Build and Design
This ThinkPad puts performance ahead of everything else. Measuring 14.33 x 10.47 x 1.19 inches and with a starting weight of 6.5 pounds, it’s considerably larger than portability-focused workstations, such as the ThinkPad P1 Gen 7 and the HP ZBook Studio 16 G11.
The build quality of this laptop is exemplary. It’s MIL-SPEC certified for operation in harsh environments, and its tank-like chassis exhibits no flex. Most of the construction is made of magnesium and aluminum. Lenovo has the environment in mind, using recycled materials throughout, even on the keyboard. It also uses low-temperature solder and plastic-free packaging with 90% recycled and sustainable content.
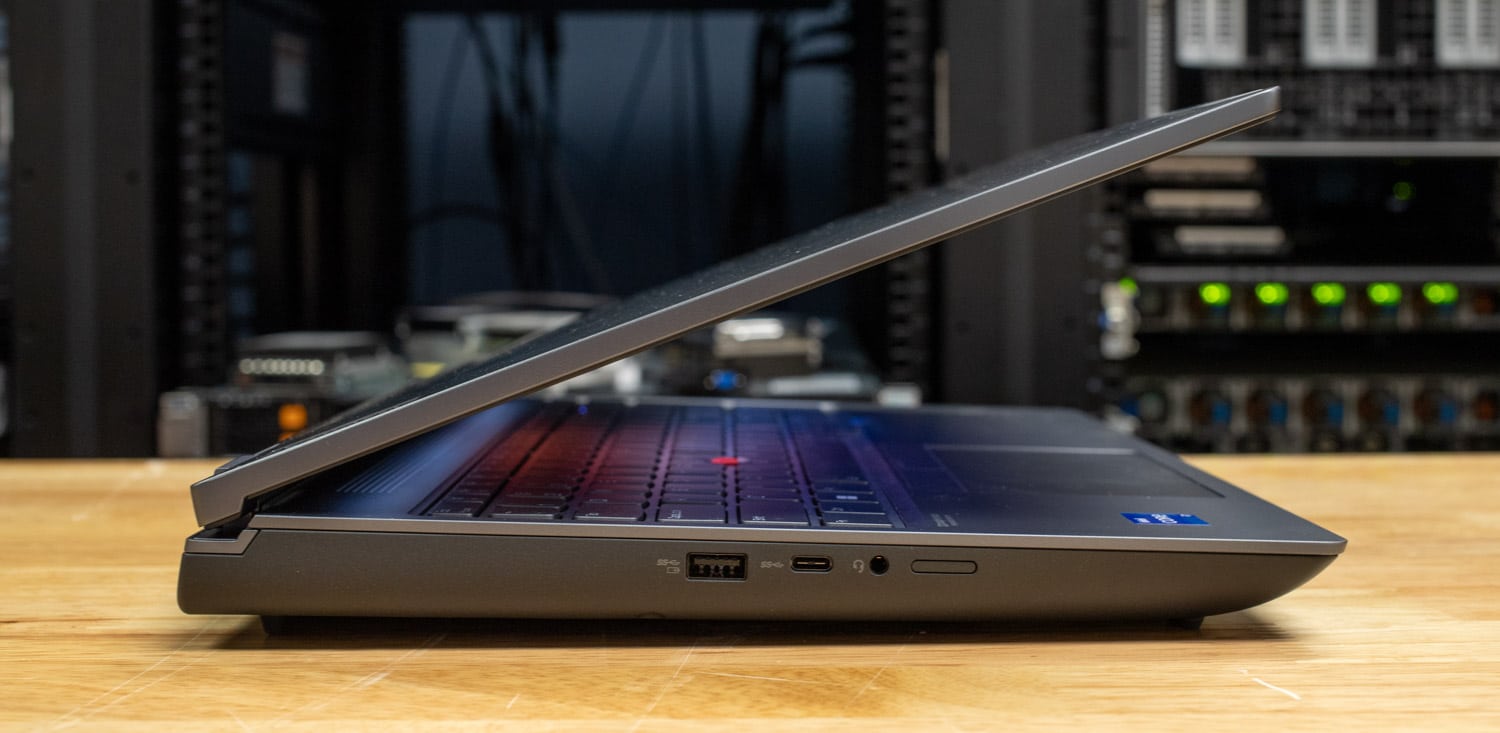
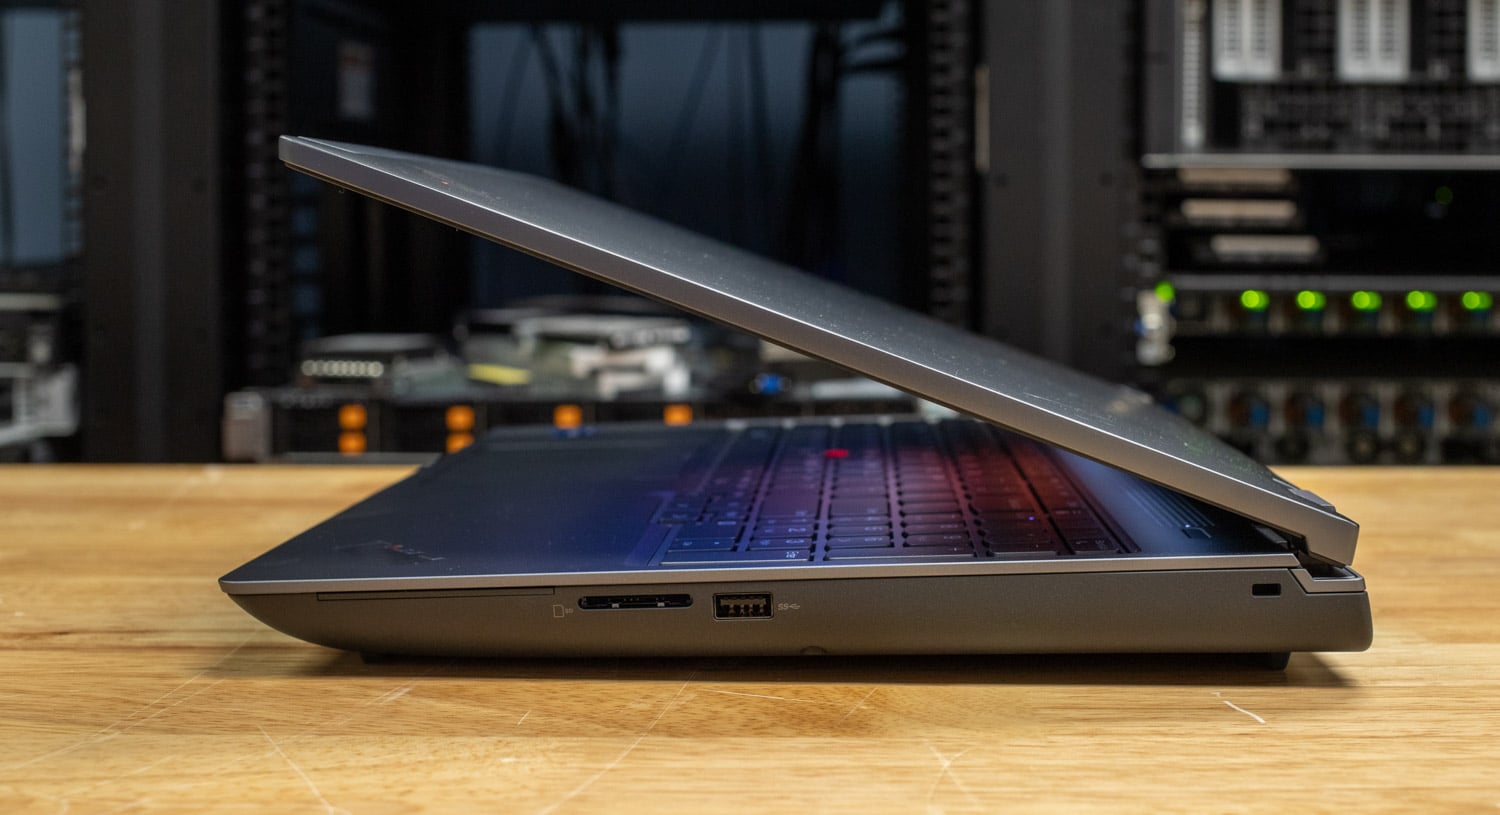
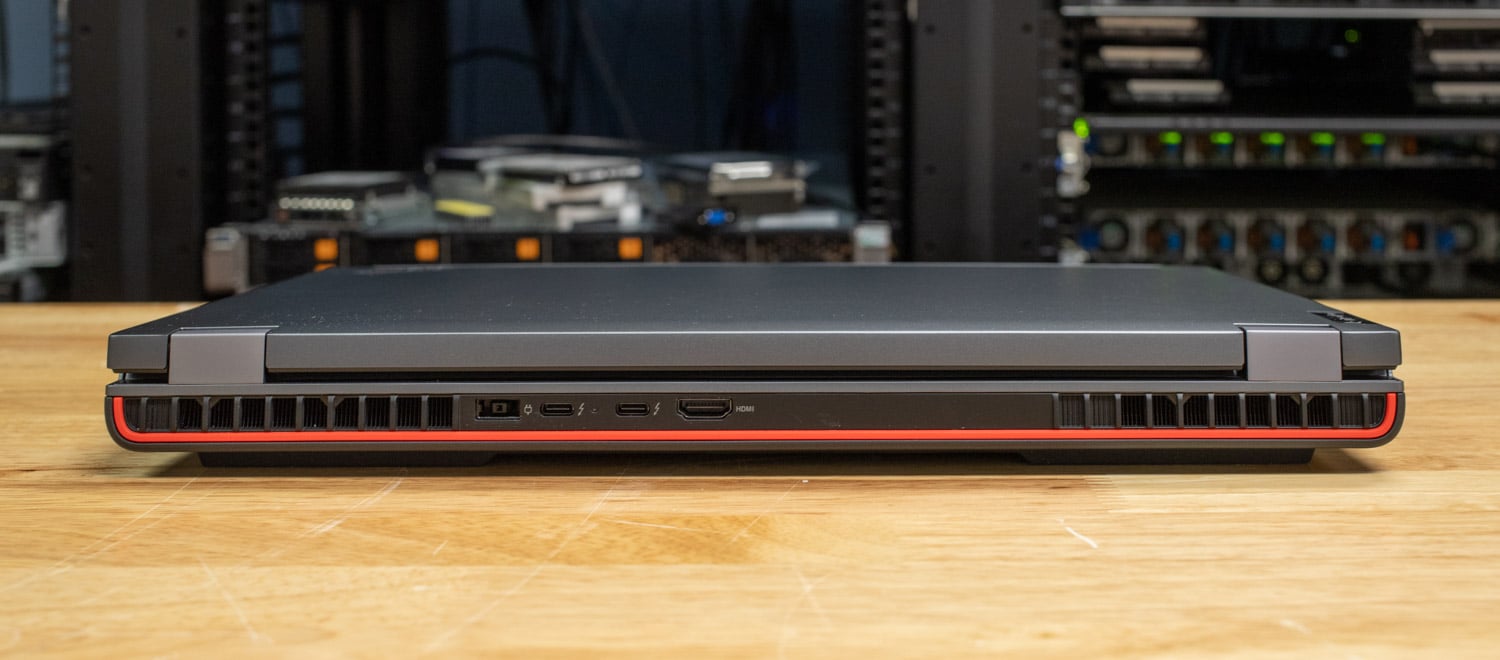
The abundant physical connections include two Thunderbolt 4 (USB Type-C) ports, two 5Gbps USB Type-A ports, a 10Gbps USB Type-C port, HDMI 2.1 monitor output, and a 3.5mm audio jack.
Having some of the ports on the rear, especially the power plug, is useful for keeping cables out of the way. A red stripe back here adds flair to the otherwise understated design.
A SmartCard reader and an SD card reader are optional. Wi-Fi 6E and Bluetooth 5.3 are standard; NFC and 4G WWAN with eSIM are options.
Lenovo ThinkPad P16 Gen 2 Screen and Input Devices
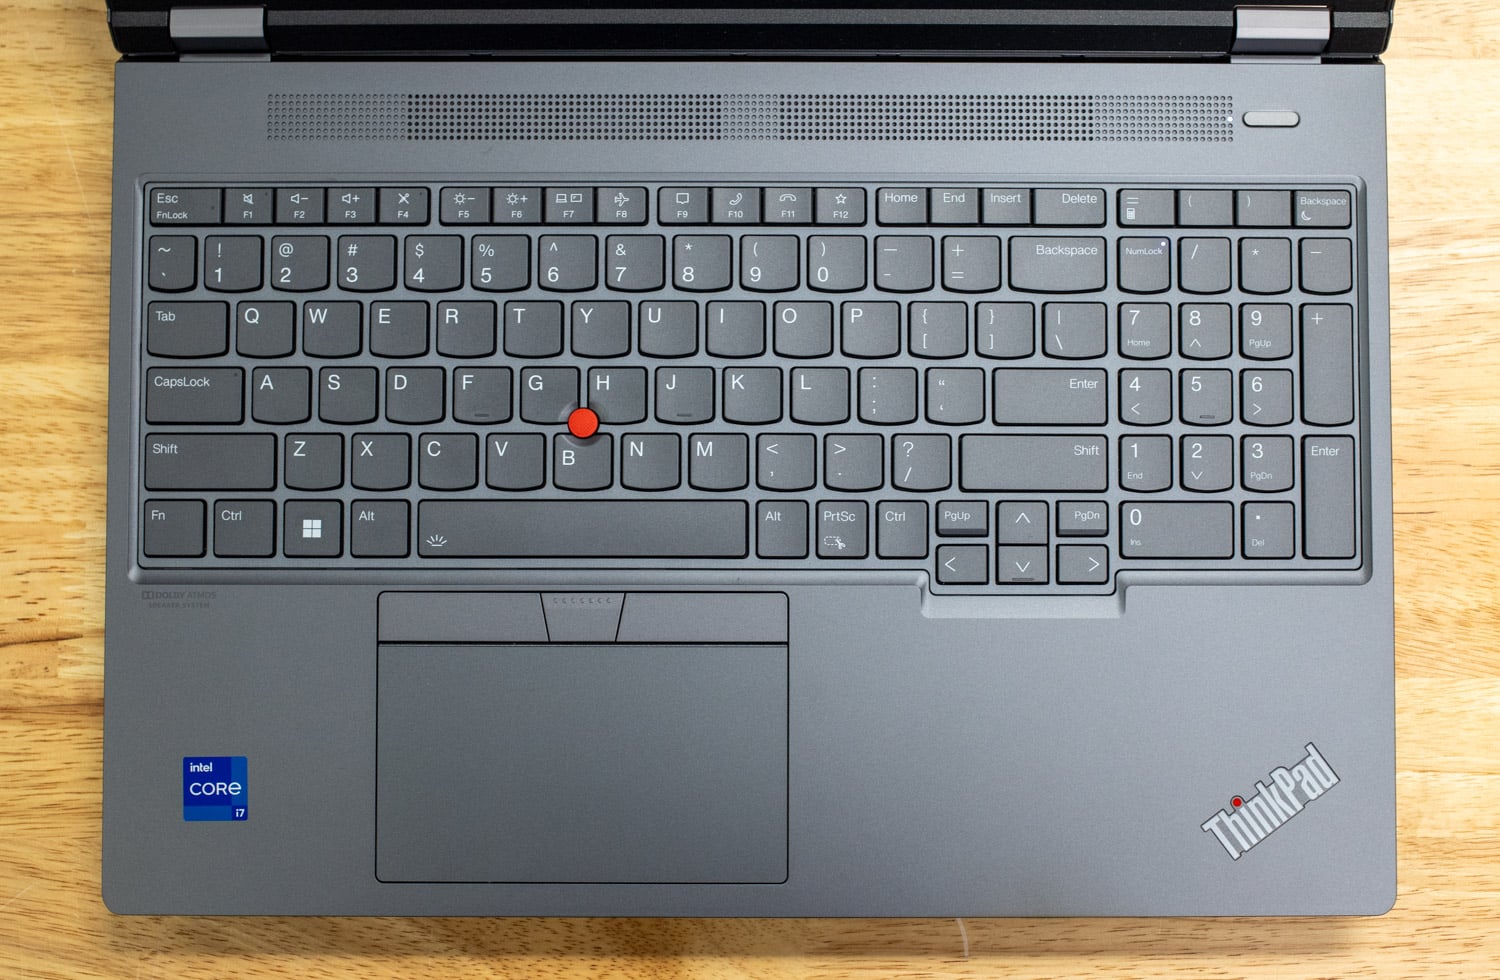
ThinkPad keyboards are the best in the business; the P16 Gen 2 offers superb typing comfort, with ample key throw for satisfying tactile feedback. The white backlighting looks good in the dark. The productive layout has a separated arrow-key cluster and a full-size numeric keypad with a standard layout.
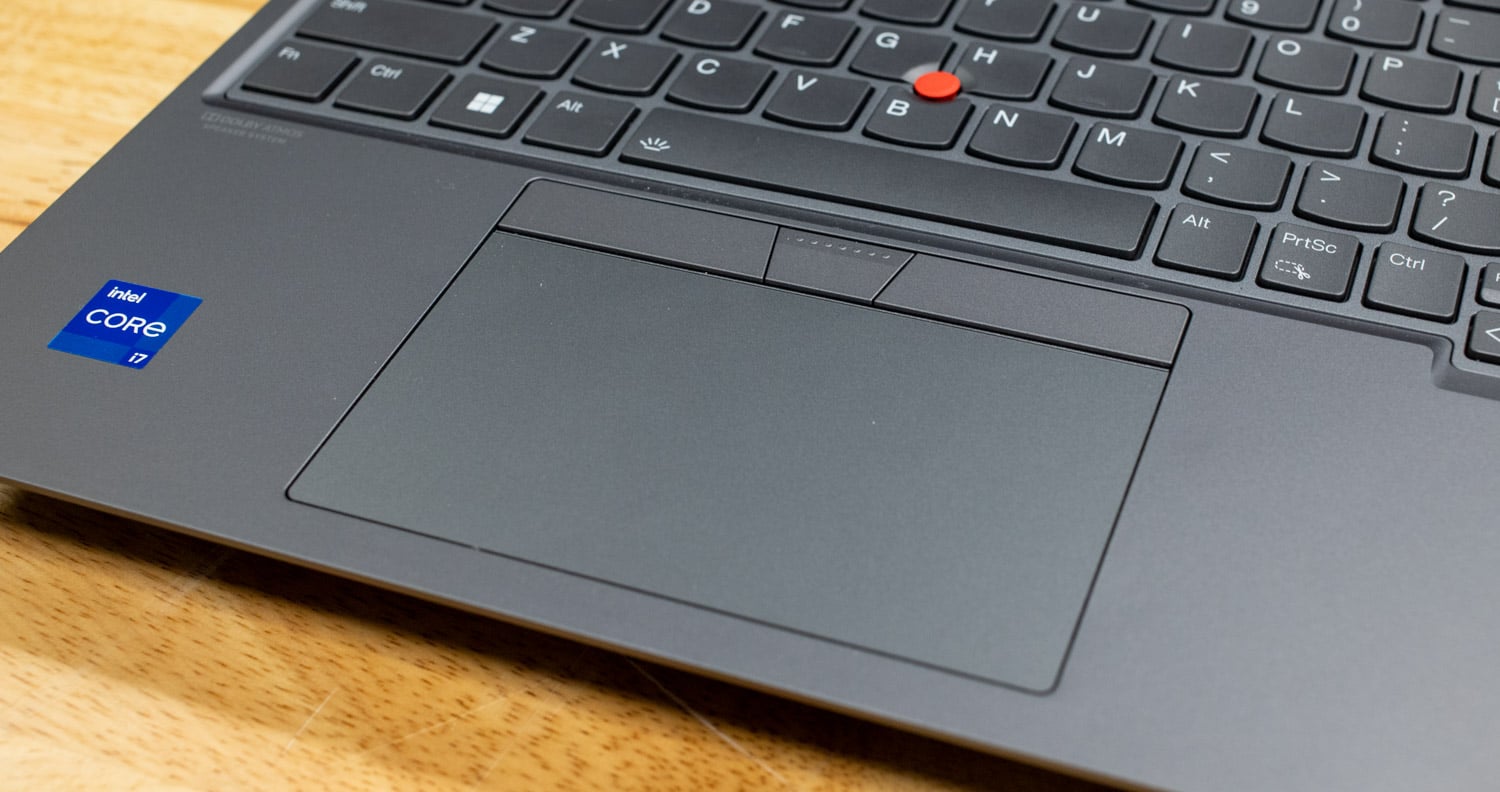
The large buttonless touchpad is joined by the trademark eraser-head pointing stick in the center of the keyboard, which has three dedicated buttons. The middle button is handy for apps that make use of center-click.
The ThinkPad’s screen options start with a 1920 x 1200 IPS panel rated for 300 or 400 nits of brightness and 100% sRGB gamut coverage. Our unit has the mid-tier 2560 x 1600 panel offering 500 nits and a gaming laptop-like 165Hz refresh rate. Everything we put on this screen looked outstanding, from office documents to movie trailers. The top option is a 3840 x 2400 OLED touchscreen with 100% DCI-P3 coverage.
The onboard webcam is rated 1080p and has a mechanical shutter for privacy. The camera will get the job done for video calls and such, although the sensor left a bit to be desired for image quality.
Lenovo ThinkPad P16 Gen 2 Upgradeability
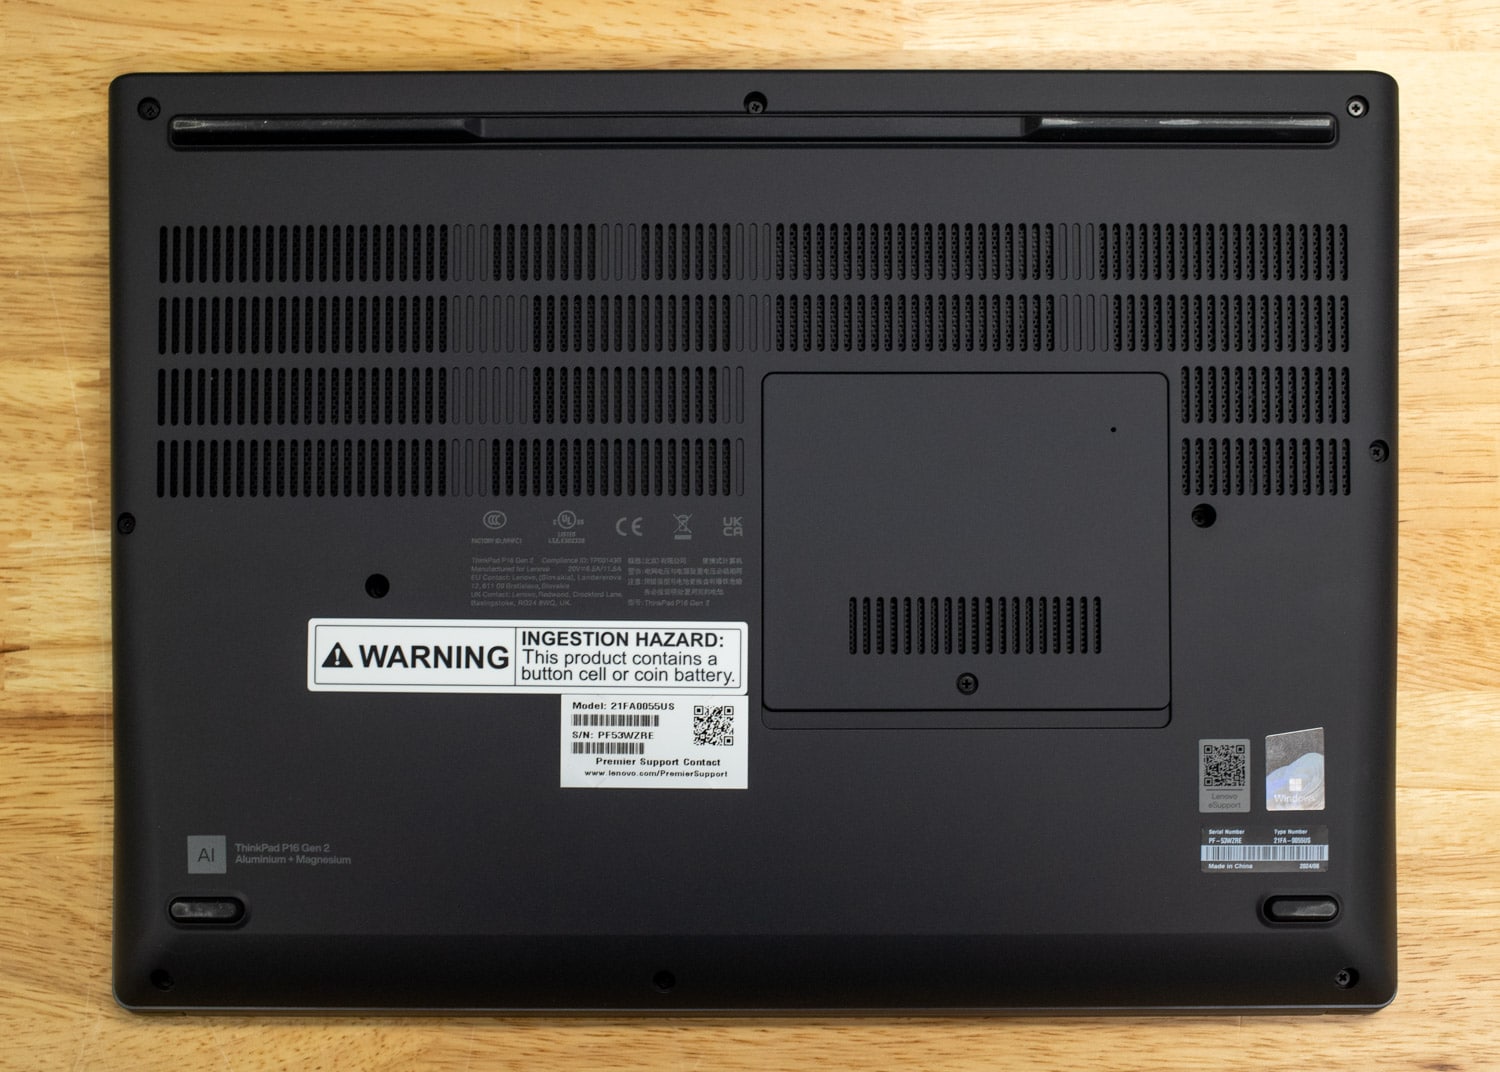
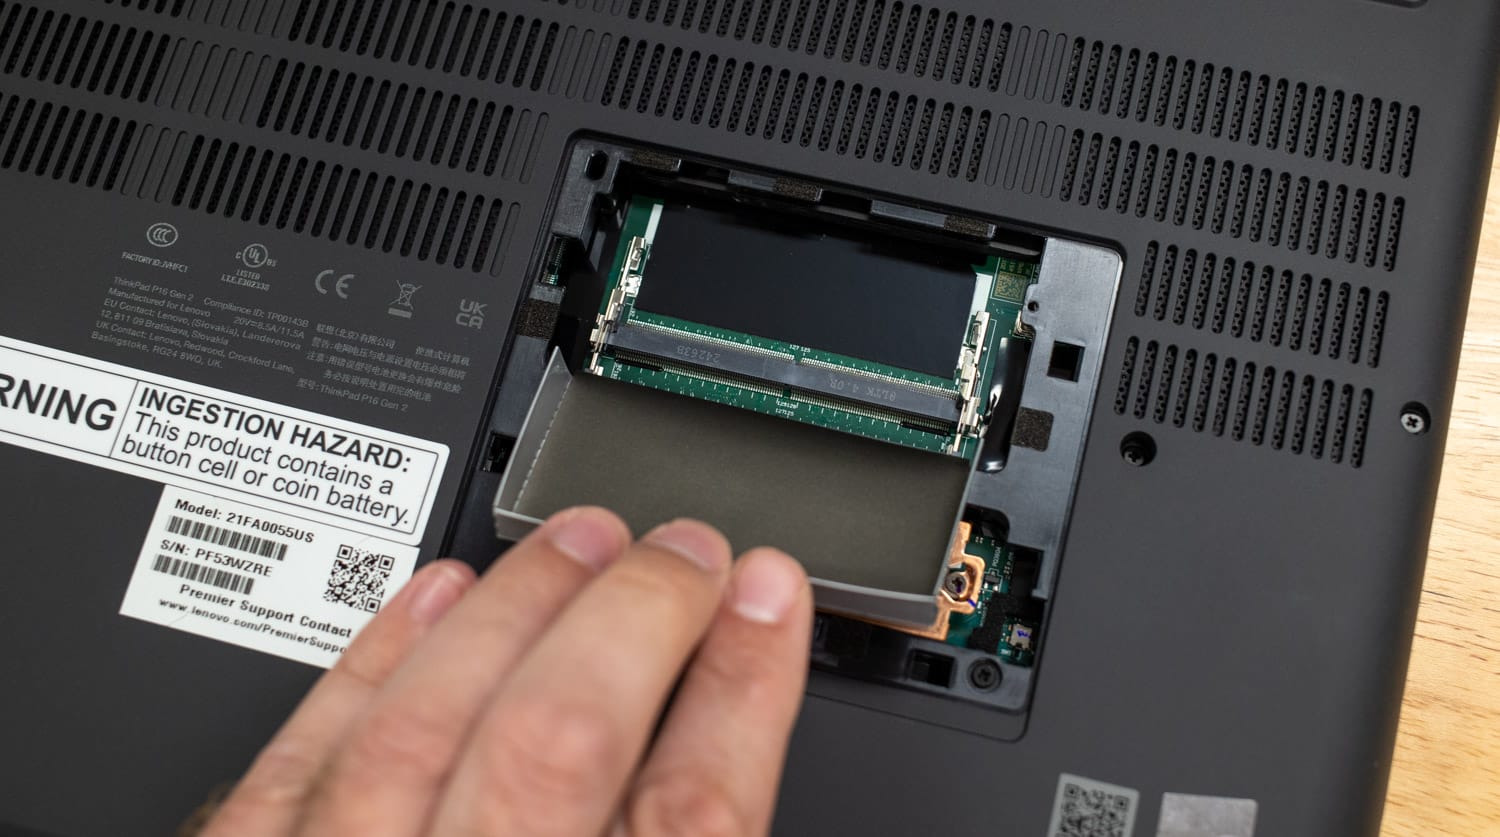
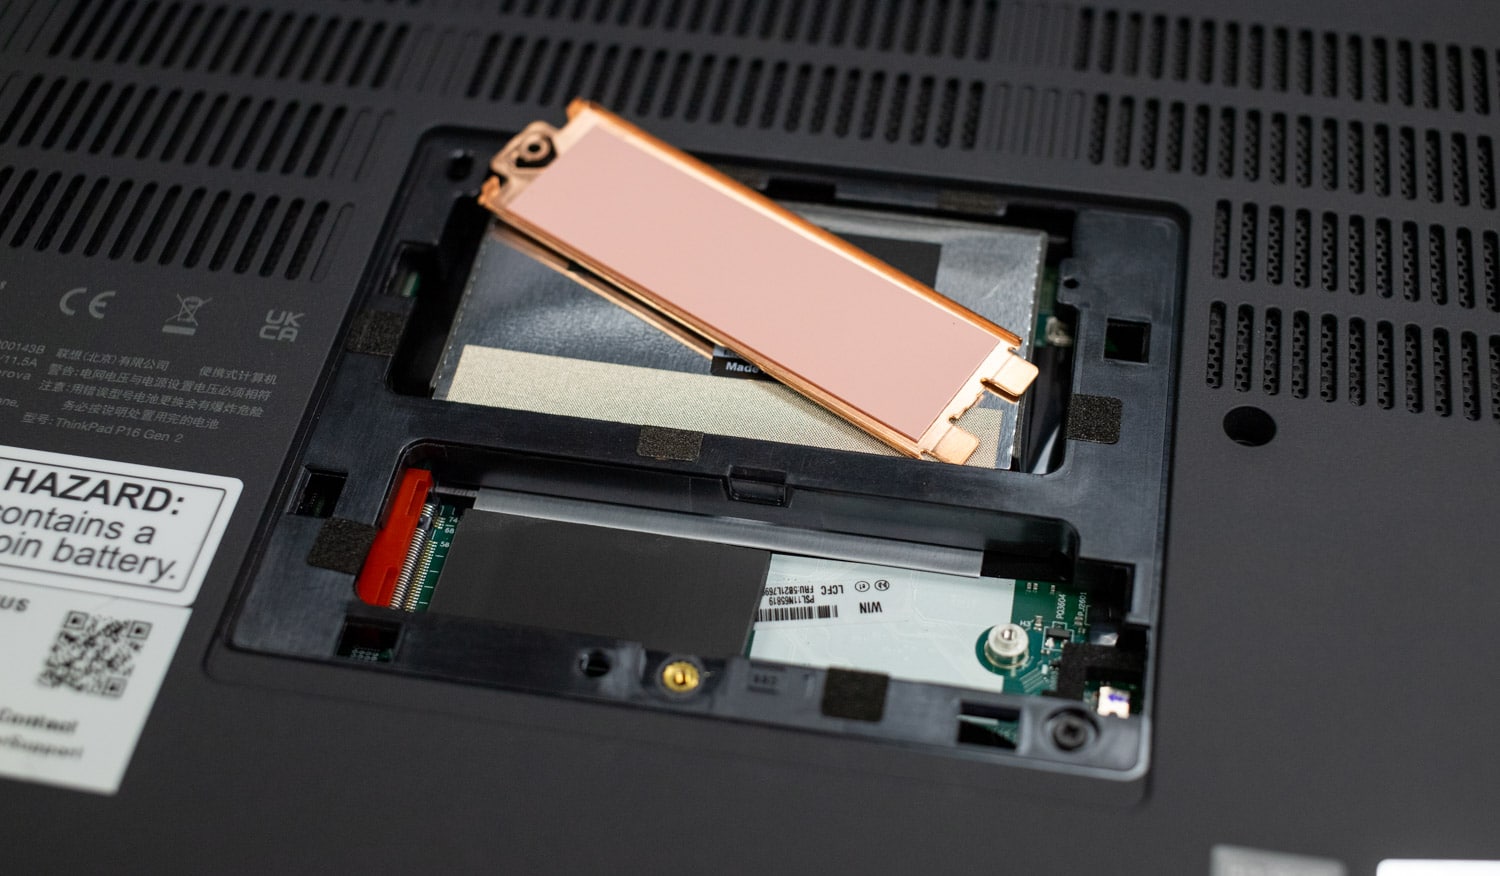
This ThinkPad has excellent upgrade prospects. The bottom cover has a unique cutout for memory and SSD upgrades, eliminating the need to remove the entire panel.
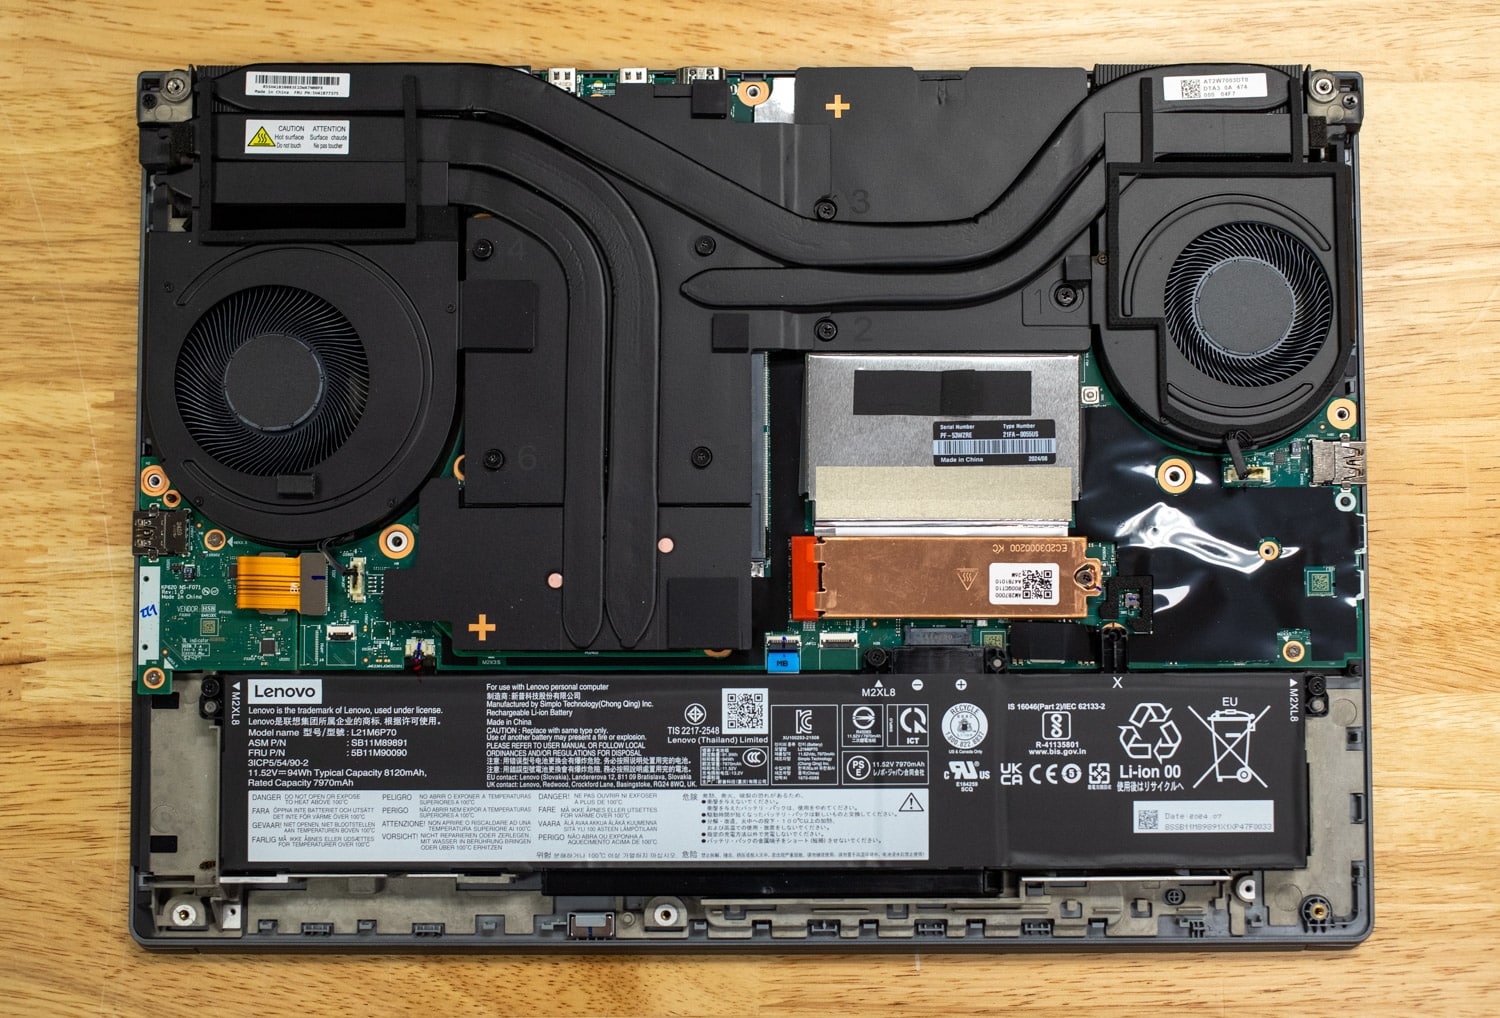
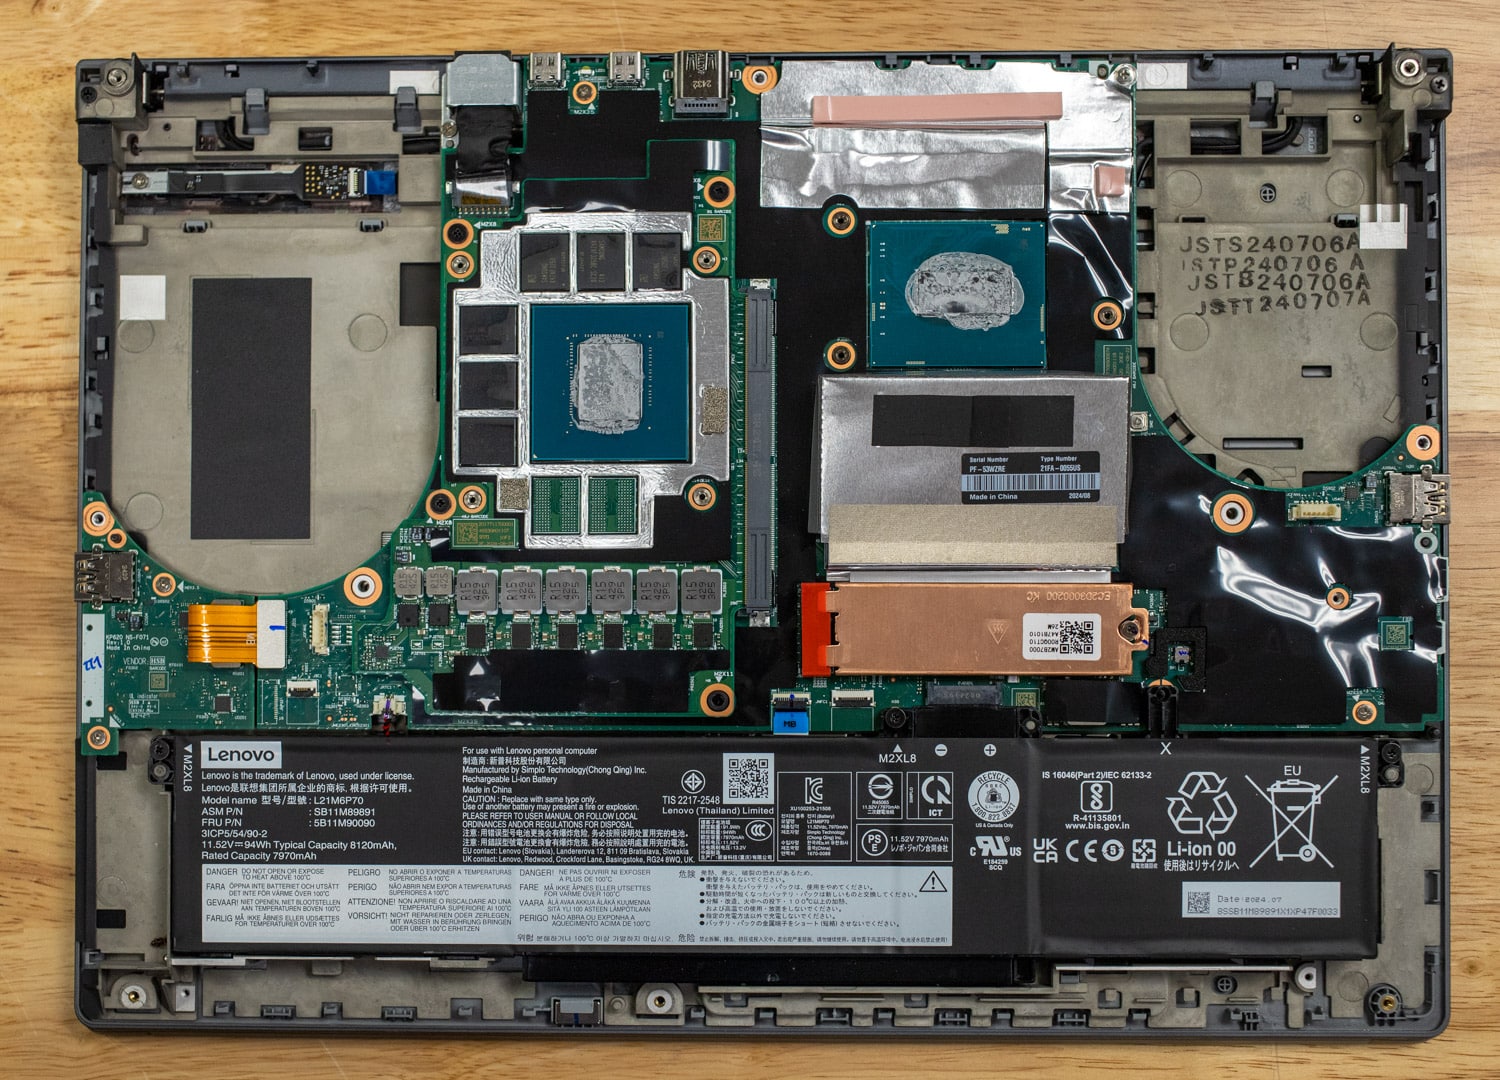
With the entire bottom panel removed, we can see the large cooling fans and massive user-replaceable 94Wh battery.
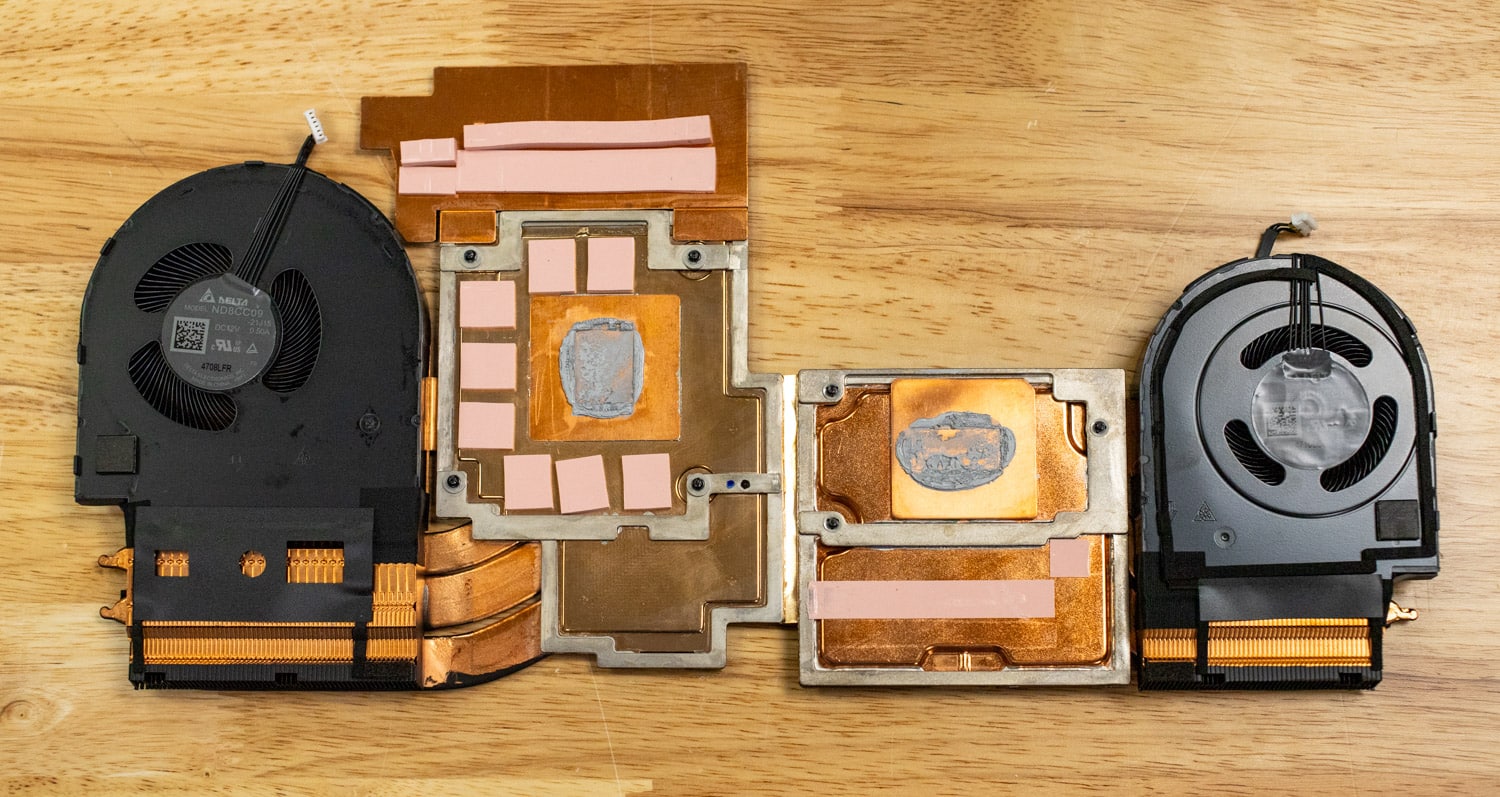
Removing the thermal heatsinks shows how much copper this laptop uses to keep it running cool. While the system is under both a CPU and GPU load, fan noise isn’t that bad. It’s a soft to moderate whisper, thanks in part to larger fan intakes and outlets. It can move air well without ramping into really high fan RPM.
Lenovo ThinkPad P16 Gen 2 Performance
Our review unit features a Core i7-14700HX processor, 32GB of RAM (non-ECC), a 1TB SSD, and an Nvidia RTX 4000 Ada Generation GPU (115W maximum graphics power). It retails for about $5,000, but pricing will vary by channel.
For comparison, we used the HP ZBook Power G11 and G11 A, the former featuring an Intel Core Ultra 9 185H and the latter an AMD Ryzen 9 Pro 8945HS. Both have 64GB of RAM and an RTX 3000 Ada Generation GPU. The comparison is not precisely apples to apples, but it will put the ThinkPad’s stellar performance in perspective.
SPECworkstation 3
SPECworkstation3 specializes in benchmarks designed to test all key aspects of workstation performance. It uses over 30 workloads to test CPU, graphics, I/O, and memory bandwidth. The workloads fall into broader categories such as Media and Entertainment, Financial Services, Product Development, Energy, Life Sciences, and General Operations. We will list each broad-category result instead of the individual workloads. The results are an average of all the individual workloads in each category.
The ThinkPad P16 Gen 2, powered by the Nvidia RTX 4000 Ada, quickly showed its superiority in multiple categories. Lenovo ThinkPad P16 Gen 2 demonstrated superior capability in workloads that stress the GPU.
| SPECworkstation 3 (Higher is better) | HP ZBook Power G11 (Nvidia RTX 3000 Ada) | HP ZBook Power G11 A (Nvidia RTX 3000 Ada) | Lenovo ThinkPad P16 Gen 2 (Nvidia RTX 4000 Ada) |
| Media and Entertainment | 3.27 | 3.26 | 3.95 |
| Product Development | 4.24 | 3.49 | 4.86 |
| Life Sciences | N/A | N/A | 4.53 |
| Financial Services | 3.54 | 3.87 | 4.2 |
| Energy | N/A | N/A | 5.09 |
| General Operations | 2.75 | 2.68 | 2.89 |
| GPU Compute | 4.64 | 4.53 | 11.74 |
SPECviewperf 2020
Our next test is SPECviewperf 2020, the worldwide standard for measuring graphics performance of professional applications under the OpenGL and Direct X application programming interfaces. The viewsets (or benchmarks) represent graphics content and behavior from actual applications without having to install the applications themselves. The newest version of this benchmark went through significant updates late last year, including new viewsets taken from traces of the latest versions of 3ds Max, Catia, Maya, and Solidworks applications. In addition, they added support within all viewsets for both 2K and 4K resolution displays.
While both HP models performed similarly in SPECviewperf, Lenovo consistently led by a wide margin, especially in tasks related to 3D rendering.
| SPECviewperf2020 Viewsets (Higher is better) | HP ZBook Power G11 (Nvidia RTX 3000 Ada) | HP ZBook Power G11 A (Nvidia RTX 3000 Ada) | Lenovo ThinkPad P16 Gen 2 (Nvidia RTX 4000 Ada) |
| 3dsmax-07 | 86.41 | 84.78 | 174.32 |
| Catia-06 | 86.18 | 83.78 | 130.95 |
| Creo-03 | 132.36 | 117.35 | 182.83 |
| Energy-03 | 60.97 | 60.04 | 106.33 |
| Maya-06 | 333.36 | 334.26 | 508.05 |
| Medical-03 | 95.45 | 95.17 | 156.38 |
| Snx-04 | 324.73 | 330.3 | 547.04 |
| Solidworks-05 | 205.49 | 207.32 | 346.68 |
Luxmark
LuxMark, an OpenCL GPU benchmarking utility, again showed Lenovo’s dominance in GPU tasks. For users who depend on GPU performance for OpenCL tasks, the Lenovo ThinkPad P16 Gen 2 demonstrates it can handle the workload better than its HP competitors.
| Luxmark (Higher is better) | HP ZBook Power G11 (Nvidia RTX 3000 Ada) | HP ZBook Power G11 A (Nvidia RTX 3000 Ada) | Lenovo ThinkPad P16 Gen 2 (Nvidia RTX 4000 Ada) |
| Hallbench | 12,003 | 11,123 | 18,341 |
| food | 4,564 | 4,151 | 7,155 |
OctaneBench
Next, we look at OctaneBench, a benchmarking utility for OctaneRender, another 3D renderer with RTX support similar to V-Ray. These results solidify Lenovo’s position as the better choice for rendering and creative users.
| OctaneBench (Score, higher is better) | Kernel | HP ZBook Power G11 (Nvidia RTX 3000 Ada) | HP ZBook Power G11 A (Nvidia RTX 3000 Ada) | Lenovo ThinkPad P16 Gen 2 (Nvidia RTX 4000 Ada) |
| Interior | Info channels | 12.09 | 12.12 | 21.80 |
| Interior | Direct lighting | 36.80 | 36.88 | 65.90 |
| Interior | Path tracing | 45.99 | 45.07 | 77.97 |
| Idea | Info channels | 7.26 | 7.20 | 12.99 |
| Idea | Direct lighting | 29.27 | 29.36 | 51.80 |
| Idea | Path tracing | 35.27 | 35.36 | 59.72 |
| ATV | Info channels | 18.61 | 18.94 | 34.07 |
| ATV | Direct lighting | 38.56 | 38.61 | 59.52 |
| ATV | Path tracing | 48.97 | 48.63 | 79.60 |
| Box | Info channels | 9.94 | 9.99 | 17.96 |
| Box | Direct lighting | 35.37 | 35.49 | 58.37 |
| Box | Path tracing | 38.67 | 38.96 | 65.00 |
Blackmagic RAW Speed Test
We have also started running Blackmagic’s RAW speed test, which tests video playback. The ZBook G11 outperformed its AMD counterpart in the CPU test, and both easily outpaced the ThinkPad.
While Lenovo dominated GPU-heavy benchmarks, HP’s ZBook Power G11 made its mark in CPU-focused tests.
| Blackmagic RAW Speed Test (FPS, higher is better) | HP ZBook Power G11 (Nvidia RTX 3000 Ada) | HP ZBook Power G11 A (Nvidia RTX 3000 Ada) | Lenovo ThinkPad P16 Gen 2 (Nvidia RTX 4000 Ada) |
| 8K CPU | 64 | 54 | 83 |
| 8K CUDA | 87 | 92 | 81 |
Blackmagic Disk Speed Test
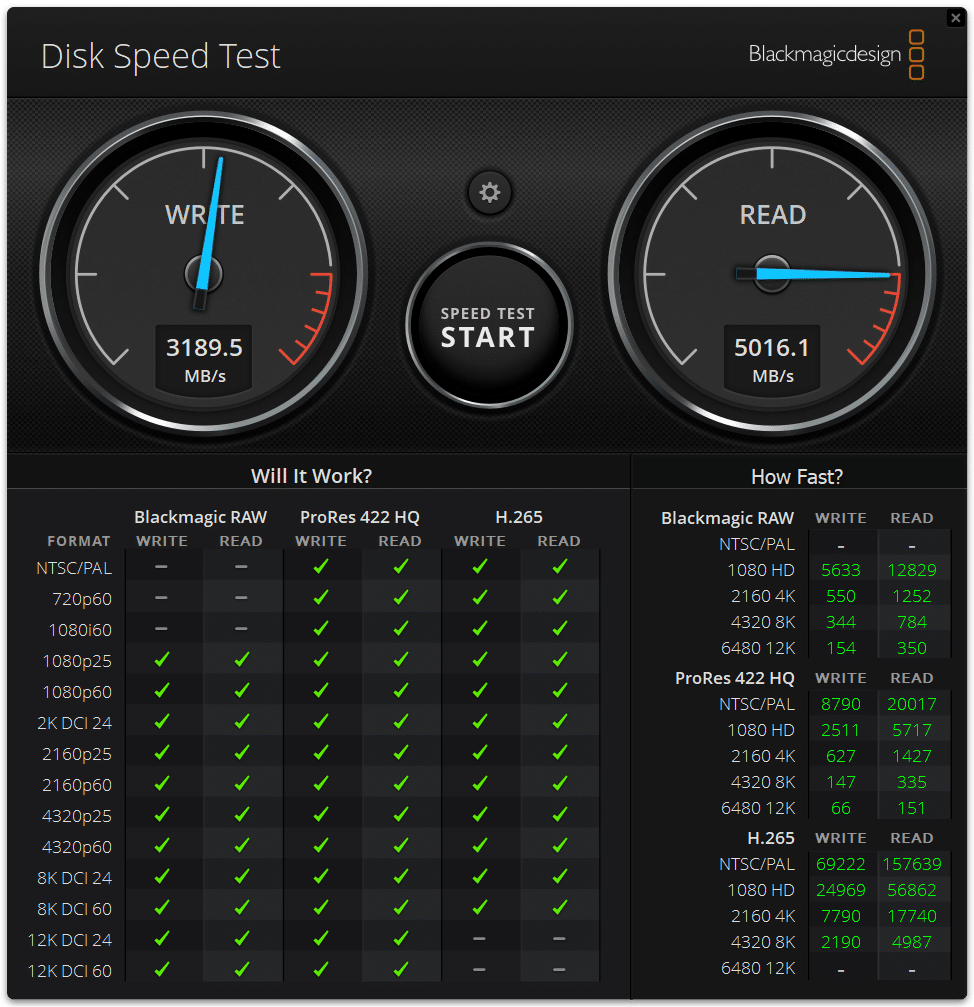
We conducted the Blackmagic Disk Speed Test on the Lenovo ThinkPad, utilizing the SKHynix_HFS001TEJ9X162N PCIe Gen 4×4 NVMe SSD as the primary storage drive. This SSD is engineered to provide exceptional data transfer speeds, crucial for demanding tasks such as video editing and transferring large files. During testing, the SKHynix_HFS001TEJ9X162N demonstrated impressive performance, achieving a write speed of 3.19 GB/s and a read speed of 5.02 GB/s. These high-speed capabilities not only facilitate swift file saving but also ensure rapid access to sizable data, significantly enhancing the system’s overall responsiveness.
7-Zip Compression
Our next test is the built-in memory benchmark in the popular 7-Zip utility. The decompression numbers indicate overall performance in this test, and the AMD-powered G11 A performed much better than the G11. The ThinkPad took a back seat.
Despite Lenovo’s lead in GPU workloads, the HP ZBook Power G11 A stands out as a powerhouse in CPU-centric tasks, likely making it the better choice for users needing CPU-intensive processing.
| 7-Zip Compression Benchmark (Higher is better) | HP ZBook Power G11 (Nvidia RTX 3000 Ada) | HP ZBook Power G11 A (Nvidia RTX 3000 Ada) | Lenovo ThinkPad P16 Gen 2 (Nvidia RTX 4000 Ada) |
| Current CPU Usage | 869% | 617% | 1,246% |
| Current Rating/Usage | 9.914 GIPS | 11.373 GIPS | 7.794 GIPS |
| Current Rating | 86.184 GIPS | 70.164 GIPS | 97.081 GIPS |
| Resulting CPU Usage | 865% | 628% | 1,193% |
| Resulting Rating/Usage | 10.038 GIPS | 11.213 GIPS | 8.442 GIPS |
| Resulting Rating | 86.812 GIPS | 70.382 GIPS | 100.606 GIPS |
| Decompressing | |||
| Current CPU Usage | 1,862% | 1,554% | 2,691% |
| Current Rating/Usage | 5.309 GIPS | 6.757 GIPS | 4.557 GIPS |
| Current Rating | 98.869 GIPS | 104.994 GIPS | 122.643 GIPS |
| Resulting CPU Usage | 1,739% | 1,550% | 2,710% |
| Resulting Rating/Usage | 5.439 GIPS | 6.780 GIPS | 4.635 GIPS |
| Resulting Rating | 97.508 GIPS | 105.072 GIPS | 125.577 GIPS |
| Total Rating | |||
| Total CPU Usage | 1,329% | 1,089% | 1,951% |
| Total Rating/Usage | 7.738 GIPS | 8.996 GIPS | 6.539 GIPS |
| Total Rating | 92.160 GIPS | 87.727 GIPS | 113.092 GIPS |
UL Procyon AI Inference
UL’s Procyon estimates a workstation’s performance for professional apps. We are only showing numbers for running this test on the GPU. The ThinkPad scored highest in Tensor RT-based performance but fell significantly behind in Windows ML, leading to its meager overall Windows ML score. The HP ZBook Power G11 models maintained more balanced scores across Tensor RT and Windows ML.
| UL Procyon Average Inference Times (ms, lower is better) | HP ZBook Power G11 (Tensor RT) | HP ZBook Power G11 (Windows ML) | HP ZBook Power G11 A (Tensor RT) | HP ZBook Power G11 A (Windows ML) | Lenovo ThinkPad P16 Gen 2 (Tensor RT) | Lenovo ThinkPad P16 Gen 2 (Windows ML) |
| MobileNet V3 | 0.71 | 1.03 | 0.59 | 0.96 | 0.51 | 22.01 |
| ResNet 50 | 1.87 | 2.67 | 1.83 | 3.04 | 1.37 | 170.49 |
| Inception V4 | 6.06 | 7.02 | 6.21 | 7.46 | 3.78 | 554.75 |
| DeepLab V3 | 5.18 | 23.35 | 5.26 | 15.20 | 4.21 | 488.04 |
| YOLO V3 | 6.26 | 12.79 | 6.58 | 12.26 | 4.28 | 1,218.31 |
| Real-ESRGAN | 301.55 | 307.01 | 321.91 | 308.01 | 148.81 | 33,946.914 |
| Overall Score | 763 | 454 | 770 | 481 | 1,143 | 8 |
y-cruncher
y-cruncher is a multi-threaded and scalable program that can compute Pi and other mathematical constants to trillions of digits, with lower times indicating better performance. Since its launch in 2009, it has become a popular benchmarking and stress-testing application for overclockers and hardware enthusiasts. The G11 A was the strongest performer, followed by the Thinkpad and the G11, respectively.
| y-cruncher (Total Computation time) | HP ZBook Power G11 (Nvidia RTX 3000 Ada) | HP ZBook Power G11 A (Nvidia RTX 3000 Ada) | Lenovo ThinkPad P16 Gen 2 |
| 1 billion digits | 33.393 seconds | 29.183 seconds | 28.84 seconds |
| 2.5 billion digits | 103.957 seconds | 81.055 seconds | 84.38 seconds |
| 5 billion digits | 227.810 seconds | 178.369 seconds | 193.230 seconds |
| 10 billion digits | 506.273 seconds | 404.215 seconds | N/A |
Geekbench 6
Geekbench 6 is a cross-platform benchmark that measures overall system performance. The Geekbench Browser allows you to compare any system to it. The G11 A refused to run this test. The Lenovo ThinkPad P16 Gen 2 outperformed the HP ZBook Power G11 in both CPU and GPU categories, especially excelling in multi-core and GPU-intensive tasks.
| Geekbench 6 (Higher is better) | HP ZBook Power G11 (Nvidia RTX 3000 Ada) | HP ZBook Power G11 A (Nvidia RTX 3000 Ada) | Lenovo ThinkPad P16 Gen 2 |
| CPU Single-Core | 2,443 | N/A | 2,859 |
| CPU Multi-Core | 13,975 | N/A | 15,914 |
| GPU | 94,251 | N/A | 168,154 |
Cinebench R23
This benchmark uses all CPU cores and threads, providing insight into how systems handle single-core and multi-core workloads. This result indicates the ThinkPad’s superiority in tasks that rely heavily on individual core performance, such as certain types of simulations and more straightforward office productivity tasks.
| Cinebench R23 (Higher is better) | HP ZBook Power G11 (Nvidia RTX 3000 Ada) | HP ZBook Power G11 A (Nvidia RTX 3000 Ada) | Lenovo ThinkPad P16 Gen 2 |
| Multi-Core | 17,945 | 14,660 | 20,763 |
| Single-Core | 1,821 | 1,713 | 2,024 |
Cinebench R24
We also started running the latest Cinebench test. We also ran Cinebench R24 to get a more updated view of the system’s capabilities. In this newer test, the results for multi-core CPU tasks follow a similar trend: ThinkPad’s capability to handle multi-threaded tasks better. In single-core tests, the differences between systems are less dramatic but still noteworthy, with the Lenovo ThinkPad P16 Gen 2 scoring 118, compared to 108 for the HP ZBook Power G11 and 106 for the G11 A.
The most striking difference between the systems is their GPU performance in Cinebench R24. The Lenovo ThinkPad P16 Gen 2 posts an outstanding score of 17,307, nearly doubling that of the HP ZBook Power G11 (8,514) and significantly outclassing the G11 A (9,458). This makes the ThinkPad the clear choice for graphics-intensive tasks like 3D modeling, GPU-based rendering, and gaming. The HP ZBook models, while decent, are not nearly as competitive in this category.
| Cinebench R23 (Higher is better) | HP ZBook Power G11 (Nvidia RTX 3000 Ada) | HP ZBook Power G11 A (Nvidia RTX 3000 Ada) | Lenovo ThinkPad P16 Gen 2 |
| Multi-Core | 832 | 900 | 1,146 |
| Single-Core | 108 | 106 | 118 |
| GPU | 8,514 | 9,458 | 17,307 |
Conclusion
The ThinkPad P16 Gen 2 is an exceptionally capable 16-inch mobile workstation. Equipped with high-wattage Intel Core HX-class processors, Nvidia RTX Ada Generation professional graphics, and up to 192GB of RAM, this laptop is ready for the most demanding applications. It impressed us everywhere, particularly in build and screen quality. Being a ThinkPad, it also has the best input devices found on a laptop. With little to detract from its appeal sans a sky-high price, the ThinkPad P16 Gen 2 earns our recommendation for a high-end 16-inch mobile workstation.
Engage with StorageReview
Newsletter | YouTube | Podcast iTunes/Spotify | Instagram | Twitter | TikTok | RSS Feed

