The Lenovo ThinkStation P3 Ultra packs serious power for being so small, with up to a 65-watt Core i9 processor and an NVIDIA RTX 4000 GPU.
The ThinkStation P3 Ultra is a small-form-factor (SFF) workstation desktop that’s a fraction of the size of a mid-tower. It’s based around Intel Core processors up to 65W and supports up to the Nvidia RTX 4000 GPU. Expansion options include up to 128GB of ECC RAM and three storage drives.
Lenovo ThinkStation P3 Ultra Design and Ports
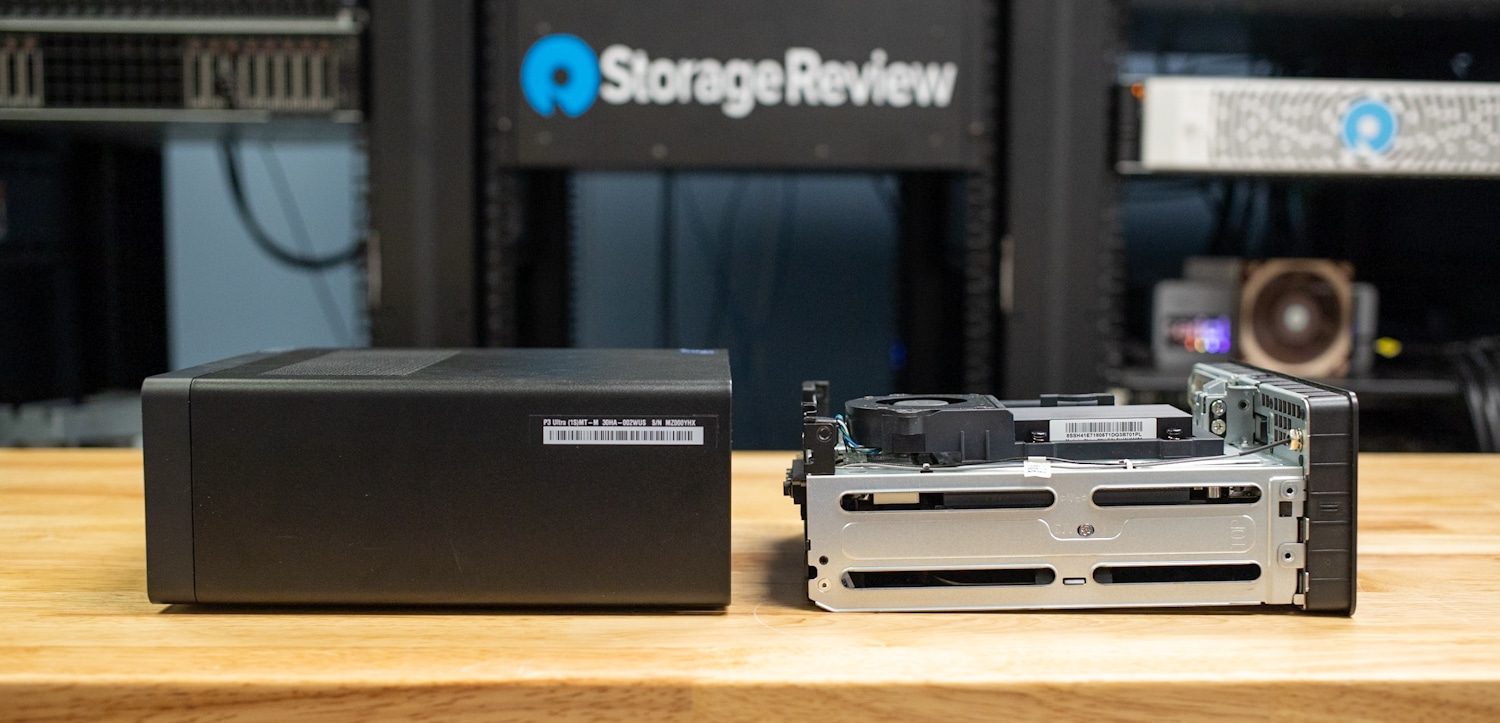
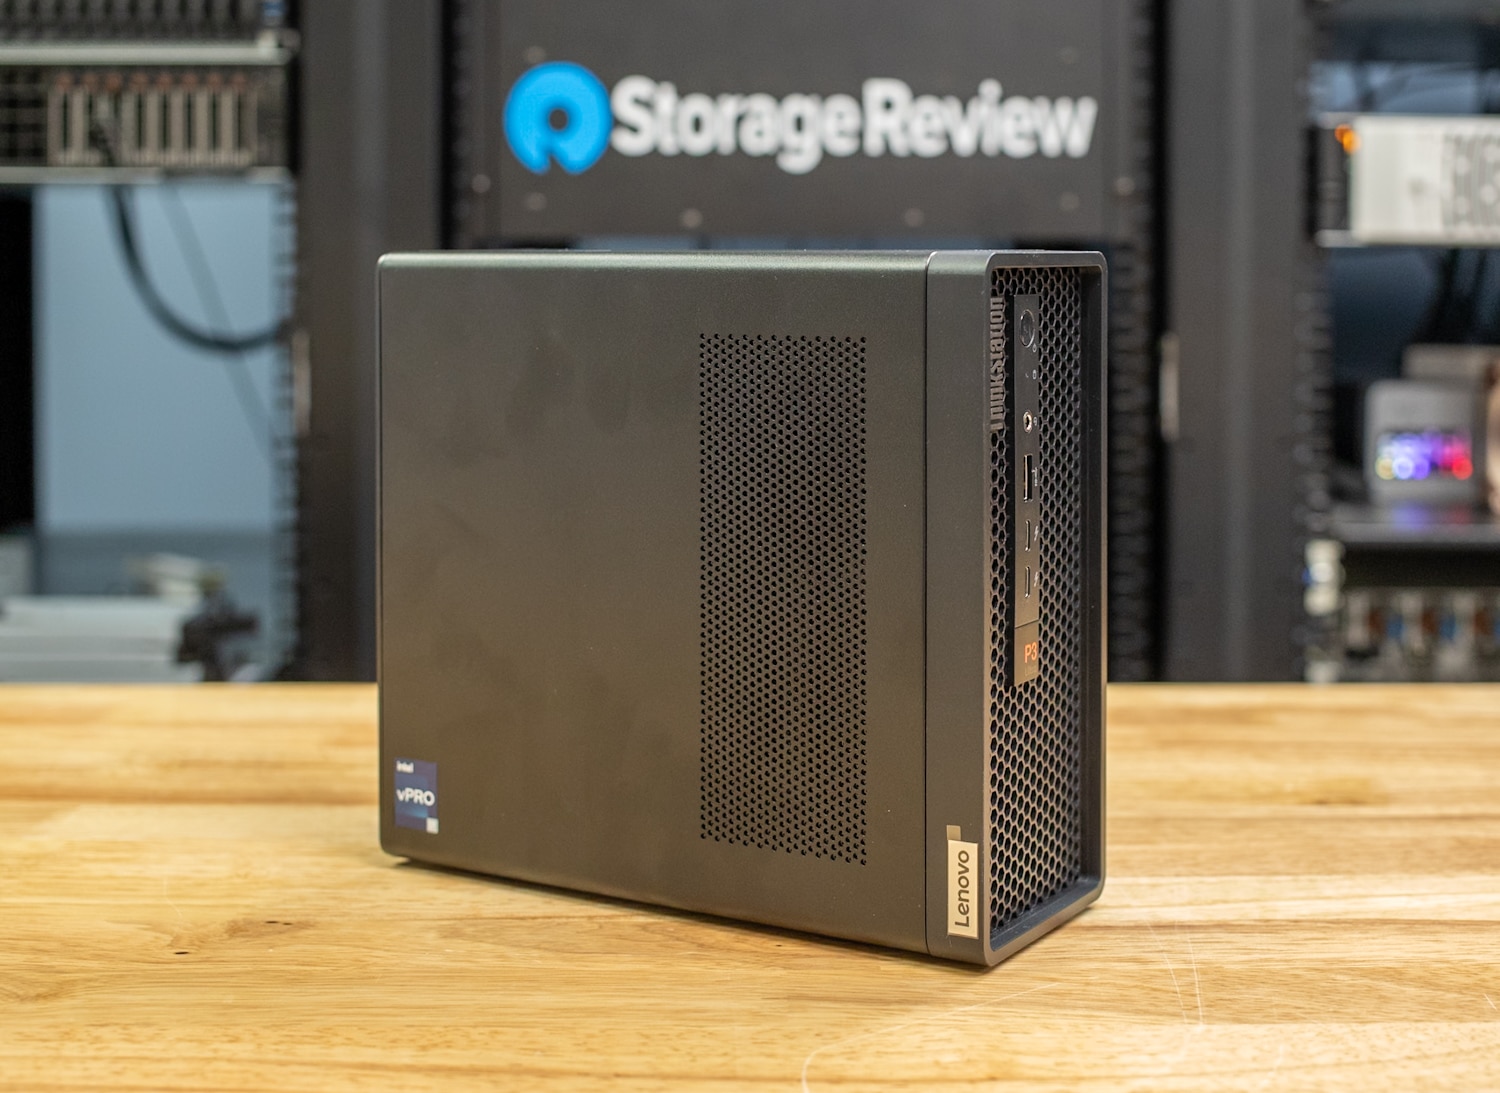
The ThinkStation P3 Ultra, at 7.9 x 3.4 x 8.7 inches, is truly small. Dell’s Precision 3280 Compact is smaller (7 x 3.12 x 8.11 inches). However, both desktops take up the same amount of desk space. It can be oriented horizontally or vertically.
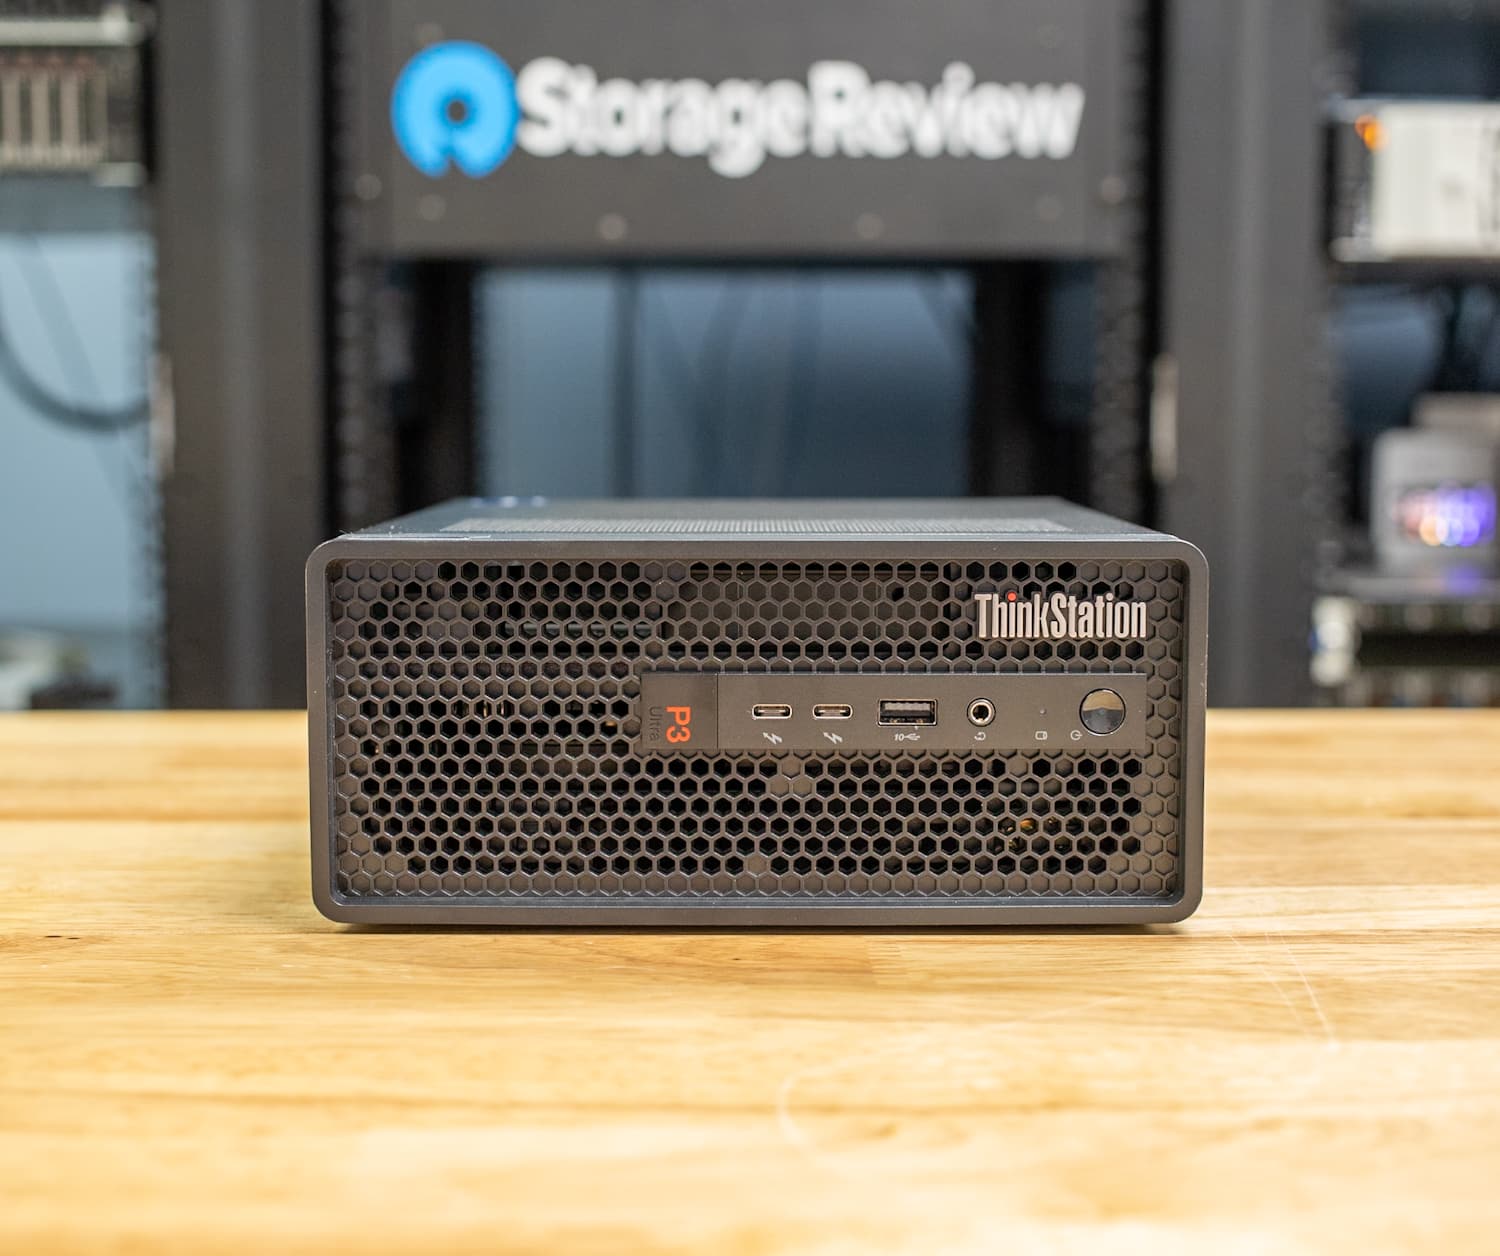
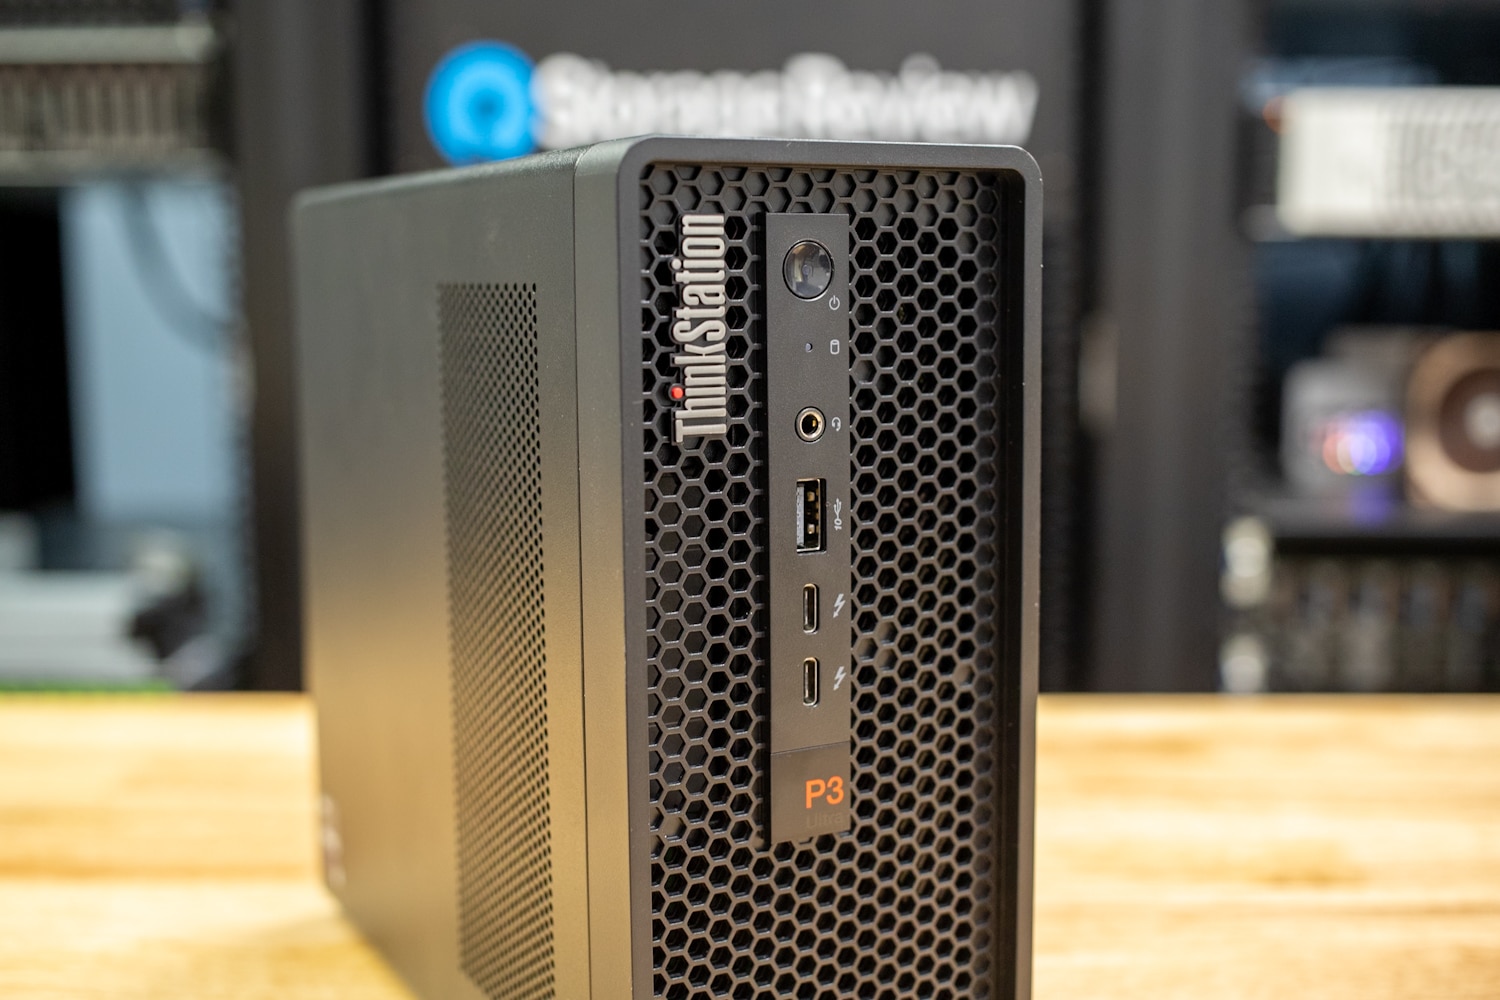
The all-black design is unassuming, though the fact the entire front grille is perforated for airflow is a clear sign that this little desktop is focused on performance. The plastic front and rear bezels are 85% post-consumer content recycled plastic, and the plastic inside is 35%. Lenovo also uses primarily recycled packaging.
Front ports include a 3.5mm headphone/microphone jack, a 10Gbps USB Type-A port, and two Thunderbolt 4 USB Type-C ports. One of the Thunderbolt 4 ports is always on and can charge devices when the desktop is powered off. The power button is also here.
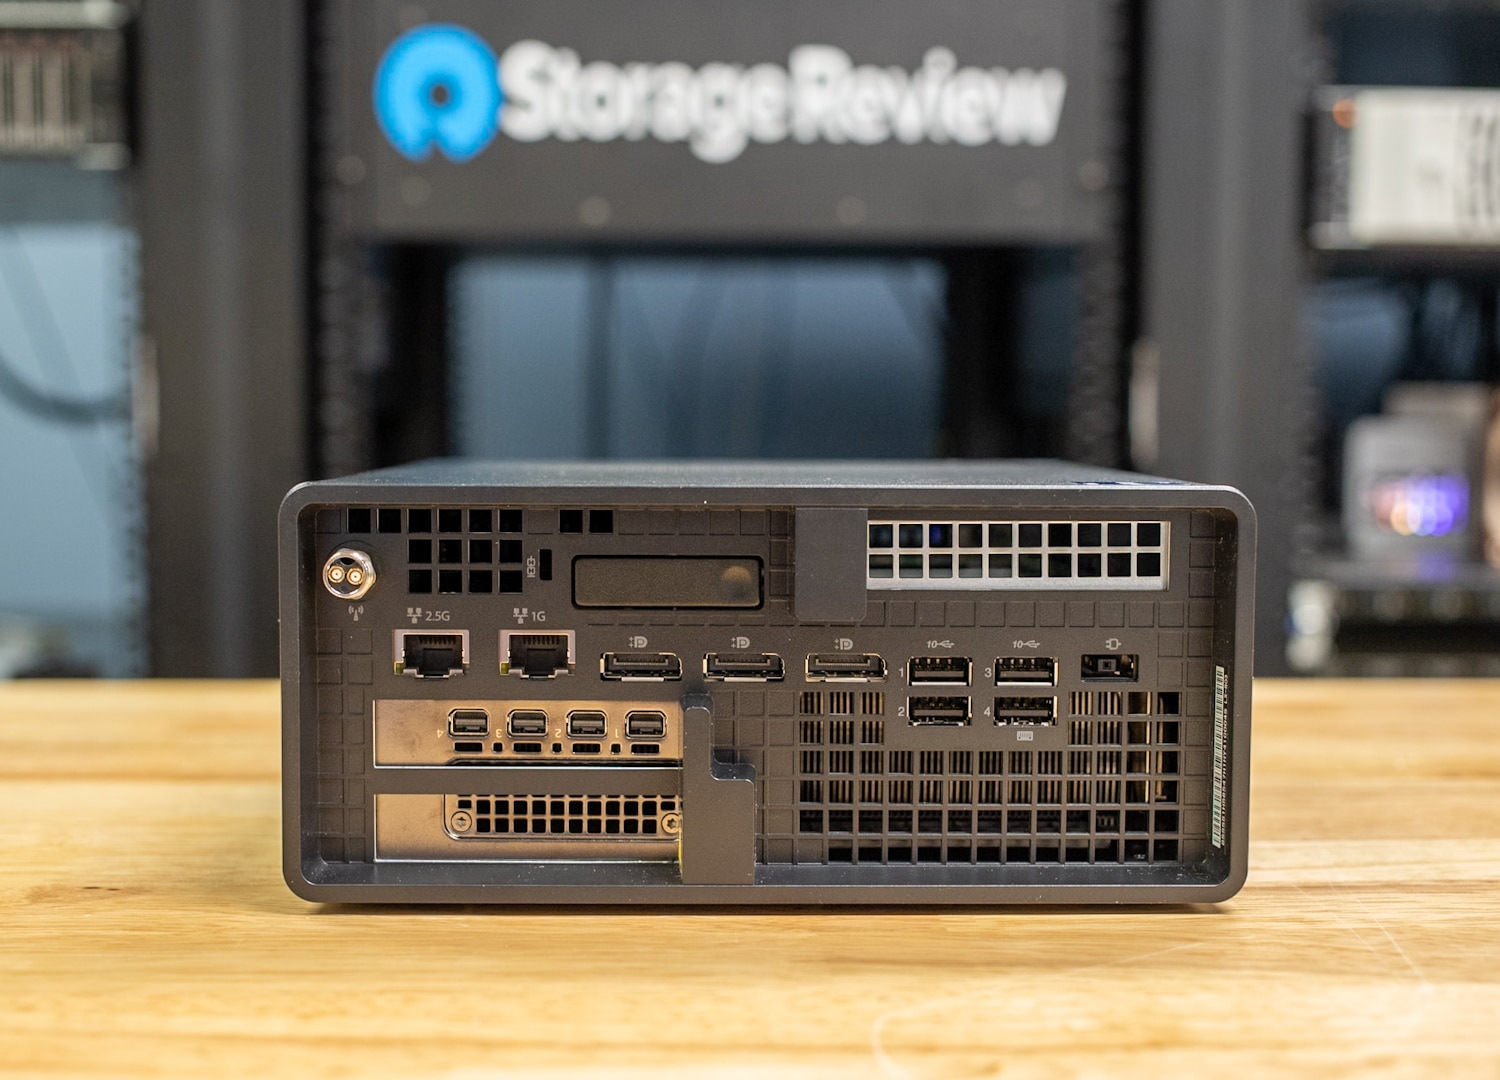
Ports around the back include 1Gbps and 2.5Gbps Ethernet jacks, two DisplayPort 1.2 video outputs, four 10Gbps USB Type-A ports, and the power jack. A laptop-style power brick connects to the latter. Like many desktops in this class, it’s simply too small to fit a power supply internally. The NVIDIA RTX 4000 has four mini-DisplayPort video outputs.
Lenovo ThinkStation P3 Ultra Upgrades
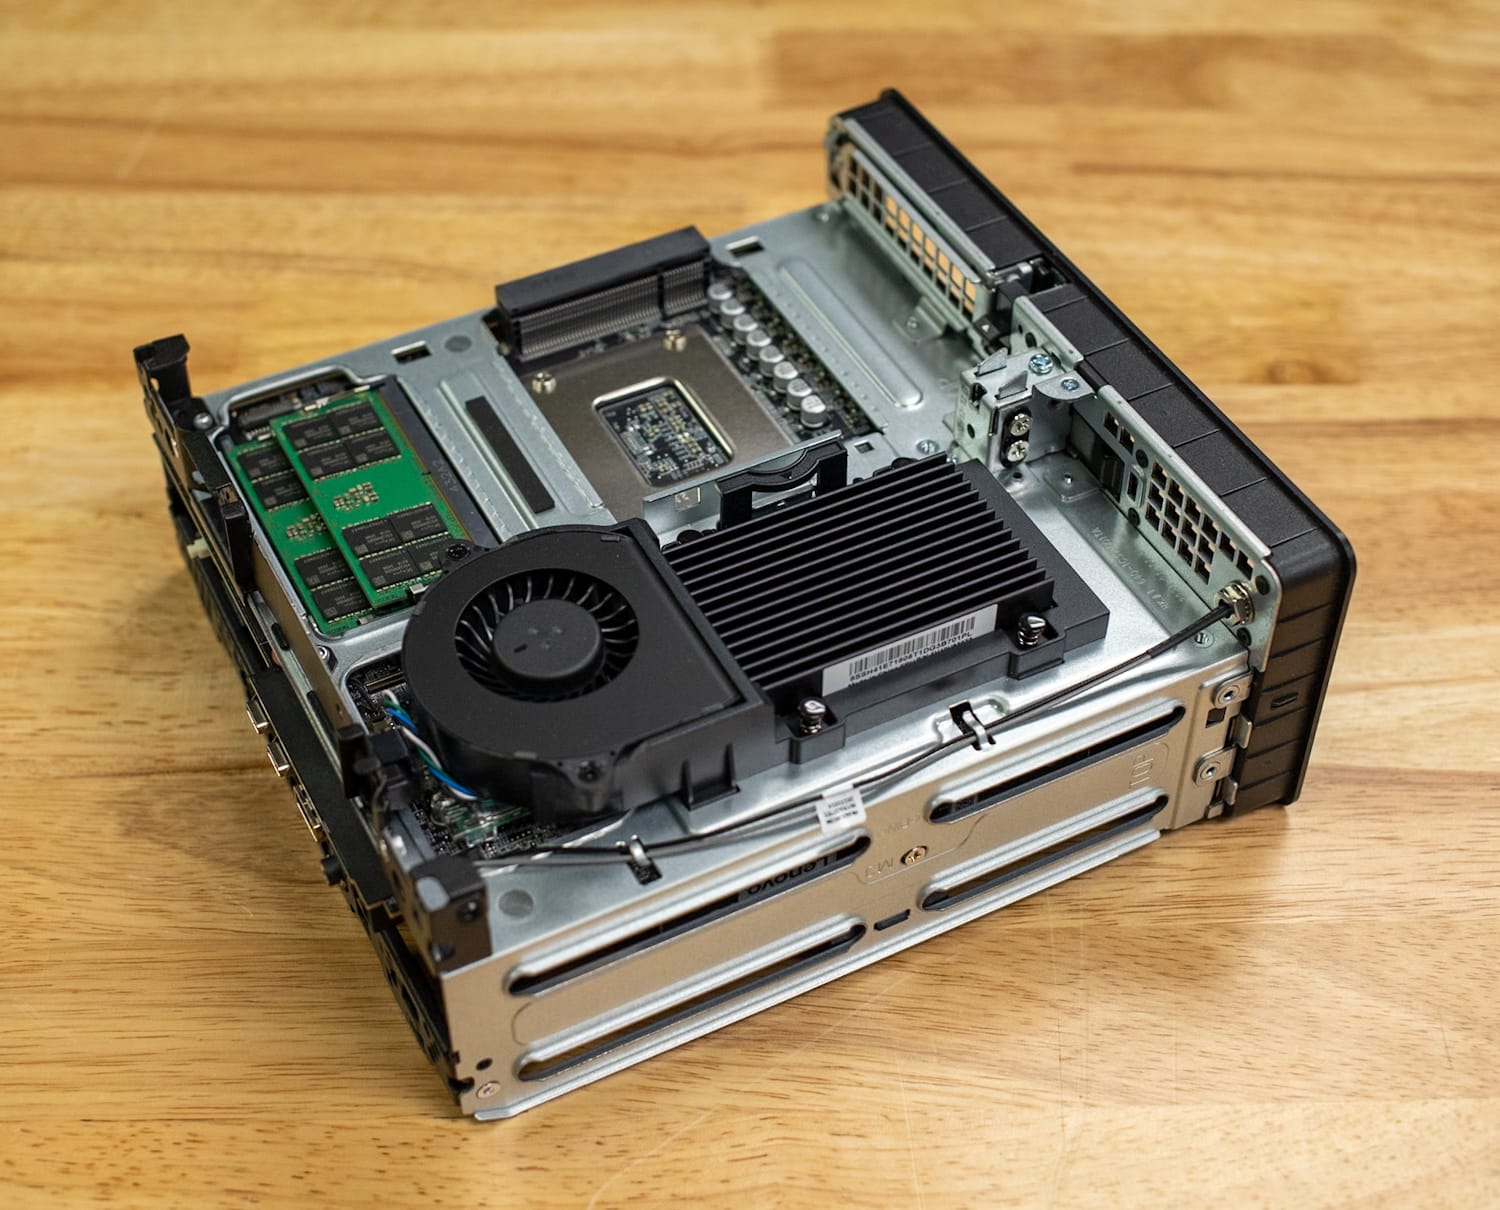
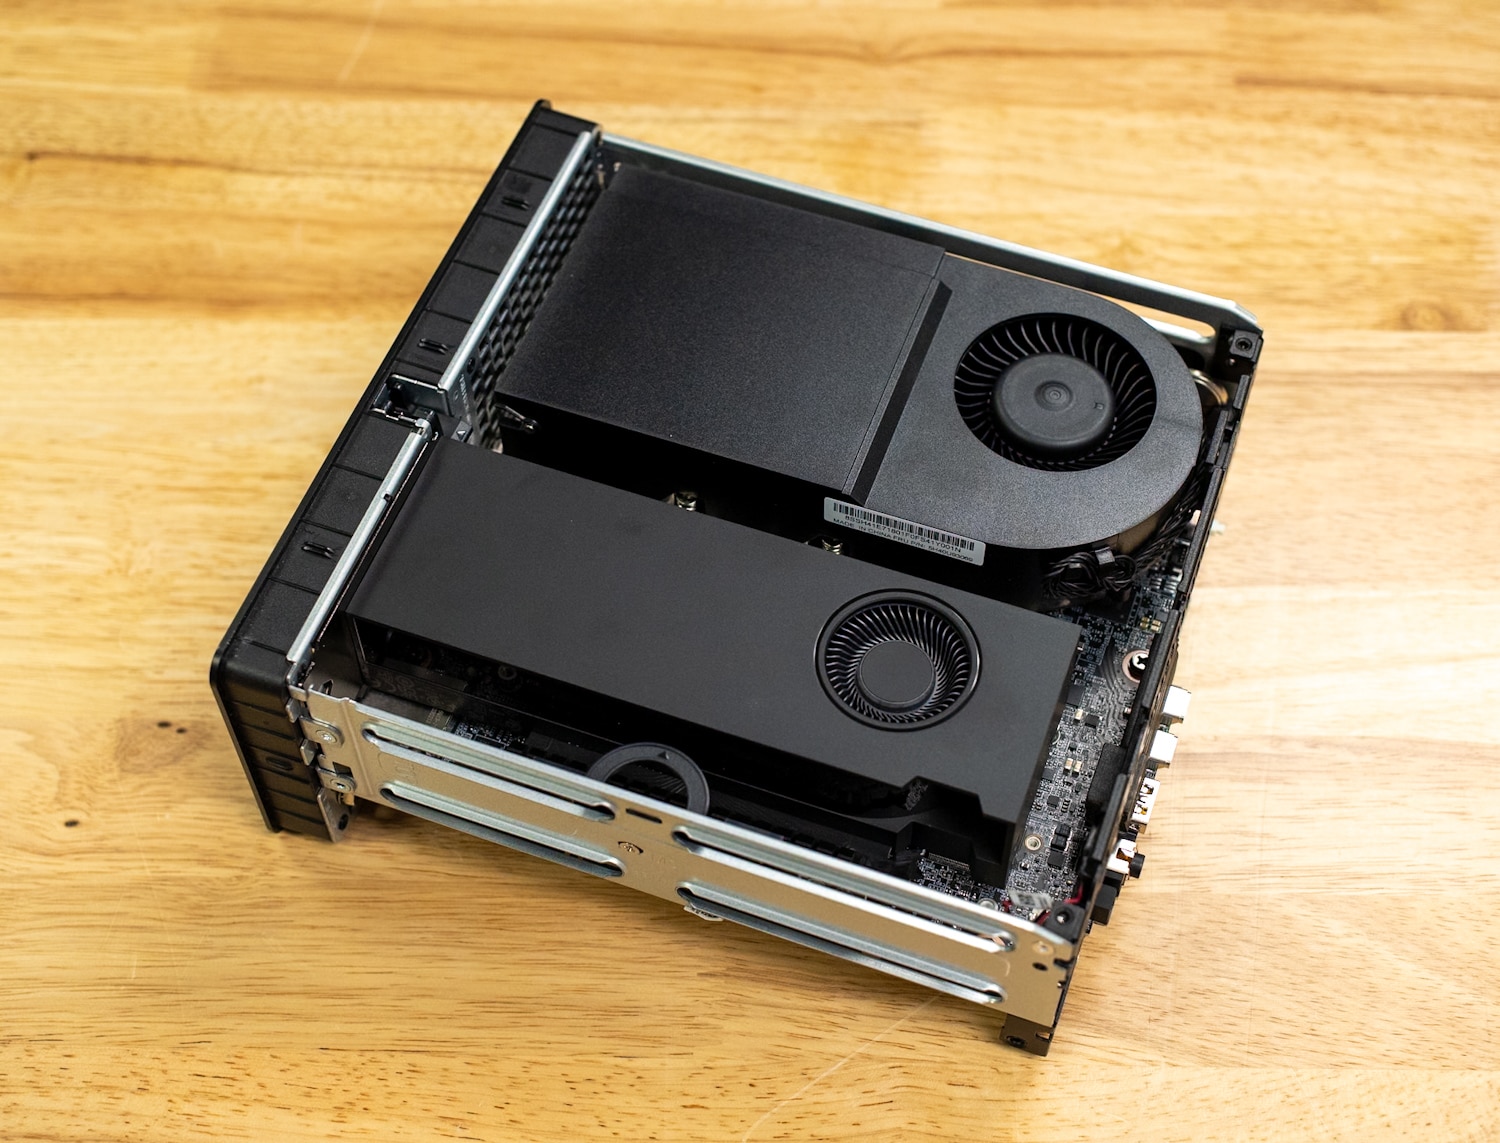
The entire case of this desktop is removable for upgrades. The top side has the two laptop-style SODIMM slots which support ECC memory. The two M.2 storage drives under the heatsink have active cooling.
Flipping the tower over, we see the CPU cooling air shroud and the SFF-style NVIDIA RTX 4000 graphics card. The latter is a standardized form factor. Lenovo intriguingly offers this desktop with a laptop-style NVIDIA RTX A5500 as well.
Lenovo ThinkStation P3 Ultra Specifications
| Processor | 13th/14th Gen Intel Core i3 through i9, 35W/65W/125W |
| Operating System | Windows 11 or Linux Ubuntu |
| Graphics |
|
| Memory |
|
| Storage | Up to 3 drives total:
|
| Ports/Slots | Front:
Rear:
|
| WiFi | Optional: Intel® WiFi 6E AX211 802.11AX (2 x 2)* with vPro & Bluetooth® 5.3 |
| Dimensions | 202mm x 87mm x 223mm / 7.9″ x 3.4″ x 8.7″ |
| Material |
|
| Certifications/Registries |
|
| ThinkShield Security |
|
| Power Supply |
|
| ISV Certifications |
|
Lenovo ThinkStation P3 Ultra Performance
Lenovo sent us a ThinkStation P3 ultra equipped as follows:
- Intel Core i7-13700 CPU
- NVIDIA RTX 4000 Ada Generation GPU
- 64GB DDR5 RAM
- Starting price: $985
- Price as configured: $2,843
Our system has the fastest available GPU, which adds about $2,000. It could be outfitted with more memory and additional storage drives. The Core i7-13700 in our unit is older, but this desktop is readily available with the 14th Gen chips up to the Core i9-14900. Pricing is from Lenovo.com, though buying through a channel partner might yield a better price, especially for enterprise customers buying many units.
Our comparison system is the even smaller Dell Precision 3280 Compact, which we tested with a Core i9-14900 and an RTX 4000 Ada.
It is worth noting here that under maximum load conditions, which many of these tests put the system under, the P3 Ultra will get a little noisy. In an office environment, the noise is largely drowned out, but if this system is going into a quiet room and is expected to be under heavy load, the acoustics of SFF systems should be a consideration. Noise is not specific to the P3 however, any of these SFF systems with dedicated graphics will cause the fans to spin high when asked to handle complex workloads.
SPECworkstation 3
SPECworkstation3 specializes in benchmarks designed for testing all key aspects of workstation performance; it uses over 30 workloads to test CPU, graphics, I/O, and memory bandwidth. The workloads fall into broader categories such as Media and Entertainment, Financial Services, Product Development, Energy, Life Sciences, and General Operations. We will list the results for each broad category instead of the individual workloads. The results are an average of all the individual workloads in each category.
The Lenovo trailed here as expected, given it has a less powerful CPU. We ran into some glitches with the GPU Compute score (which is way too low).
| SPECworkstation 3 (Higher is better) | Lenovo ThinkStation P3 Ultra | Dell Precision 3280 Compact |
| Media and Entertainment | 4.02 | 4.65 |
| Product Development | 4.5 | 5.45 |
| Life Sciences | 4.54 | 2.31 |
| Financial Services | 3.39 | 4.67 |
| Energy | 4.69 | 5.55 |
| General Operations | 3.29 | 3.53 |
| GPU Compute | 0.33 | 6.01 |
SPECviewperf 2020
Our first test is SPECviewperf 2020, the worldwide standard for measuring graphics performance of professional applications under the OpenGL and Direct X application programming interfaces. The viewsets (or benchmarks) represent graphics content and behavior from actual applications without having to install the applications themselves. The newest version of this benchmark went through significant updates late last year, including new viewsets taken from traces of the latest versions of 3ds Max, Catia, Maya, and Solidworks applications. In addition, they added support within all viewsets for both 2K and 4K resolution displays.
As expected, the performance between these towers is almost identical since they have the same RTX 4000 GPU.
| SPECviewperf2020 Viewsets (Higher is better) | Lenovo ThinkStation P3 Ultra | Dell Precision 3280 Compact |
| 3dsmax-07 | 81.25 | 81.96 |
| Catia-06 | 59.64 | 63.44 |
| Creo-03 | 117.66 | 122.52 |
| Energy-03 | 23.89 | 42.4 |
| Maya-06 | 200.15 | 202.42 |
| Medical-03 | 41.13 | 42 |
| Snx-04 | 268.67 | 277.27 |
| Sw-05 | 98.63 | 100.84 |
Luxmark
Another 3D benchmark we will look at is LuxMark, an OpenCL GPU benchmarking utility. Also GPU-focused, we see similar numbers between the Lenovo and Dell.
| Luxmark (Higher is better) | Lenovo ThinkStation P3 Ultra | Dell Precision 3280 Compact |
| Hallbench | 13,420 | 13,617 |
| Food | 5,144 | 5,187 |
Blender OptiX
Blender is an open-source 3D modeling application. This benchmark was run using the Blender Benchmark utility. The score is samples per minute, with higher being better. We run this test on the GPU. The numbers continue to be similar.
| Blender OptiX (Samples per minute, Higher is better) | Lenovo ThinkStation P3 Ultra | Dell Precision 3280 Compact |
| Monster | 1,902 | 1,905 |
| Junkshop | 929 | 934 |
| Classroom | 949 | 960 |
OctaneBench
Next, we look at OctaneBench, a benchmarking utility for OctaneRender, which is another 3D renderer with RTX support similar to V-Ray.
| OctaneBench (Score, higher is better) | Kernel | Lenovo ThinkStation P3 Ultra | Dell Precision 3280 Compact |
| Interior | Info channels | 14.16 | 13.98 |
| Interior | Direct lighting | 44.59 | 44.10 |
| Interior | Path tracing | 54.84 | 54.48 |
| Idea | Info channels | 8.23 | 8.13 |
| Idea | Direct lighting | 34.17 | 34.03 |
| Idea | Path tracing | 41.05 | 41.09 |
| ATV | Info channels | 21.29 | 21.28 |
| ATV | Direct lighting | 44.82 | 44.90 |
| ATV | Path tracing | 56.34 | 56.61 |
| Box | Info channels | 10.91 | 10.94 |
| Box | Direct lighting | 41.15 | 41.50 |
| Box | Path tracing | 45.24 | 26.29 |
7-Zip Compression
We also run the benchmark built into the popular 7-Zip utility. The ThinkStation wasn’t going to win this with its Core i7. It would theoretically be at least as fast as the Dell if equipped with a Core i9.
| 7-Zip Compression Benchmark | ||
| Lenovo ThinkStation P3 Ultra | Dell Precision 3280 Compact | |
| Compressing | ||
| Current CPU Usage | 1,241% | 1,358% |
| Current Rating/Usage | 8.051 GIPS | 9.369 GIPS |
| Current Rating | 99.933 GIPS | 127.249 GIPS |
| Resulting CPU Usage | 1,236% | 1,438% |
| Resulting Rating/Usage | 8.279 GIPS | 9.130 GIPS |
| Resulting Rating | 102.241 GIPS | 131.115 GIPS |
| Decompressing | ||
| Current CPU Usage | 2,310% | 3,111% |
| Current Rating/Usage | 4.881 GIPS | 4.504 GIPS |
| Current Rating | 112.731 GIPS | 140.152 GIPS |
| Resulting CPU Usage | 2,324% | 3,121% |
| Resulting Rating/Usage | 5.037 GIPS | 4.575 GIPS |
| Resulting Rating | 117.077 GIPS | 142.789 GIPS |
| Total Rating | ||
| Total CPU Usage | 1,780% | 2,280% |
| Total Rating/Usage | 6.658 GIPS | 6.853 GIPS |
| Total Rating | 117.077 GIPS | 136.952 GIPS |
UL Procyon AI Inference
UL’s Procyon estimates a workstation’s performance for professional apps. We run this test using Windows ML and TensorRT on the GPU. The Dell was usually a small amount ahead, probably because of its Core i9.
| UL Procyon Average Inference Times (Lower is better) | Lenovo ThinkStation P3 Ultra (TensorRT) | Lenovo ThinkStation P3 Ultra (Windows ML) | Dell Precision 3280 Compact (TensorRT) | Dell Precision 3280 Compact (Windows ML) |
| MobileNet V3 | 0.49 ms | 0.54 ms | 0.44 ms | 0.56 ms |
| ResNet 50 | 1.64 ms | 2.42 ms | 1.56 ms | 2.36 ms |
| Inception V4 | 4.79 ms | 6.33 ms | 4.71 ms | 6.01 ms |
| DeepLab V3 | 4.23 ms | 16.16 ms | 4.28 ms | 13.33 ms |
| YOLO V3 | 5.08 ms | 9.39 ms | 4.99 ms | 9.52 ms |
| Real-ESRGAN | 292.30 ms | 268.58 ms | 280.52 ms | 255.35 ms |
| Overall Score | 930 | 598 | 963 | 626 |
y-cruncher
y-cruncher is a multi-threaded and scalable program that can compute Pi and other mathematical constants to trillions of digits. Since its launch in 2009, it has become a popular benchmarking and stress-testing application for overclockers and hardware enthusiasts. The Core i9 Dell unsurprisingly proved faster.
| y-cruncher (Total computation time, lower is better) | Lenovo ThinkStation P3 Ultra | Dell Precision 3280 Compact |
| 1 billion digits | 30.396 seconds | 22.580 seconds |
| 2.5 billion | 85.409 seconds | 77.587 seconds |
| 5 billion | 189.247 seconds | 174.252 seconds |
| 10 billion | 437.554 seconds | 383.813 seconds |
Geekbench 6
Geekbench 6 is a cross-platform benchmark that measures overall system performance. You can find comparisons to any system you want in the Geekbench Browser. The GPU scores were similar, but the Dell’s Core i9 let it pull ahead elsewhere.
| Geekbench 6 (Higher is better) | Lenovo ThinkStation P3 Ultra | Dell Precision 3280 Compact |
| CPU Single-Core | 2,777 | 2,971 |
| CPU Multi-Core | 15,780 | 19,230 |
| GPU (Dedicated) | 126,020 | 129,038 |
Cinebench R23
This benchmark uses all CPU cores and threads to generate an overall score. We can see Dell’s Core i9 pulling ahead in this test.
| Cinebench R23 (Higher is better) | Lenovo ThinkStation P3 Ultra | Dell Precision 3280 Compact |
| Multi-Core | 18,071 | 23,101 |
| Single-Core | 2,011 | 2,201 |
Cinebench 2024
We also started running the latest Cinebench test.
| Cinebench R23 (Higher is better) | Lenovo ThinkStation P3 Ultra | Dell Precision 3280 Compact |
| Multi-Core | 1,092 | 1,361 |
| Single-Core | 117 | 130 |
| GPU | 12,702 | 12,748 |
Conclusion
Lenovo’s ThinkStation P3 Ultra packs serious power for being so small, with up to a 65-watt Core i9 processor and an NVIDIA RTX 4000 graphics card. We’re also impressed that it fits 128GB of RAM and three storage drives. It also doesn’t disappoint with connectivity, featuring two Thunderbolt 4 ports, which include ISV certifications and Intel vPro support. It’s a fine alternative to the Dell Precision 3280 Compact and gets our recommendation for a compact workstation.
Engage with StorageReview
Newsletter | YouTube | Podcast iTunes/Spotify | Instagram | Twitter | TikTok | RSS Feed

