The Lenovo ThinkStation P5 is a mid-tier enterprise workstation offering Intel “Sapphire Rapids” Xeon W-class processors and dual GPUs in an Aston Martin-inspired chassis.
The Lenovo ThinkStation P5 is a mid-tier enterprise workstation offering Intel “Sapphire Rapids” Xeon W-class processors and dual GPUs in an Aston Martin-inspired chassis.
Lenovo ThinkStation P5 Specifications
The ThinkStation P5 is Lenovo’s least expensive workstation that uses workstation-class processors. This platform is ideal for creative design, rendering, AI and deep learning, and general workstation workloads. It offers more PCIe lanes and a much higher memory ceiling (512GB) than the entry-level ThinkStation P3 Tower, which relies on consumer-class Intel Core CPUs.
As expected from a mid-tier workstation, the ThinkStation P5 also supports two double-wide GPUs up to the NVIDIA RTX A6000. There are hundreds of ways to configure it; Lenovo gladly builds them to order. For more CPU cores (up to 56) and even more expansion, Lenovo also offers its ThinkStation P7.
The ThinkStation P5’s specifications are as follows:
| Processor | Intel “Sapphire Rapids” Xeon w3 through w7 |
| Operating System | Windows 11 Pro for Workstations |
| Graphics | Up to 2x NVIDIA RTX A6000 (48GB) |
| Memory | Up to 512GB DDR5-4800 RDIMM |
| Storage |
|
| Ports/Slots | Front:
Rear:
Optional Rear:
|
| Networking |
Optional WLAN:
|
| Dimensions | 440mm x 165mm x 453mm / 17.3″ x 6.5″ x 17.8″ |
| Weight | Up to 19kg / 41.9lbs |
| Certifications/Registries |
|
| ThinkShield Security |
|
|
|
| ISV Certifications | See complete list |
Lenovo ThinkStation P5 Build and Design
Aston Martin and Lenovo designed the ThinkStation P5’s chassis for thermal performance, though that didn’t stop them from making it visually attractive. This workstation mimics the front fascia of a supercar with its recessed front airflow grate and racy red and black theme.
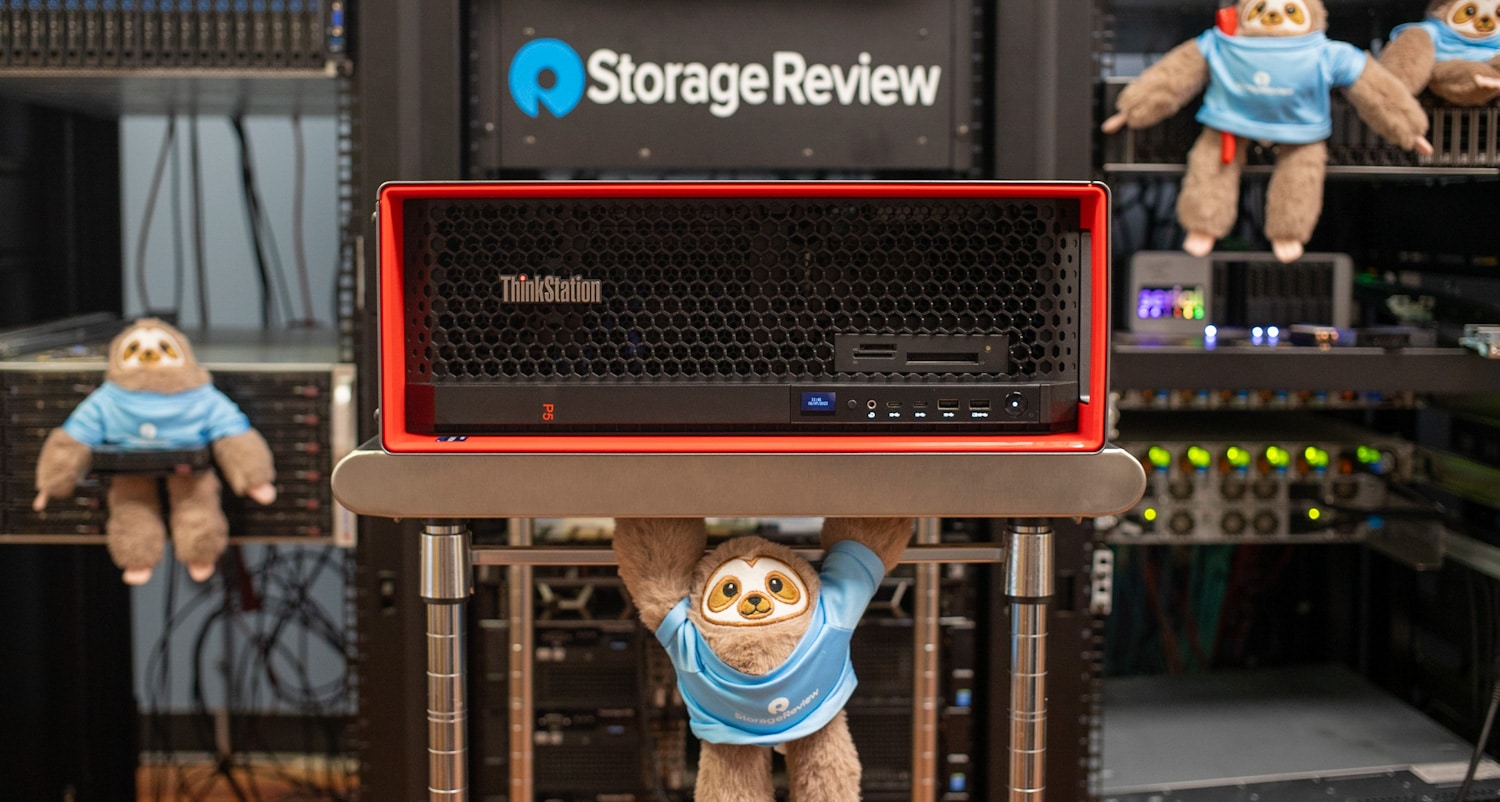
The ThinkStation P5 stands out with its red accents.
At 17.3 by 6.5 by 17.8 inches, the ThinkStation P5 is noticeably larger than the Dell Precision 5860 Tower (16.3 by 6.8 by 16.9 inches); it weighs up to 42 pounds. The top of the chassis has built-in carry handles.
A workstation of this caliber expectedly offers lots of I/O, starting on the front bezel with two 10Gbps USB-A ports (including one always-on charging), two 10Gbps USB-C ports, and a universal audio jack. Conveniently, all the port symbols here are illuminated. The power button is also here.
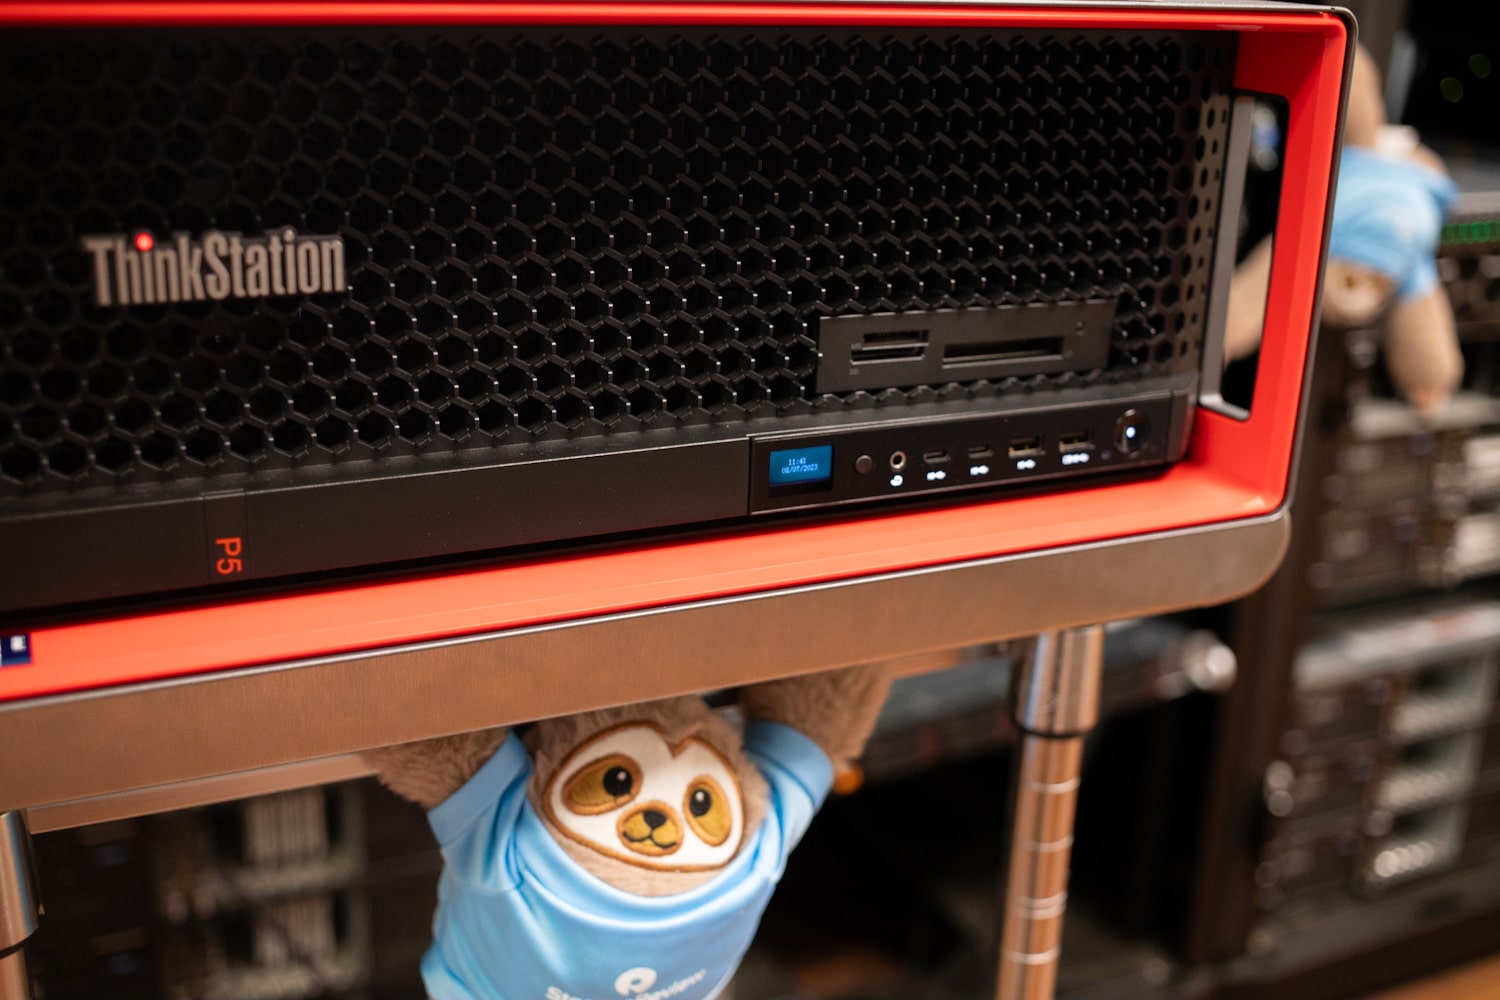
The ThinkStation P5’s front port selection is highly usable.
The front and rear bezels are 65% post-consumer recycled content. The front edge also holds a mini LCD status display; just above it is the optional media card reader. We don’t have the optional NVMe front bay, though, which is an enticing option for quickly transferring large volumes of data.
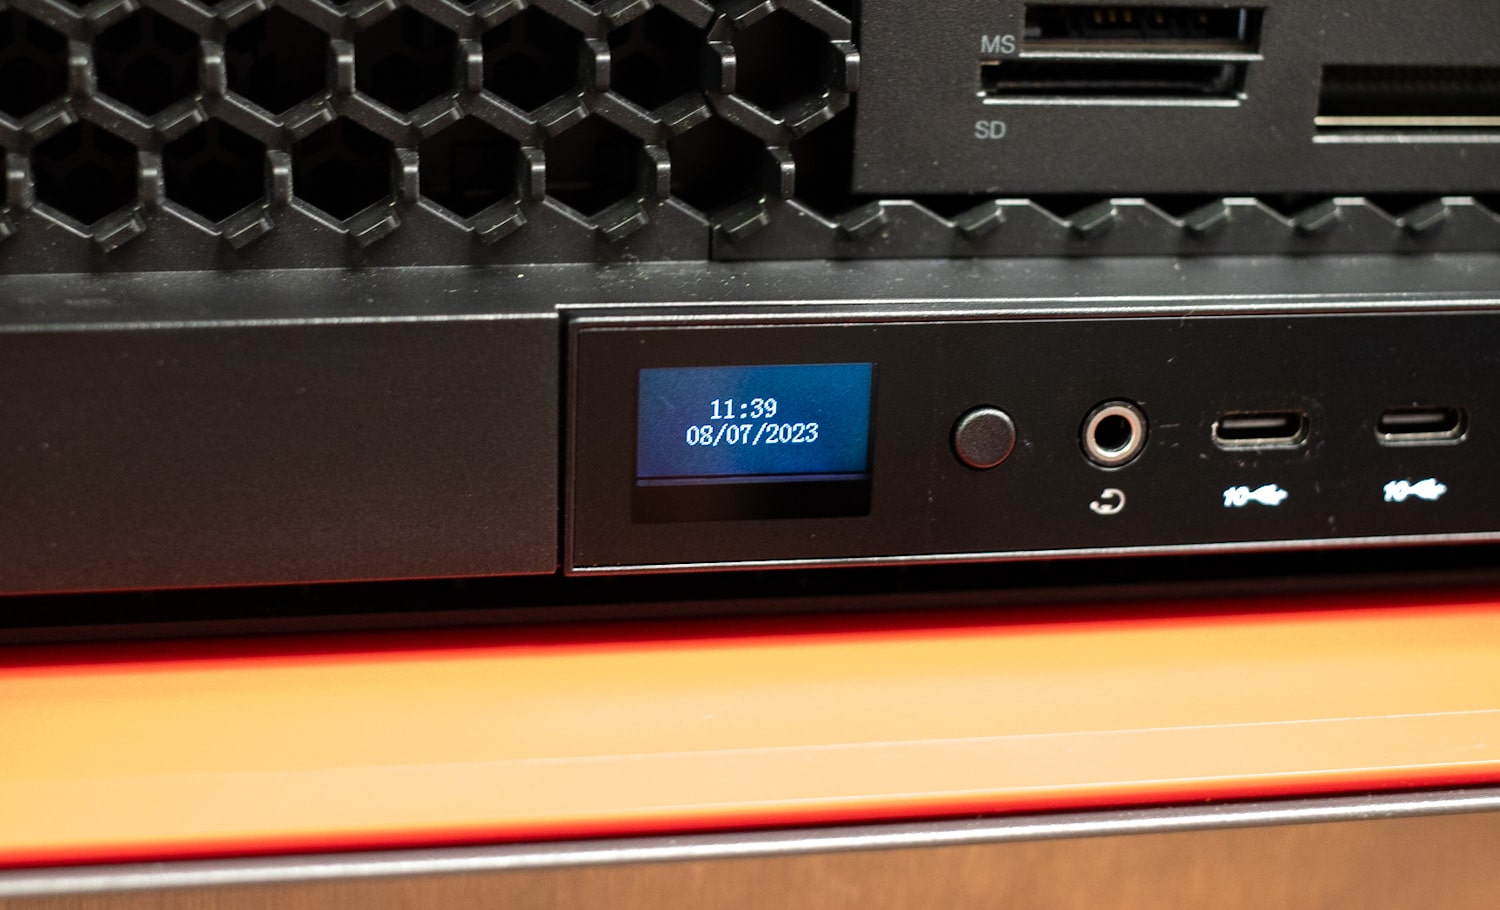
The ThinkStation P5 has a built-in LCD status display.
The motherboard backplane offers two USB 2.0, three 10Gbps USB-A, two 20Gbps USB-C, Gigabit Ethernet, and line-in and line-out audio. Our model doesn’t have the optional Serial port; it would have gone right below the audio jacks. For video output, our unit’s NVIDIA RTX A4500 has four DisplayPort connectors.
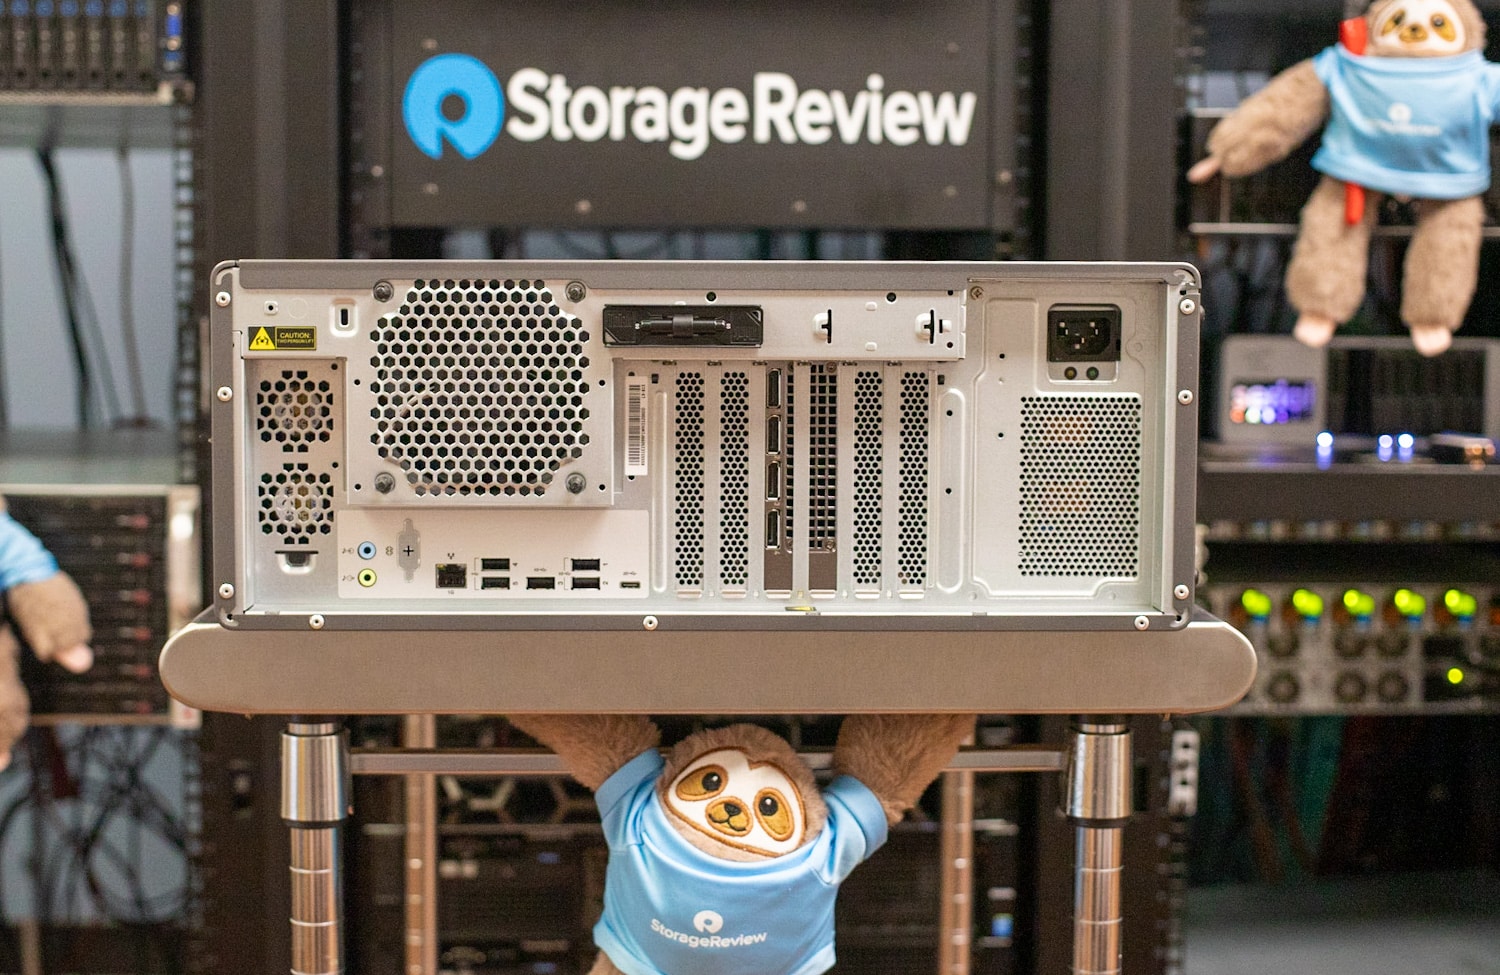
The rear panel offers I/O and many expansion slots.
The ThinkStation P5’s interior is accessible without tools by removing the left panel. A key lock is optional, and there’s also a padlock loop.
The sterile-looking interior is all about function. The airflow is front to back, with the 750-watt power supply sitting at the top, server style. (The plug is on the bottom of the chassis, though.) Lenovo offers a 1,000-watt power supply on more powerful configurations. The system supports only one power supply as expected in this class.
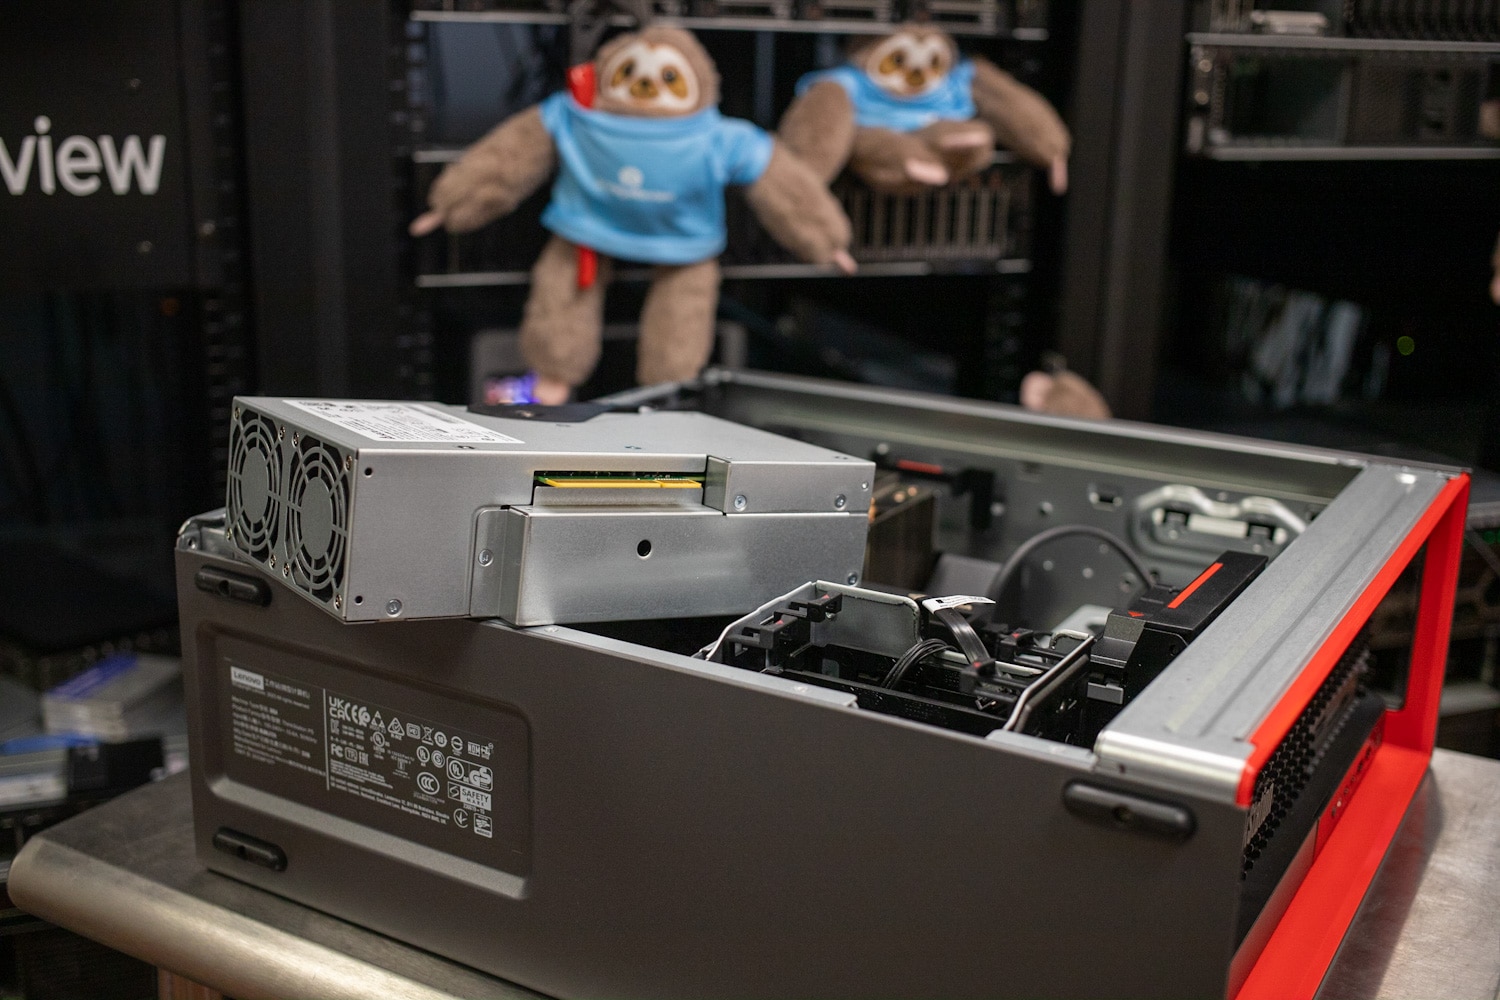
The ThinkStation P5 has a modular, server-style power supply
A plastic airflow shroud surrounds the Xeon CPU’s massive air cooler; it comes off using the red-tipped release handle. Anything red inside this tower is designed to be touched and indicates toolless access. Fan noise is tame under lower loads, but expect it to get noisier if you ramp the GPUs up in activity. Ours resided in a rack in our lab during most of its testing.
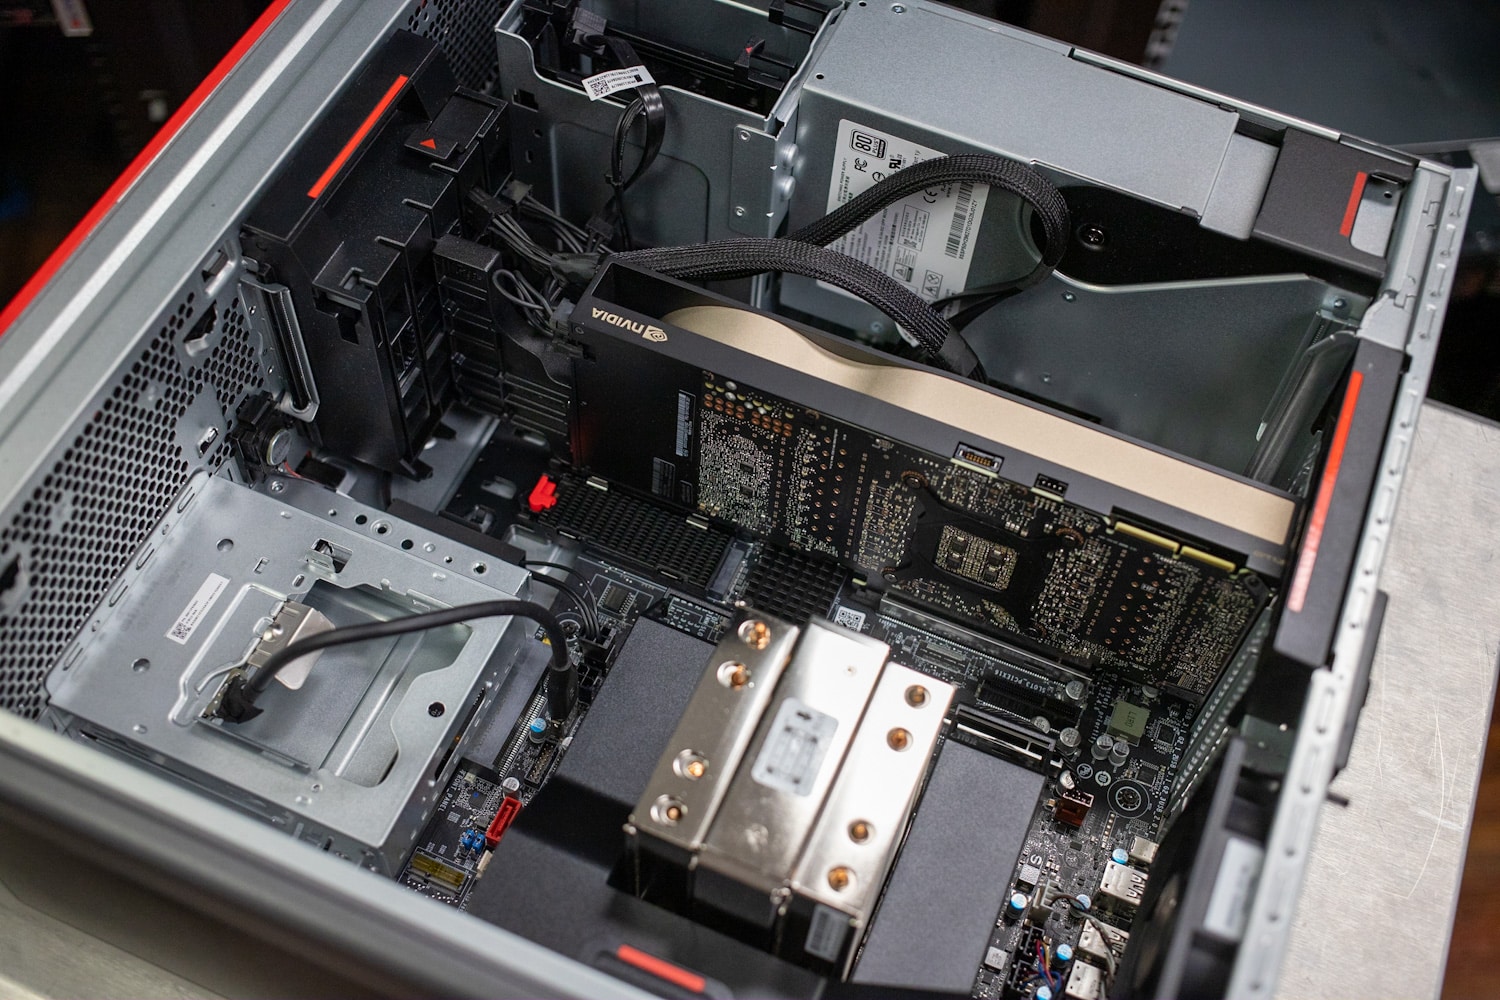
The interior offers lots of space and clean wiring.
Eight RDIMM slots surround the CPU; the ThinkStation P5 supports up to 512GB of DDR5-4800 RAM. The 32GB of RAM in our unit is four 8GB RDIMMs to take advantage of the Xeon w7-2495X’s quad memory channels.
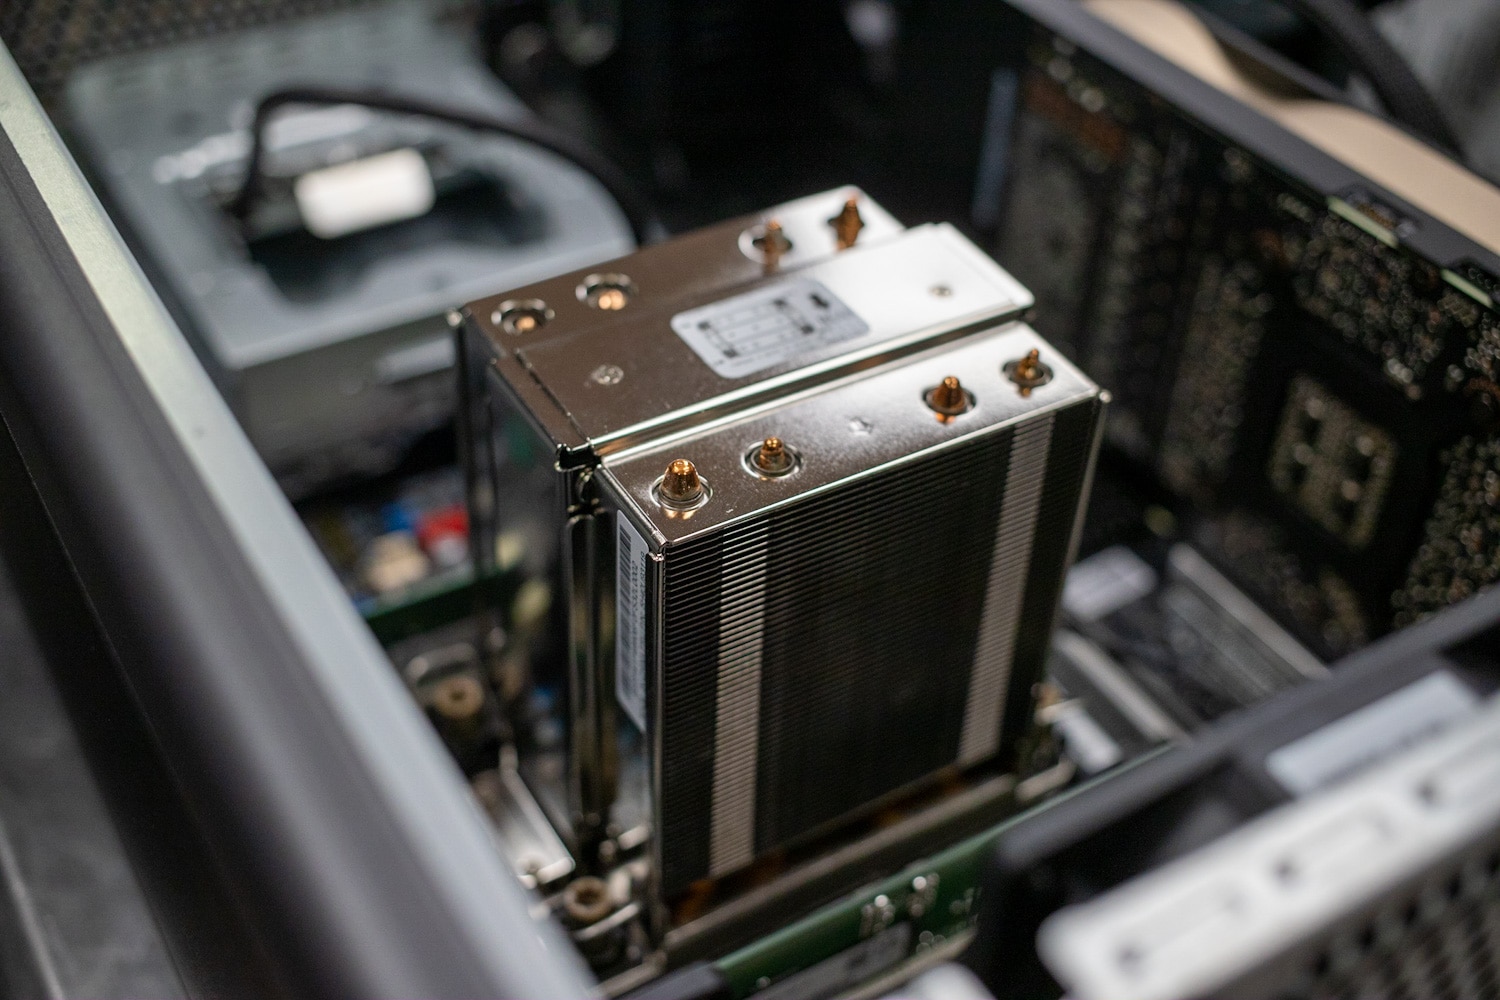
The Xeon w7-2495X requires a tall air cooler.
For storage, the ThinkStation P5 supports two M.2 slots on the motherboard, three 3.5-inch internal drives, and the mentioned front NVMe bay. The ThinkStation P5 is status quo in both memory and storage for this class of workstation.
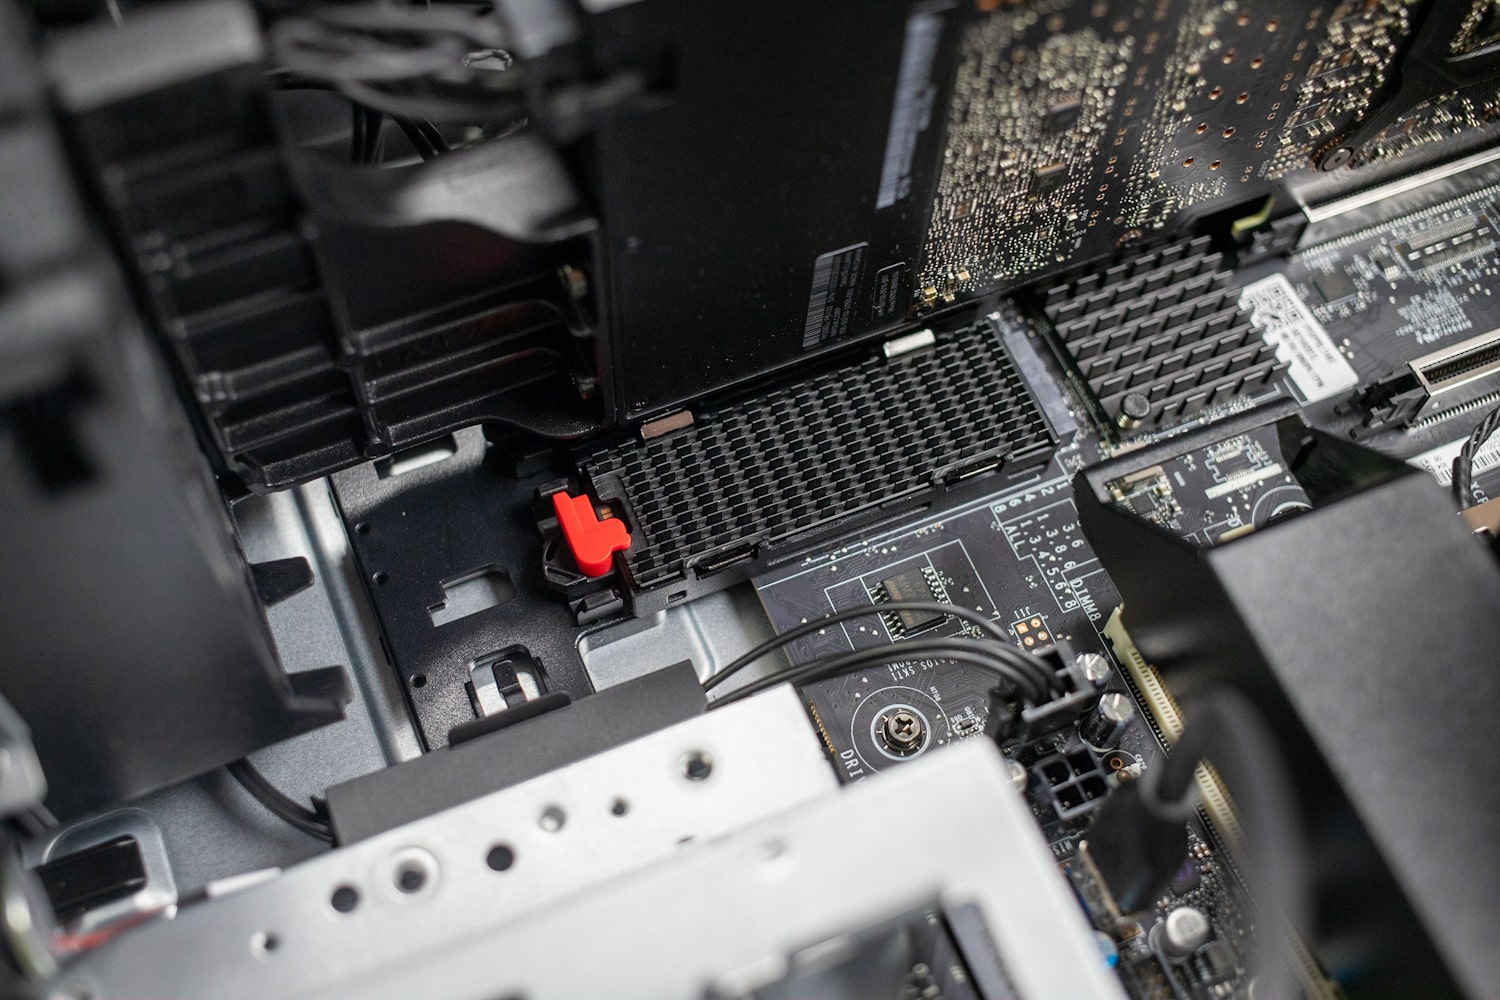
The motherboard features two M.2 slots.
Naturally, Lenovo offers oodles of expansion cards Our unit has one NVIDIA RTX A4500 GPU, but it supports two flagship RTX A6000s for serious AI and deep learning. Available expansion cards include RAID cards, wired and wireless networking cards, and M.2 sleds for extra storage.
Lenovo ThinkStation P5 Performance
We’re testing the ThinkStation P5 configured as follows:
- Windows 11 Pro for Workstations
- Intel Xeon w7-2495X (24 cores, 48 threads, up to 4.8GHz)
- NVIDIA RTX A4500 (20GB)
- 32GB DDR5-4800 ECC
- 512GB Gen4 SSD
- Starting price: $2,551.42
- Price as configured: $5,763.46
The single-unit prices listed here are from Lenovo.com. Typical buyers of this class of workstation are enterprises that are likely to receive significant discounts, which makes pricing comparisons to other workstations superfluous.
We are comparing the ThinkStation P5 to a similarly-equipped Dell Precision 5860 Tower Workstation, which has a Xeon w7-2495X, though it has a faster RTX A6000 (48GB) and 64GB of RAM.
Blender OptiX
Blender is an open-source 3D modeling application. This benchmark was run using the Blender Benchmark utility. The score is samples per minute, with higher being better. The ThinkStation’s RTX A4500 isn’t a match for the Precision’s RTX A6000, so the numbers aren’t too comparable.
| Blender OptiX (Samples per minute, Higher is better) | Lenovo ThinkStation P5 (Xeon w7-2495X, RTX A4500) | Dell Precision 5860 (Xeon w7-2495X, RTX A6000) |
| Monster | 2,236.09 | 2,804.91 |
| Junkshop | 1,374.00 | 1,777.03 |
Luxmark
Another 3D benchmark we will be looking at is LuxMark, an OpenCL GPU benchmarking utility. Here again we see the disparity between the GPUs in these units.
| Luxmark (Higher is better) | Lenovo ThinkStation P5 (Xeon w7-2495X, RTX A4500) | Dell Precision 5860 (Xeon w7-2495X, RTX A6000) |
| Hallbench | 16,516 | 21,716 |
| food | 5,793 | 8,047 |
ESRI
Next up is the Environmental Systems Research Institute (Esri) benchmark. Esri is a supplier of Geographic Information System (GIS) software. Esri’s Performance Team designed their PerfTool add-in scripts to automatically launch the ArcGIS Pro. This application uses a “ZoomToBookmarks” function to browse various predefined bookmarks and create a log file with all the key data points required to predict the user experience. The script automatically loops the bookmarks three times to account for caching (memory and disk cache). In other words, this benchmark simulates heavy graphical use that one might see through Esri’s ArcGIS Pro software.
The tests consist of three main datasets. Two are 3-D city views of Philadelphia, PA, and Montreal, QC. These city views contain textured 3-D multipatch buildings draped on a terrain model and draped aerial images. The third dataset is a 2-D map view of the Portland, OR region. This data contains detailed information for roads, land use parcels, parks and schools, rivers, lakes, and hill-shaded terrain.
The Precision naturally performed better in these tests, thanks to its more powerful GPU, but the ThinkStation’s RTX A4500 is very capable for workloads of this nature.
First up is the Montreal model.
| ESRI ArcGIS Pro 2.3 Montreal | |
| Average FPS | Average |
| Lenovo ThinkStation P5 (Xeon w7-2495X, RTX A4500) | 432.43 |
| Dell Precision 5860 (Xeon w7-2495X, RTX A6000) | 571.87 |
| Minimum FPS | Average |
| Lenovo ThinkStation P5 (Xeon w7-2495X, RTX A4500) | 227.93 |
| Dell Precision 5860 (Xeon w7-2495X, RTX A6000) | 269.05 |
Next up is Philly.
| ESRI ArcGIS Pro 2.3 Philly | |
| Average FPS | Average |
| Lenovo ThinkStation P5 (Xeon w7-2495X, RTX A4500) | 382.28 |
| Dell Precision 5860 (Xeon w7-2495X, RTX A6000) | 455.11 |
| Minimum FPS | Average |
| Lenovo ThinkStation P5 (Xeon w7-2495X, RTX A4500) | 233.12 |
| Dell Precision 5860 (Xeon w7-2495X, RTX A6000) | 267.14 |
Last is the Portland model.
| ESRI ArcGIS Pro 2.3 Portland | |
| Average FPS | Average |
| Lenovo ThinkStation P5 (Xeon w7-2495X, RTX A4500) | 1,849.67 |
| Dell Precision 5860 (Xeon w7-2495X, RTX A6000) | 1,105.49 |
| Minimum FPS | Average |
| Lenovo ThinkStation P5 (Xeon w7-2495X, RTX A4500) | 1,052.55 |
| Dell Precision 5860 (Xeon w7-2495X, RTX A6000) | 758.12 |
OctaneBench
Next, we look OctaneBench, a benchmarking utility for OctaneRender, which is another 3D renderer with RTX support that is similar to V-Ray. There wasn’t always a massive difference between the ThinkStation and Precision.
| OctaneBench (Score, higher is better) | Kernel | Lenovo ThinkStation P5 (Xeon w7-2495X, RTX A4500) | Dell Precision 5860 (Xeon w7-2495X, RTX A6000) |
| Interior | Info channels | 16.44 | 18.15 |
| Interior | Direct lighting | 56.47 | 66.92 |
| Interior | Path tracing | 71.63 | 86.89 |
| Idea | Info channels | 10.20 | 11.35 |
| Idea | Direct lighting | 43.92 | 52.73 |
| Idea | Path tracing | 53.89 | 64.84 |
| ATV | Info channels | 25.12 | 28.53 |
| ATV | Direct lighting | 61.42 | 74.63 |
| ATV | Path tracing | 76.97 | 93.79 |
| Box | Info channels | 14.03 | 15.56 |
| Box | Direct lighting | 55.50 | 66.64 |
| Box | Path tracing | 62.48 | 75.42 |
Blackmagic RAW Speed Test
We have also started running Blackmagic’s RAW speed test, which tests video playback.
| Blackmagic RAW Speed Test (Higher is better) | Lenovo ThinkStation P5 (Xeon w7-2495X, RTX A4500) | Dell Precision 5860 (Xeon w7-2495X, RTX A6000) |
| 8K CPU | 98 fps | 127 fps |
| 8K CUDA | 146 fps | 178 fps |
7-Zip Compression
Our next test is the built-in memory benchmark in the popular 7-Zip utility. The more important decompression testing shows similar performance between the two, which is to be expected given they share the same CPU. The Dell had an overall advantage, though, suggesting either its CPU had more thermal headroom and/or its memory configuration was more effective.
| 7-Zip Compression Benchmark (Higher is better) | Lenovo ThinkStation P5 (Xeon w7-2495X, RTX A4500) | Dell Precision 5860 (Xeon w7-2495X, RTX A6000) |
| Current CPU Usage | 2585% | 2505% |
| Current Rating/Usage | 4.876 GIPS | 6.679 GIPS |
| Current Rating | 126.043 GIPS | 167.332 GIPS |
| Resulting CPU Usage | 2572% | 2516% |
| Resulting Rating/Usage | 4.761 GIPS | 6.676 GIPS |
| Resulting Rating | 122.489 GIPS | 167.962 GIPS |
| Decompressing | ||
| Current CPU Usage | 4745% | 4725% |
| Current Rating/Usage | 3.819 GIPS | 3.879 GIPS |
| Current Rating | 181.197 GIPS | 183.259 GIPS |
| Resulting CPU Usage | 4718% | 4724% |
| Resulting Rating/Usage | 3.836 GIPS | 3.874 GIPS |
| Resulting Rating | 180.965 GIPS | 183.014 GIPS |
| Total Rating | ||
| Total CPU Usage | 3645% | 3260% |
| Total Rating/Usage | 4.298 GIPS | 5.275 GIPS |
| Total Rating | 151.727 GIPS | 175.488 GIPS |
Blackmagic Disk Speed Test
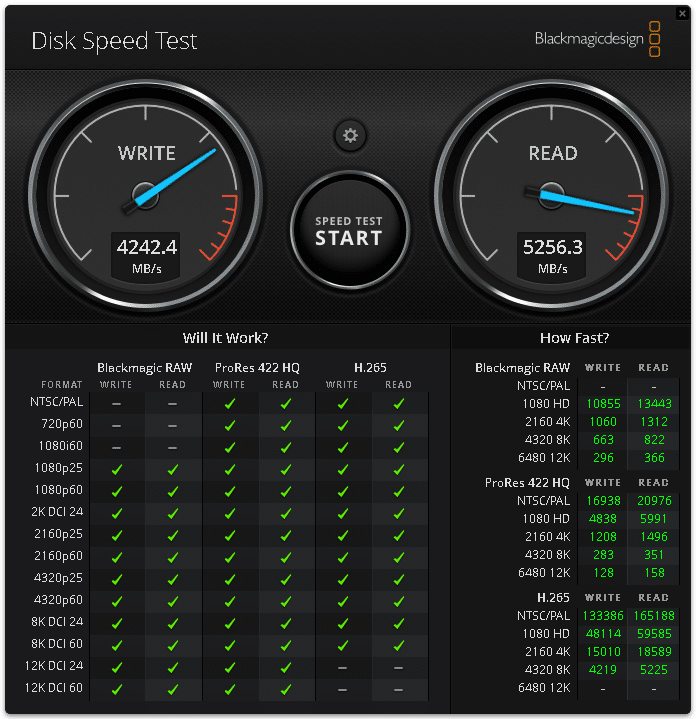
We run the popular Blackmagic Disk Speed Test against the system’s primary storage drive. The ThinkStation’s drive pushed Gen4 bandwidth limits.
UL Procyon AI Inference
UL’s Procyon estimates a workstation’s performance for professional apps. This testing is done on the CPU and then on the GPU, the latter capable of much lower inference times. Most tests showed little difference on the CPU front.
| UL Procyon Average Inference Times (Lower is better) | Lenovo ThinkStation P5 (Xeon w7-2495X) | Lenovo ThinkStation P5 (RTX A4500) | Dell Precision 5860 (Intel Xeon w7-2495X) | Dell Precision 5860 (NVIDIA RTX A6000) |
| MobileNet V3 | 1.81 ms | 0.60 ms | 1.84 ms | 0.60 ms |
| ResNet 50 | 6.70 ms | 1.67 ms | 6.73 ms | 1.50 ms |
| Inception V4 | 18.41 ms | 5.07 ms | 18.58 ms | 4.62 ms |
| DeepLab V3 | 24.67 ms | 4.54 ms | 24.63 ms | 3.94 ms |
| YOLO V3 | 30.00 ms | 5.32 ms | 30.53 ms | 4.49 ms |
| Real-ESRGAN | 2,014.35 ms | 184.73 ms | 1,570.19 ms | 127.51 ms |
3DMark
We recently started running the consumer 3DMark benchmark on workstations to gauge GPU performance. The tabled test results for the ThinkStation P5 are below.
| Test | Overall Score (Higher is Better) |
| Speedway | 3,593 |
| Port Royal | 8,549 |
| Time Spy Extreme | 7,007 |
| Fire Strike Ultra | 8,111 |
y-cruncher
y-cruncher is a multi-threaded and scalable program that can compute Pi and other mathematical constants to trillions of digits. Since its launch in 2009, it has become a popular benchmarking and stress-testing application for overclockers and hardware enthusiasts. The Dell completed this test much more quickly than the Lenovo, so perhaps indeed its CPU has more thermal legroom, though we can’t discount that the memory configuration may also be a factor.
| y-cruncher (Total Computation time) | Lenovo ThinkStation P5 (Xeon w7-2495X, RTX A4500) | Dell Precision 5860 (Xeon w7-2495X, RTX A6000) |
| 1 billion digits | 27.816 seconds | 16.009 seconds |
Conclusion
Lenovo’s ThinkStation P5 brings to the table what we expect from a mid-tier workstation, including lots of expansion, support for 24 CPU cores, a 512GB memory ceiling, and dual high-end GPU support. It also keeps up with the times with an available front NVMe bay, a plethora of security features, and toolless access to nearly every component. It compared favorably to the Dell Precision 5860 Tower in our testing and gets our general recommendation for a mid-tier enterprise workstation.
Engage with StorageReview
Newsletter | YouTube | Podcast iTunes/Spotify | Instagram | Twitter | TikTok | RSS Feed

