An Aston Martin-inspired chassis and dual Xeon CPUs make Lenovo’s flagship workstation, the Lenovo ThinkStation PX, one of a kind.
An Aston Martin-inspired chassis and dual Xeon CPUs make Lenovo’s flagship workstation, the Lenovo ThinkStation PX, one of a kind.
Lenovo ThinkStation PX Specifications
The ThinkStation PX is Lenovo’s most powerful workstation, sporting dual Intel Xeon “Sapphire Rapids” processors and four high-end, double-wide professional graphics cards. It’s a step up from the ThinkStation P7, which is a step up from the ThinkStation P5. The ThinkStation PX tops out with two 48-core Xeon Platinum chips for an unprecedented total of 96 cores and 192 threads. Its RAM ceiling is 2TB, and its storage options are almost limitless.
Competition for the ThinkStation PX mainly comes from HP’s dual-CPU Z8, not to be confused with the Z8 Fury G5. Intel stated this is the last generation for dual-CPU workstations, so get one while they last. You’ll need to step up to a server for more processing power than this platform offers.
The ThinkStation PX has the following specifications. Especially note its laundry list of security features, always paramount in an enterprise workstation, and its Independent Software Vendor (ISV) certifications.
| Processor |
|
| Operating System | Windows 11 Pro for Workstations |
| Graphics |
|
| Memory | Up to 2048 GB DDR5-4800MHz (RDIMM, ECC) |
| Storage |
|
| RAID |
|
| Ports/Slots | Front:
Rear:
Optional Rear:
|
| Networking | Onboard Ethernet:
Optional Ethernet:
Optional WLAN:
|
| Dimensions | 435mm x 220mm x 575mm / 17.1″ x 8.7″ x 22.6″ |
| Weight | Up to 38kg / 83.8lbs |
| Certifications/Registries |
|
| ThinkShield Security |
|
| Power Supply |
|
| ISV Certifications | See the complete list |
Lenovo ThinkStation PX Build and Design
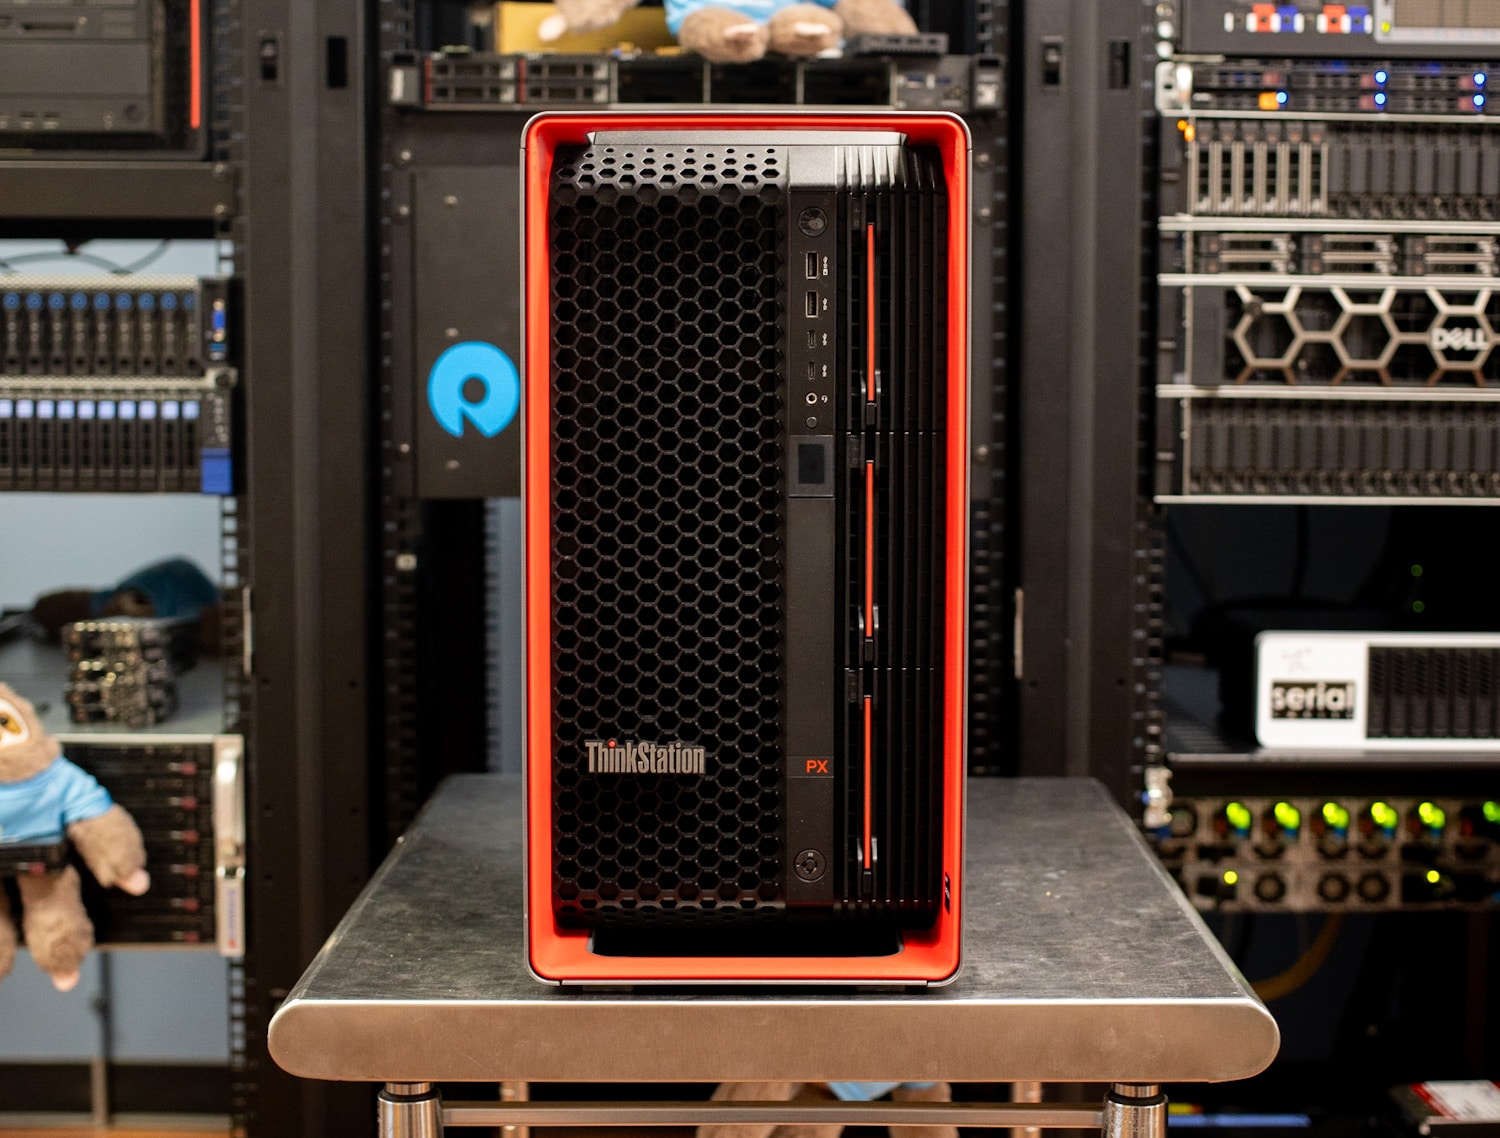
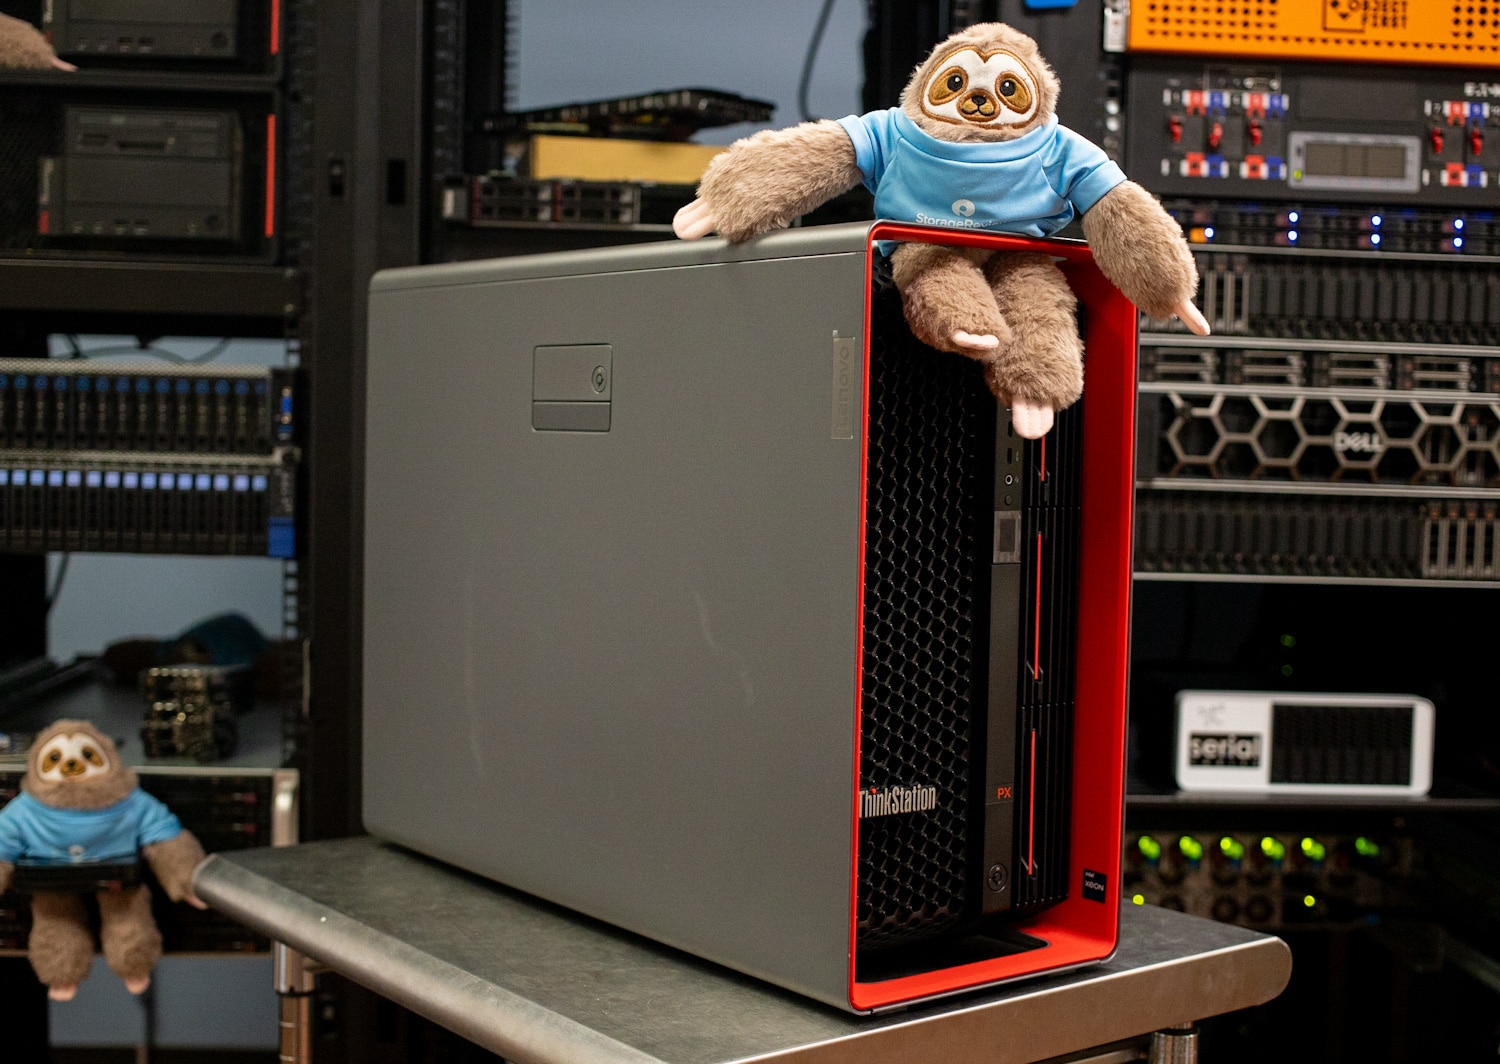
Lenovo and car maker/race team Aston Martin collaborated on the ThinkStation PX’s chassis design. The result is a much flashier look than the drab business workstations we’re used to, with aggressive red accents. The honeycomb front panel looks like it came out of a supercar.
The ThinkStation PX is one of the largest tower workstations, at 17.1″ x 8.7″ x 22.6″ and weighing up to a whopping 83 pounds. It’s a monster among monsters. Carry handles at the top help move it. (At the minimum, they help get it out of the shipping crate.)
Front-panel ports include four 10Gbps USB ports (two Type-A and two Type-C) and a headphone/microphone jack.
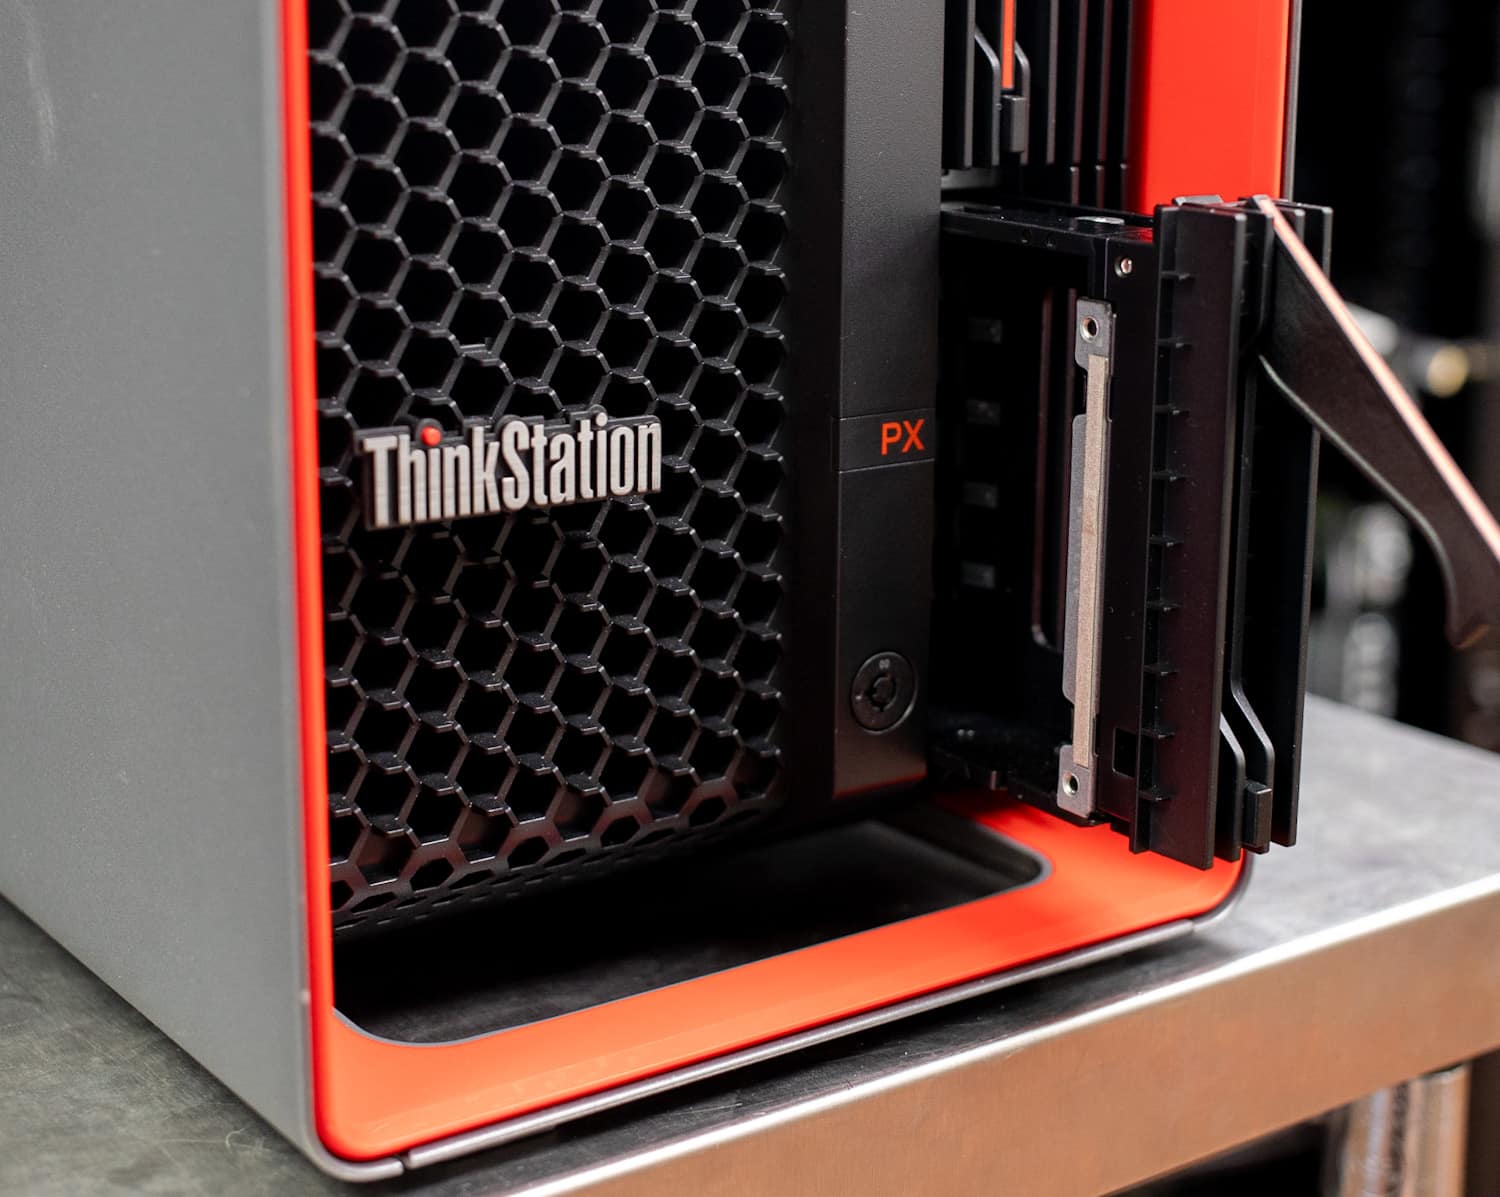
Front hot-swap storage options include two 3.5-inch bays and M.2 NVMe SSD sleds with an optional lock.
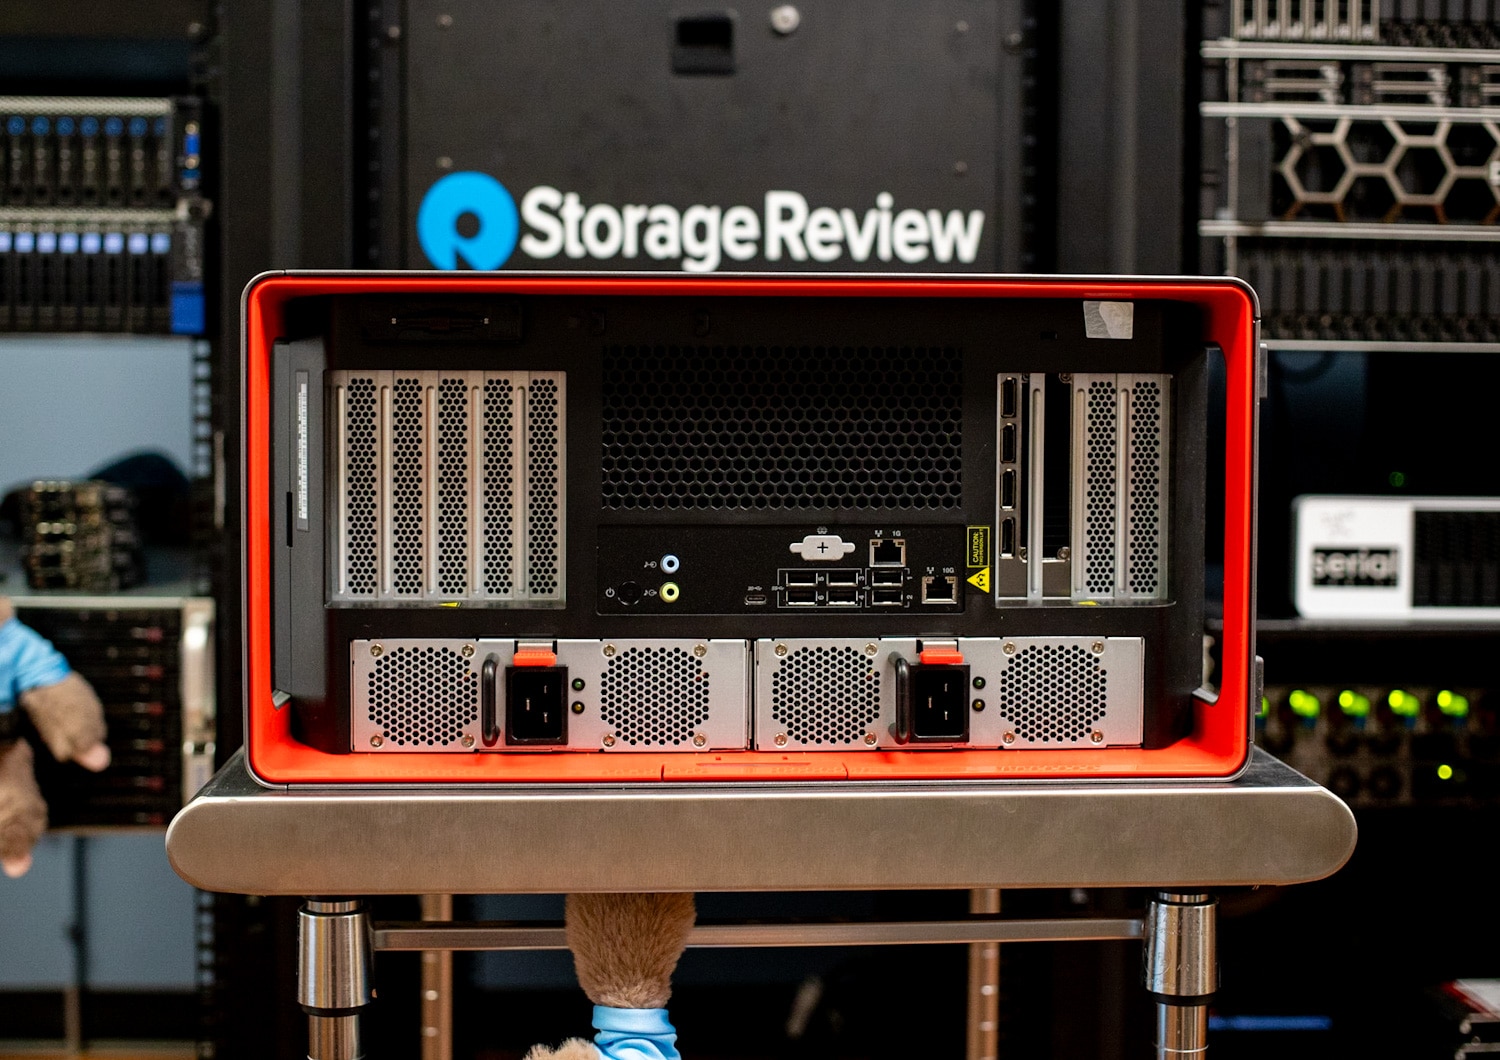
Moving to the back, the ThinkStation PX’s surprisingly concise connectivity includes one 20Gbps USB-C, four 5Gbps USB-A, two USB 2.0, and line-in and line-out jacks. A Serial port is optional. Networking has 1Gbps and 10Gbps Ethernet ports, but Lenovo offers lots of add-in cards to enhance its capabilities.
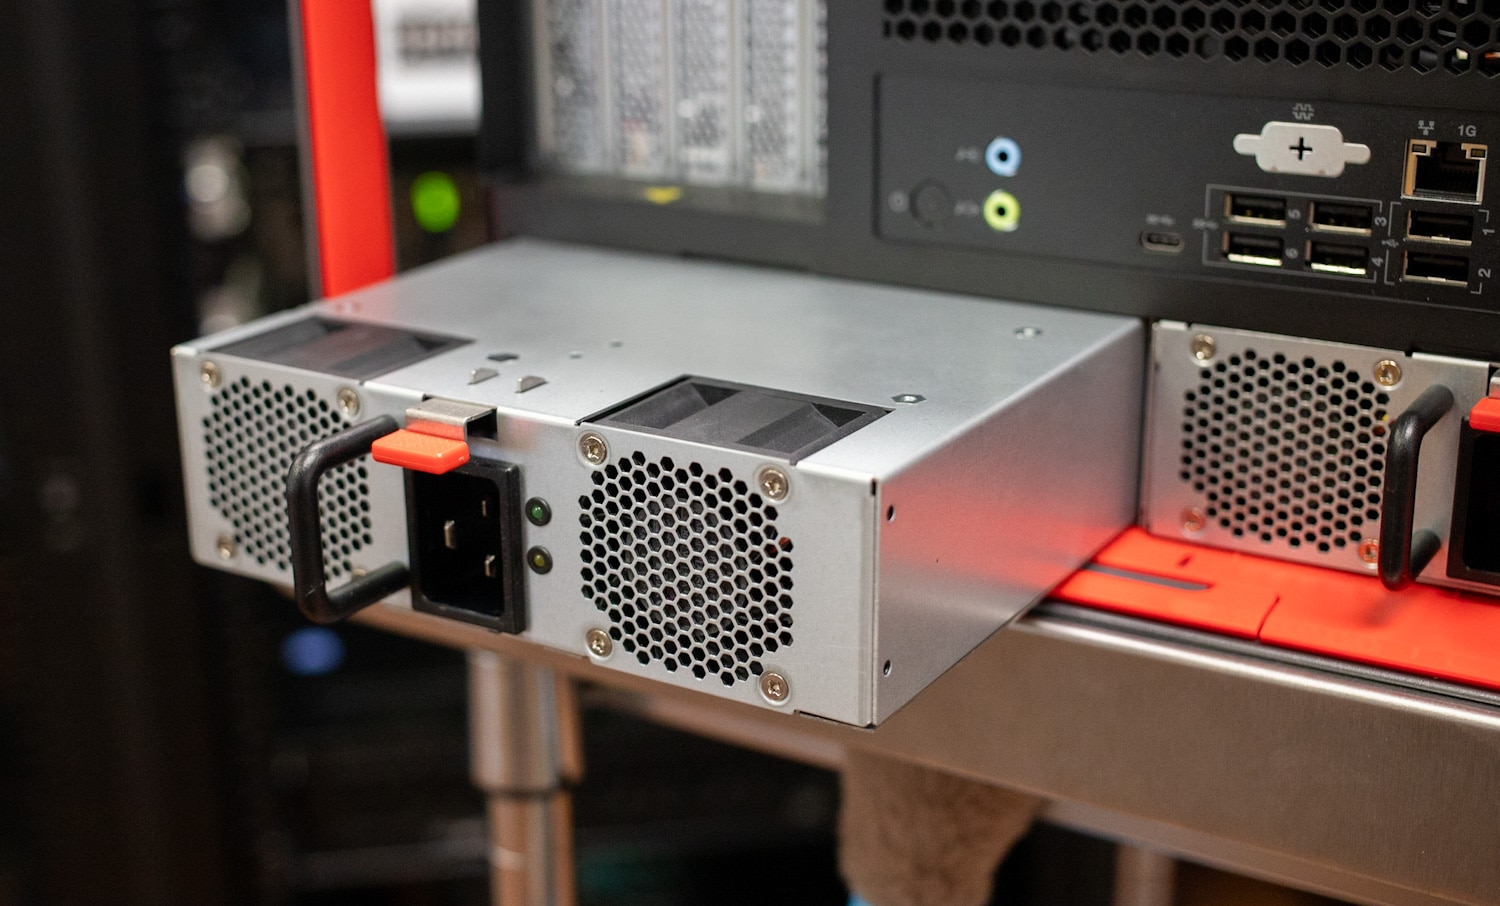
The ThinkStation PX’s hot-swap power supplies go down the left edge; options up to 1,850W are available. Only the highest-end workstations offer power supplies like this.
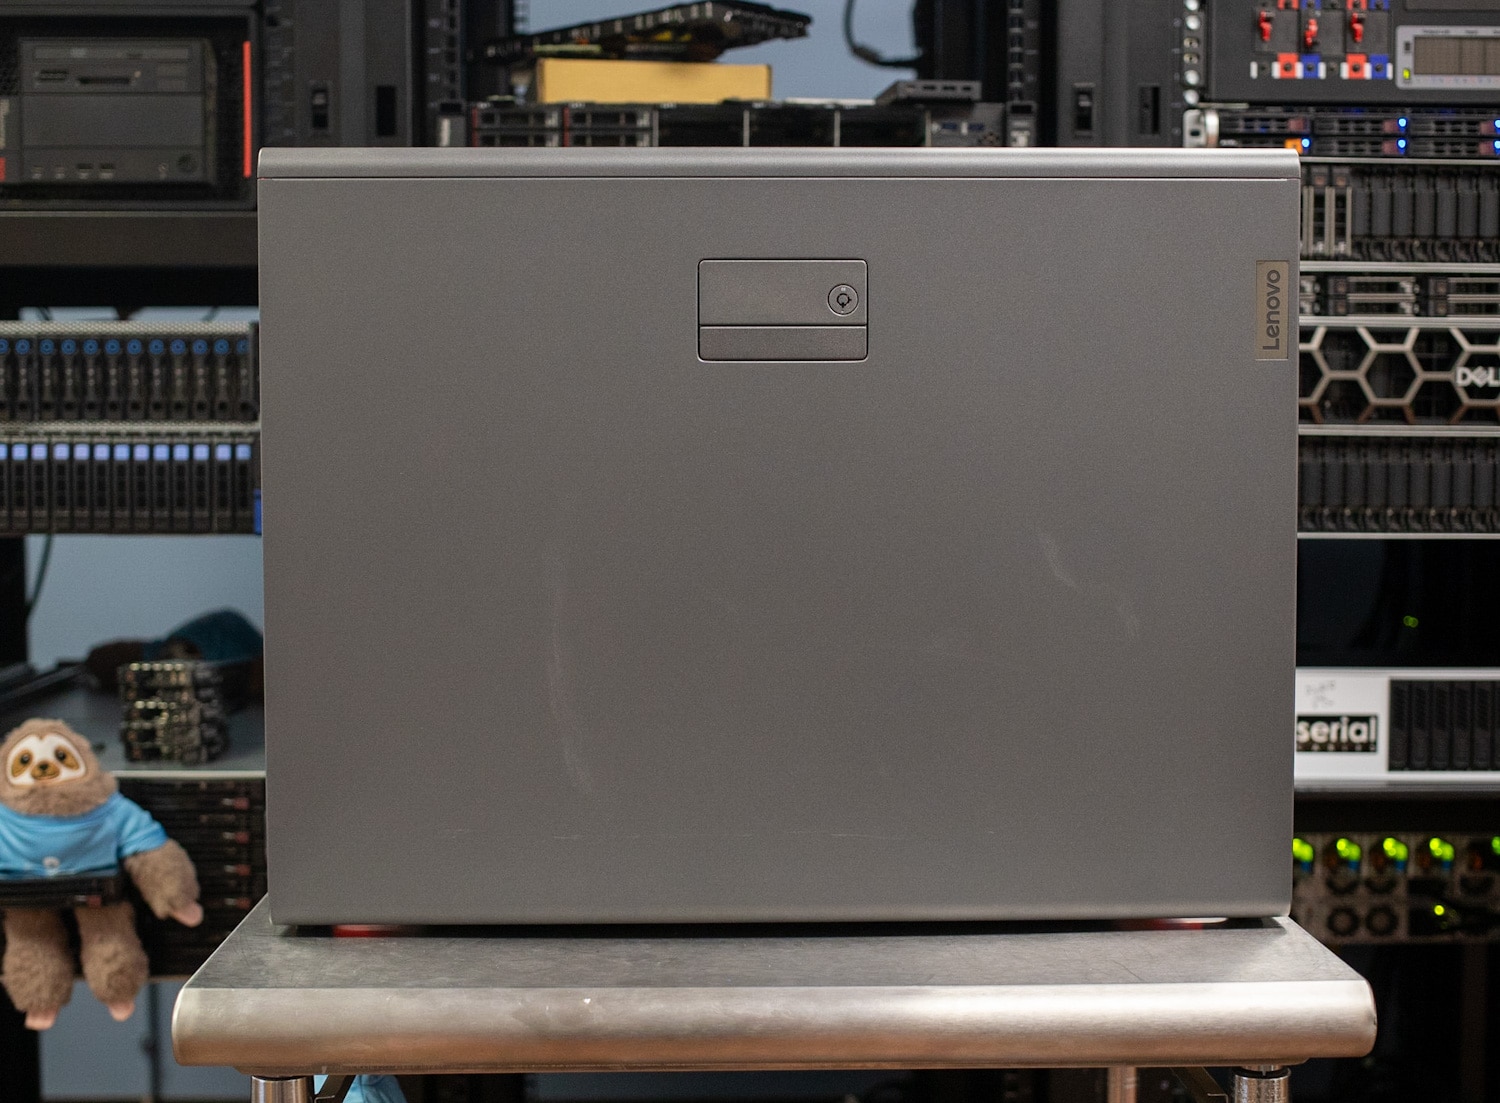
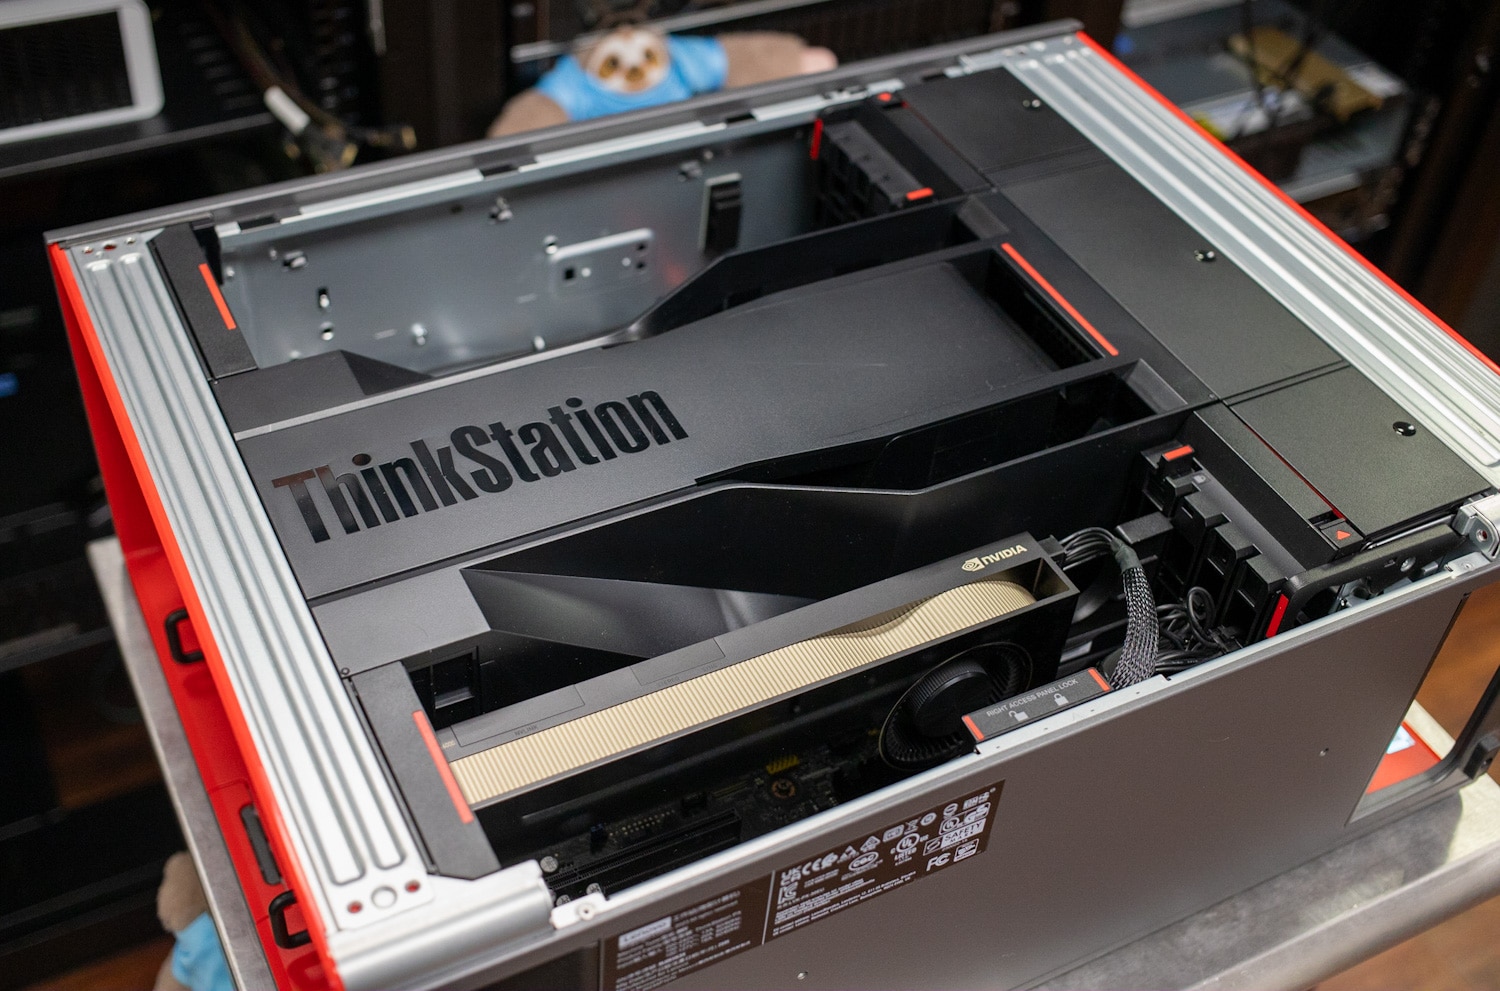
Removing the side door reveals a technological paradise. It has a padlock loop and an optional lock slot, plus intrusion detection.
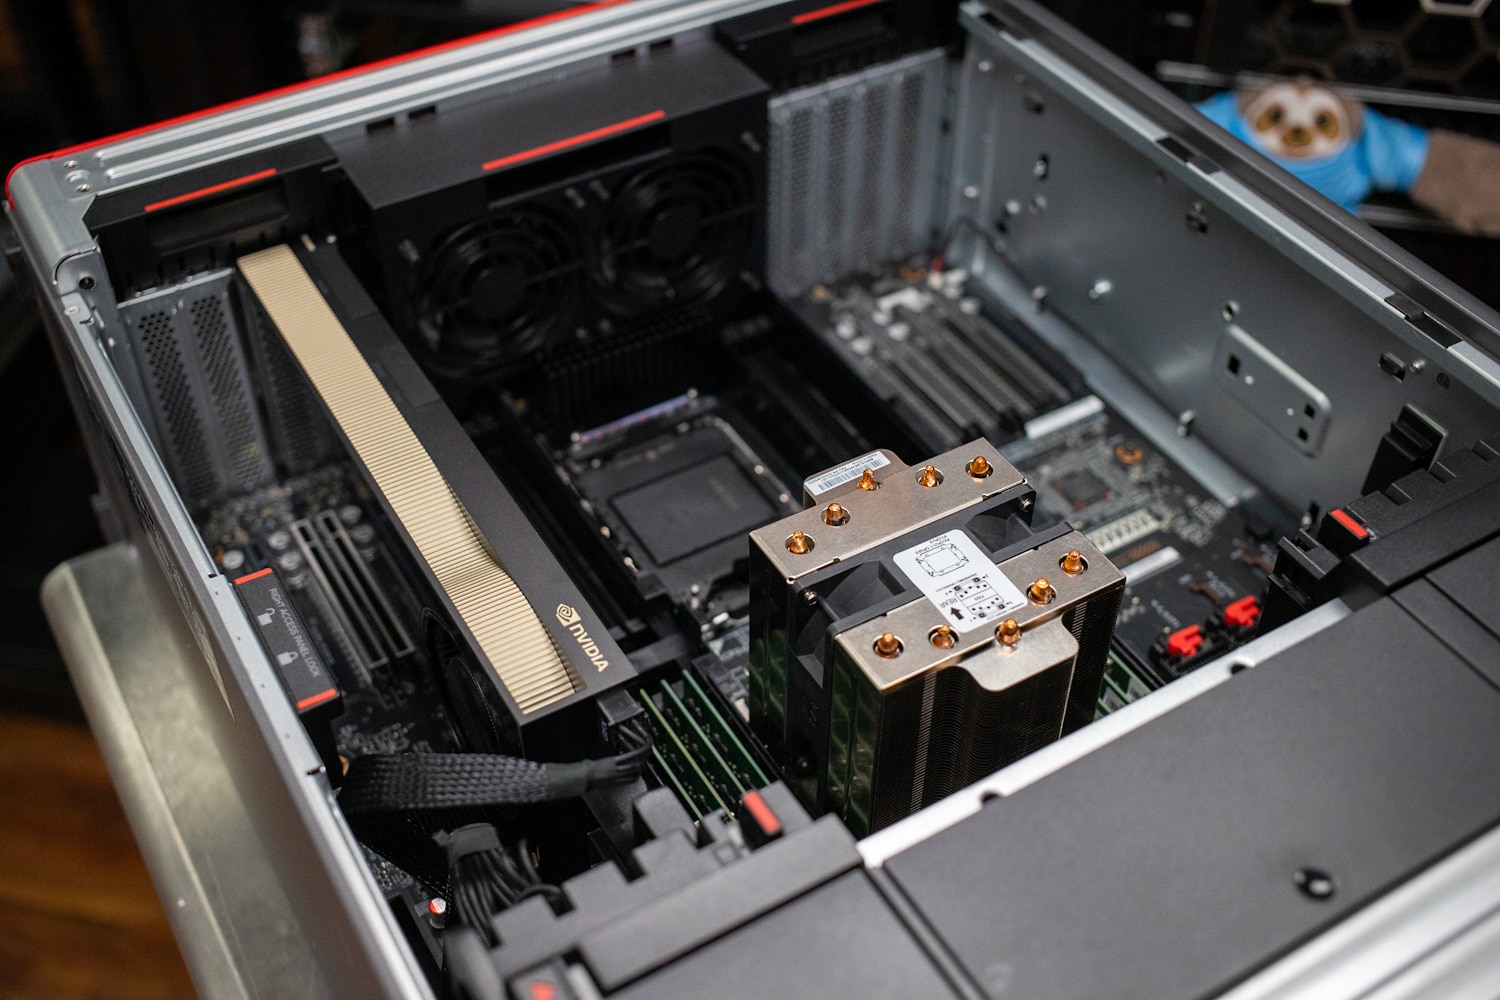
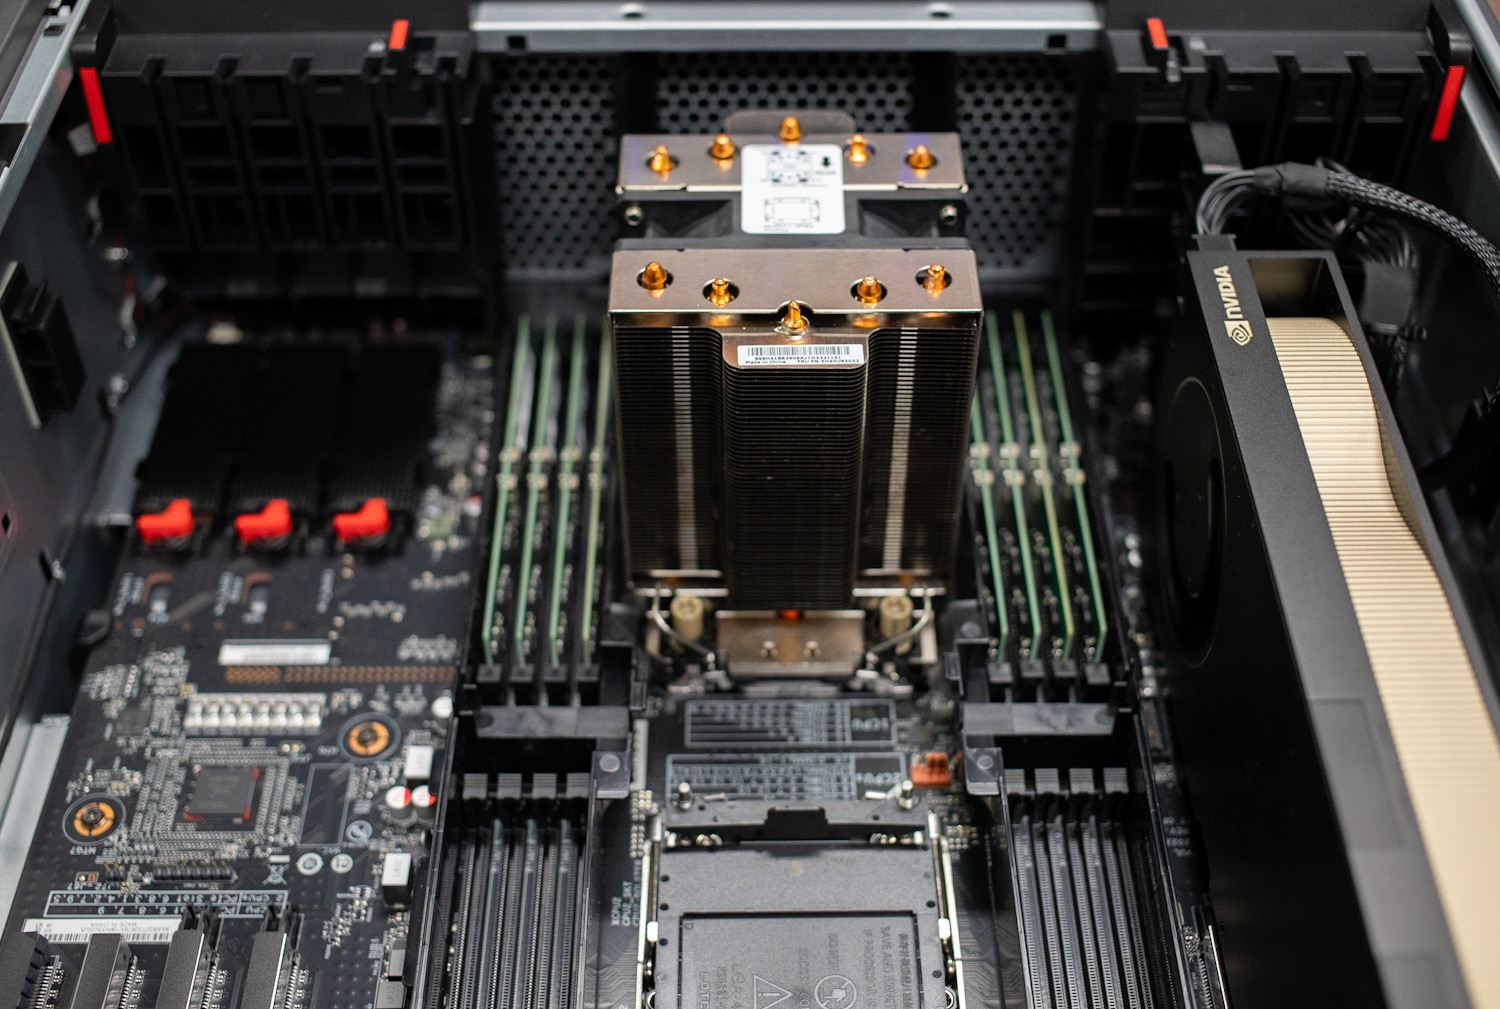
A massive airflow guide covers the dual CPUs and surrounding DIMM slots. The CPUs presumably use air cooling for maximum reliability; we haven’t seen a mainstream workstation offer liquid cooling. Powerful fans behind the front panel send air through the guide, which separates it into channels for the CPUs and memory.
The ThinkStation PX fits up to four double-wide, high-end graphics cards. Fully equipped, two GPUs would go above the DIMM slots (eight per CPU) and two below. Such a GPU-heavy configuration would preclude using the expansion slots. The GPUs are blower-style and have their own airflow channels.
Note our review sample is oddly configured with just one CPU, so there’s no second CPU cooler.
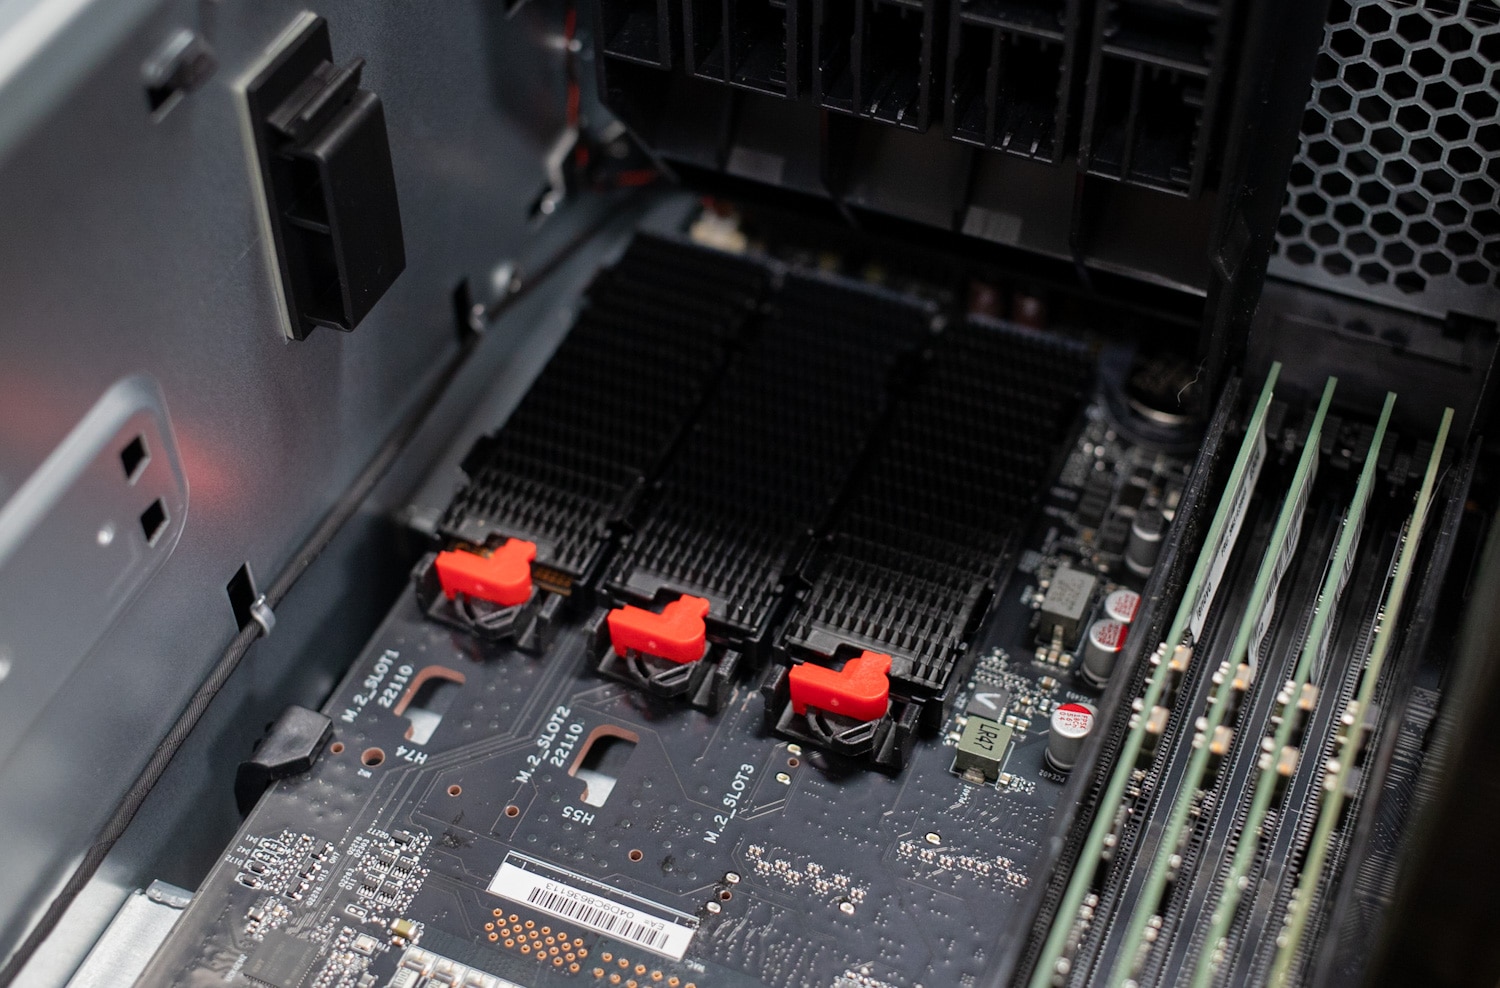
The motherboard’s three M.2 slots are visible lower left.
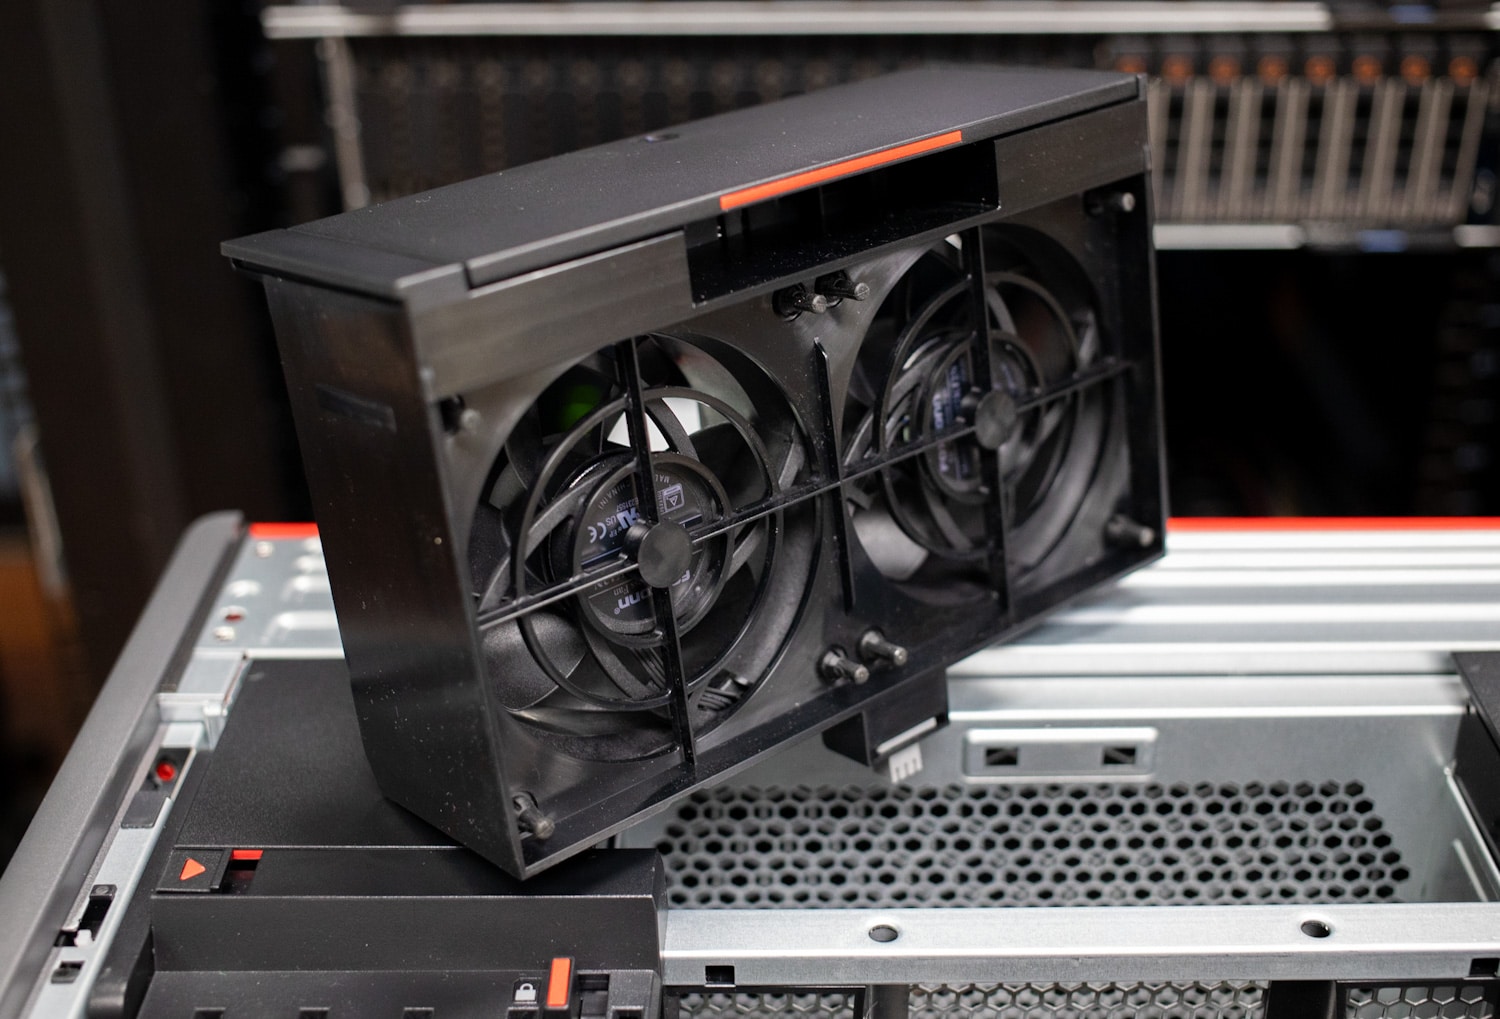
Most of the components inside the ThinkStation PX are serviceable without tools. In Lenovo’s design language, red accents indicate touchable parts of components for easy removal. The front fan module is one easily removable component:
Lenovo ThinkStation PX Performance
We tested a Lenovo ThinkStation PX with the following specifications:
- Intel Xeon Gold 5416S (16 cores, 32 threads)
- Nvidia RTX A6000 48GB
- 128GB DDR5-4800 ECC RAM (8x 16GB)
- 1TB Micron MTFDKBA1T0TFH SSD
- Starting price: $4,917.82
- Price as tested: $8,903.00
This is a basic configuration with just one CPU and graphics card, so it won’t come close to demonstrating what this platform can do. That said, it’s still very capable. Maxed-out configurations with dual CPUs and multiple GPUs can quickly run into high-end luxury car pricing territory. On the pricing, note we published the single-unit price from Lenovo’s site; most times, systems like this are bought by enterprises, which should receive discounts.
As we haven’t recently reviewed another dual-CPU workstation, we will be using the 24-core ThinkStation P5 as a comparison, which has an Nvidia RTX A4500 (20GB) and 32GB of RAM. The results will be apples to oranges, but they’ll show the potency of even the single Xeon in our ThinkStation PX.
SPECviewperf 2020
Our first test is SPECviewperf 2020, the worldwide standard for measuring graphics performance of professional applications under the OpenGL and Direct X application programming interfaces. The viewsets (or benchmarks) represent graphics content and behavior from actual applications without having to install the applications themselves. The newest version of this benchmark went through major updates late last year, including new viewsets taken from traces of the latest versions of 3ds Max, Catia, Maya, and Solidworks applications. In addition, they added support within all viewsets for both 2K and 4K resolution displays.
We only have results for the ThinkStation PX in this test. We ran the test at a 4K resolution.
| SPECviewperf2020 Viewsets (Higher is better) | Lenovo ThinkStation PX (Xeon 5416S, RTX A6000) |
| 3dsmax-07 | 140.54 |
| Catia-06 | 84.45 |
| Energy-03 | 42.04 |
| Maya-06 | 315.07 |
| Medical-03 | 34.88 |
| Sw-05 | 212.74 |
SPECworkstation 3
SPECworkstation3 specializes in benchmarks designed for testing all key aspects of workstation performance; it uses over 30 workloads to test CPU, graphics, I/O, and memory bandwidth. The workloads fall into broader categories such as Media and Entertainment, Financial Services, Product Development, Energy, Life Sciences, and General Operations. We will list the broad-category results for each instead of the individual workloads. The results are an average of all the individual workloads in each category.
This is another test where we only have results for the ThinkStation PX.
| SPECworkstation 3 (Higher is better) | Lenovo ThinkStation PX (Xeon 5416S, RTX A6000) |
| Media and Entertainment | 4.33 |
| Life Sciences | 4.97 |
| Financial Services | 3.75 |
| Energy | 5.41 |
| General Operations | 2.41 |
| GPU Compute | 7.34 |
Blender OptiX
Blender is an open-source 3D modeling application. This benchmark was run using the Blender Benchmark utility. The score is samples per minute, with higher being better.
The ThinkStation PX’s RTX A6000 predictably proved stronger than the ThinkStation P5’s RTX A4500.
| Blender OptiX (Samples per minute, Higher is better) | Lenovo ThinkStation PX (Xeon 5416S, RTX A6000) | Lenovo ThinkStation P5 (Xeon w7-2495X, RTX A4500) |
| Monster | 2,926.25 | 2,236.09 |
| Junkshop | 1,743.92 | 1,374.00 |
| Classroom | 1,498.30 | N/A |
Luxmark
Another 3D benchmark we will look at is LuxMark, an OpenCL GPU benchmarking utility. Here again, the ThinkStation PX’s RTX A6000 showed its strength.
| Luxmark (Higher is better) | Lenovo ThinkStation PX (Xeon 5416S, RTX A6000) | Lenovo ThinkStation P5 (Xeon w7-2495X, RTX A4500) |
| Hallbench | 20,720 | 16,516 |
| food | 7,936 | 5,793 |
ESRI
Next up is the Environmental Systems Research Institute (Esri) benchmark. Esri is a supplier of Geographic Information System (GIS) software. Esri’s Performance Team designed their PerfTool add-in scripts to automatically launch the ArcGIS Pro. This application uses a “ZoomToBookmarks” function to browse various predefined bookmarks and create a log file with all the key data points required to predict the user experience. The script automatically loops the bookmarks three times to account for caching (memory and disk cache). In other words, this benchmark simulates heavy graphical use that one might see through Esri’s ArcGIS Pro software.
The tests consist of three main datasets. Two are 3-D city views of Philadelphia, PA, and Montreal, QC. These city views contain textured 3-D multipatch buildings draped on a terrain model and draped aerial images. The third dataset is a 2-D map view of the Portland OR region. This data contains detailed information for roads, land use parcels, parks and schools, rivers, lakes, and hill shaded terrain.
The Montreal and Philly models are largely GPU-driven and gave the ThinkStation PX’s RTX A6000 a chance to stretch its legs, but the CPU-driven Portland model showed the ThinkStation PX and the P5 are about even.
First up is the Montreal model.
| ESRI ArcGIS Pro 2.3 Montreal | |
| Average FPS | Average |
| Lenovo ThinkStation PX (Xeon 5416S, RTX A6000) | 562.23 |
| Lenovo ThinkStation P5 (Xeon w7-2495X, RTX A4500) | 432.43 |
| Minimum FPS | Average |
| Lenovo ThinkStation PX (Xeon 5416S, RTX A6000) | 249.50 |
| Lenovo ThinkStation P5 (Xeon w7-2495X, RTX A4500) | 227.93 |
Next up is Philly.
| ESRI ArcGIS Pro 2.3 Philly | |
| Average FPS | Average |
| Lenovo ThinkStation PX (Xeon 5416S, RTX A6000) | 601.53 |
| Lenovo ThinkStation P5 (Xeon w7-2495X, RTX A4500) | 328.28 |
| Minimum FPS | Average |
| Lenovo ThinkStation PX (Xeon 5416S, RTX A6000) | 328.35 |
| Lenovo ThinkStation P5 (Xeon w7-2495X, RTX A4500) | 233.12 |
Last is the Portland model.
| ESRI ArcGIS Pro 2.3 Portland | |
| Average FPS | Average |
| Lenovo ThinkStation PX (Xeon 5416S, RTX A6000) | 1,823.00 |
| Lenovo ThinkStation P5 (Xeon w7-2495X, RTX A4500) | 1,849.67 |
| Minimum FPS | Average |
| Lenovo ThinkStation PX (Xeon 5416S, RTX A6000) | 1,146.17 |
| Lenovo ThinkStation P5 (Xeon w7-2495X, RTX A4500) | 1,052.55 |
OctaneBench
Next, we look at OctaneBench, a benchmarking utility for OctaneRender, another 3D renderer with RTX support similar to V-Ray.
| OctaneBench (Score, higher is better) | Kernel | Lenovo ThinkStation PX (Xeon 5416S, RTX A6000) | Lenovo ThinkStation P5 (Xeon w7-2495X, RTX A4500) |
| Interior | Info channels | 18.69 | 16.44 |
| Interior | Direct lighting | 67.43 | 56.47 |
| Interior | Path tracing | 88.09 | 71.63 |
| Idea | Info channels | 11.86 | 10.20 |
| Idea | Direct lighting | 53.45 | 43.92 |
| Idea | Path tracing | 65.69 | 53.89 |
| ATV | Info channels | 29.37 | 25.12 |
| ATV | Direct lighting | 75.07 | 61.42 |
| ATV | Path tracing | 94.51 | 76.97 |
| Box | Info channels | 15.88 | 14.03 |
| Box | Direct lighting | 67.34 | 55.50 |
| Box | Path tracing | 76.03 | 62.48 |
Blackmagic RAW Speed Test
We have also started running Blackmagic’s RAW speed test, which tests video playback.
| Blackmagic RAW Speed Test (Higher is better) | Lenovo ThinkStation PX (Xeon 5416S, RTX A6000) | Lenovo ThinkStation P5 (Xeon w7-2495X, RTX A4500) |
| 8K CPU | 79 fps | 98 fps |
| 8K CUDA | 177 fps | 146 fps |
7-Zip Compression
The built-in memory benchmark in the popular 7-Zip utility demonstrates the ThinkStation PX’s 16-core server-class Xeon chip isn’t quite as fast as the ThinkStation P5’s 24-core workstation Xeon; notice the significant disparity in the decompression subtests. The overall score also shows a marked difference.
| 7-Zip Compression Benchmark (Higher is better) | Lenovo ThinkStation PX (Xeon 5416S, RTX A6000) | Lenovo ThinkStation P5 (Xeon w7-2495X, RTX A4500) |
| Current CPU Usage | 1,741% | 2,585% |
| Current Rating/Usage | 6.910 GIPS | 4.876 GIPS |
| Current Rating | 120.316 GIPS | 126.043 GIPS |
| Resulting CPU Usage | 1,742% | 2,572% |
| Resulting Rating/Usage | 6.896 GIPS | 4.761 GIPS |
| Resulting Rating | 120.141 GIPS | 122.489 GIPS |
| Decompressing | ||
| Current CPU Usage | 3,158% | 4,745% |
| Current Rating/Usage | 3.429 GIPS | 3.819 GIPS |
| Current Rating | 108.308 GIPS | 181.107 GIPS |
| Resulting CPU Usage | 3,151% | 4,718% |
| Resulting Rating/Usage | 3.451 GIPS | 3,836 GIPS |
| Resulting Rating | 108.752 GIPS | 180.965 GIPS |
| Total Rating | ||
| Total CPU Usage | 2,447% | 3,645% |
| Total Rating/Usage | 5.174 GIPS | 4.298 GIPS |
| Total Rating | 114.446 GIPS | 151.727 GIPS |
Blackmagic Disk Speed Test
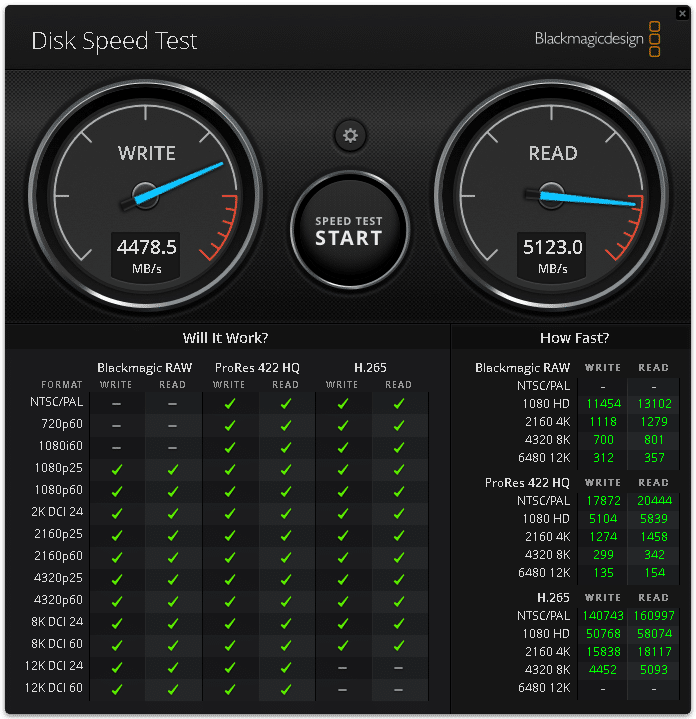
We run the popular Blackmagic Disk Speed Test against the system’s primary storage drive. The Gen 4 drive inside the ThinkStation PX produced capable numbers.
UL Procyon AI Inference
UL’s Procyon estimates a workstation’s performance for professional apps. The ThinkStation PX, of course, proved faster than the ThinkStation P5 in the GPU testing, and there was a fair amount of back and forth in the CPU testing.
| UL Procyon Average Inference Times (Lower is better) | Lenovo ThinkStation PX (RTX A6000) | Lenovo ThinkStation PX (Xeon 5416S) | Lenovo ThinkStation P5 (RTX A4500) | Lenovo ThinkStation P5 (Xeon w7-2495X) |
| MobileNet V3 | 0.60 ms | 1.66 ms | 0.60 ms | 1.81 ms |
| ResNet 50 | 1.50 ms | 7.81 ms | 1.67 ms | 6.70 ms |
| Inception V4 | 4.59 ms | 23.65 ms | 5.07 ms | 18.41 ms |
| DeepLab V3 | 4.01 ms | 30.91 ms | 4.54 ms | 24.67 ms |
| YOLO V3 | 4.53 ms | 44.74 ms | 5.32 ms | 30.00 ms |
| Real-ESRGAN | 130.18 ms | 1,923.78 ms | 184.73 ms | 2,014.35 ms |
y-cruncher
y-cruncher is a multi-threaded and scalable program that can compute Pi and other mathematical constants to trillions of digits. Since its launch in 2009, it has become a popular benchmarking and stress-testing application for overclockers and hardware enthusiasts.
The ThinkStation PX’s Xeon chip proved far more potent here than the ThinkStation P5’s. The eight-channel memory in the ThinkStation PX may have also played a role.
| y-cruncher (Total Computation time) | Lenovo ThinkStation PX (Xeon 5416S, RTX A6000) | Lenovo ThinkStation P5 (Xeon w7-2495X, RTX A4500) |
| 1 billion digits | 18.989 seconds | 27.816 seconds |
Geekbench 6
We also started running the cross-platform Geekbench. We only have results for the ThinkStation PX.
| Geekbench 6 (Higher is better) | Lenovo ThinkStation PX (Xeon 5416S, RTX A6000) |
| CPU Multi-Core | 14,453 |
| CPU Single-Core | 2,087 |
| GPU | 194,000 |
Cinebench R23
This benchmark uses all CPU cores and threads to generate an overall score. We also only have numbers here for the ThinkStation PX.
| Cinebench R23 (Higher is better) | Lenovo ThinkStation PX (Xeon 5416S, RTX A6000) |
| Multi-Core | 22,447 |
| Single-Core | 1,392 |
Conclusion
Lenovo’s ThinkStation PX is one of the last great multi-CPU workstations, supporting two of Intel’s “Sapphire Rapids” Xeon server CPUs, 16 DIMM slots (eight per CPU), and a fantastic total of four double-wide high-end graphics cards. We tested it in a lightweight but still very capable configuration, and it didn’t flinch running our benchmark suite.
We’re fans of the Lenovo ThinkStation PX for its stylish (yet fully functional, of course) Aston Martin-inspired design, effective airflow, and almost unlimited expansion. We especially like the front 3.5-inch and NVMe bay options and hot-swappable power supplies.
The ThinkStation PX earns our top recommendation for a dual-CPU workstation while also making us a little sad that it may be the last of its kind.
Engage with StorageReview
Newsletter | YouTube | Podcast iTunes/Spotify | Instagram | Twitter | TikTok | RSS Feed

