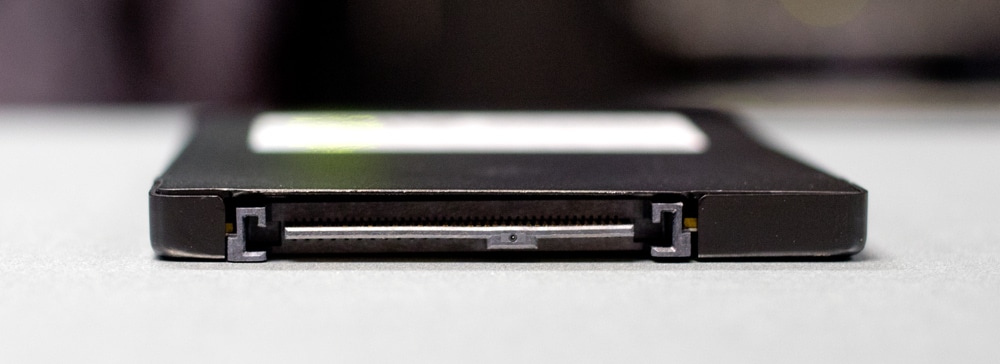
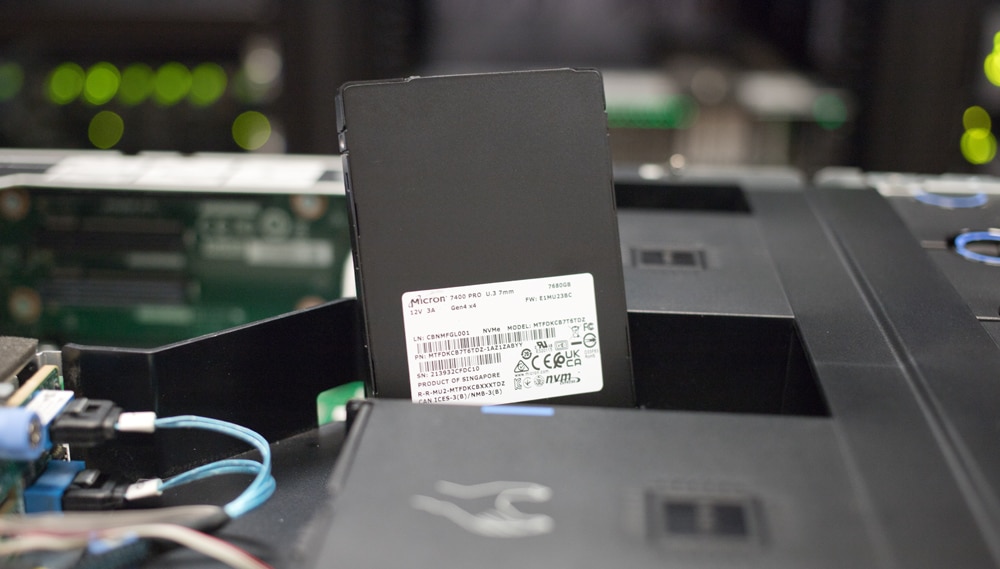
The Micron 7400 Pro NVMe SSD is the company’s most recently shipping enterprise PCIe Gen4 SSD, highlighted by new comprehensive security features and a range of form factors and capacities. Micron indicates their drive is ideal for demanding data center workloads and for those looking to transition to next-generation server architecture. The 7400 Pro also features a mixed-use “MAX” model, which is more suitable for use cases that require higher endurance.
The Micron 7400 Pro NVMe SSD is the company’s most recently shipping enterprise PCIe Gen4 SSD, highlighted by new comprehensive security features and a range of form factors and capacities. Micron indicates their drive is ideal for demanding data center workloads and for those looking to transition to next-generation server architecture. The 7400 Pro also features a mixed-use “MAX” model, which is more suitable for use cases that require higher endurance.
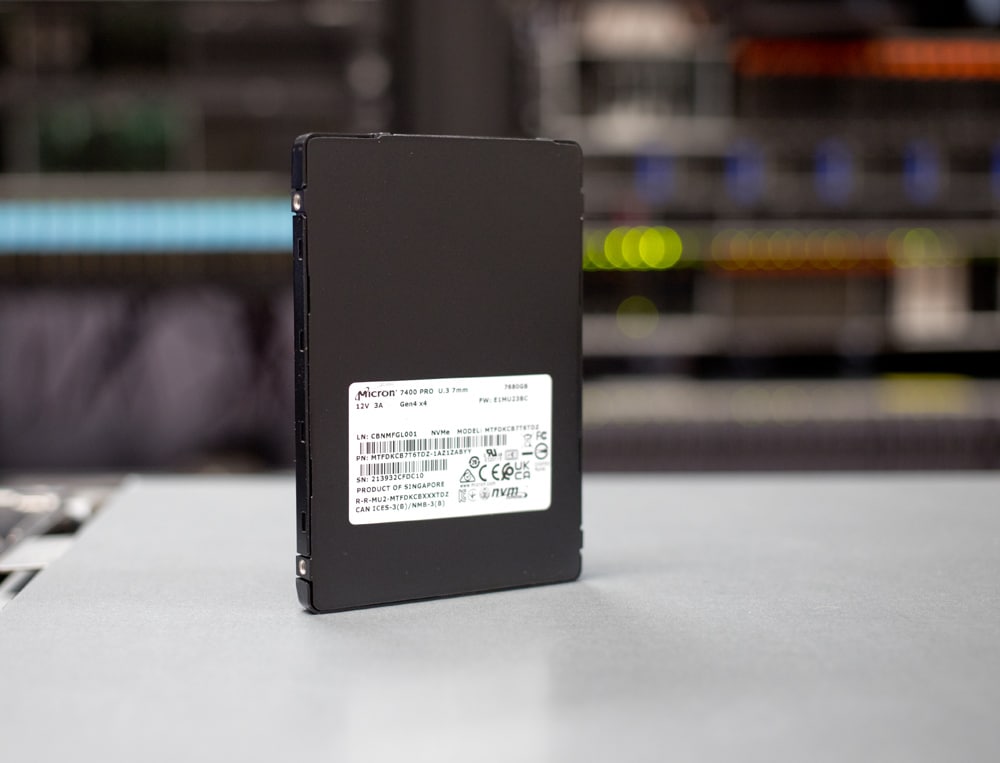
Micron 7400 Pro
Prior to the 7400 Pro, Micron’s recent enterprise drives have been Memblaze SSDs branded under the Micron logo. As such, we are happy to get our hands on this new non-Memblaze drive to see what it is capable of.
Micron’s 7400 Pro is available in three drive types, each of which is comprised of different form-factor sizes and capacity models. This is certainly ideal for the ever-evolving data centers, an area that always has to cope with the exponential growth of data.
The U.3 models come in both 7mm and 15mm sizes (a market first for the PCIe Gen4 U.3 form factor) and are available in capacities from 800GB all the way up to 7.68TB. Because U.3 supports NVMe, SAS, and SAS host controllers, field support will be much more seamless. For performance, sequential reads and writes are quoted to deliver up to 6.6GB/s and 5.4GB/s for the highest capacities models, respectively, while random 4k performance is expected to hit upwards of 1 million IOPS read and 190K IOPS write.
The M.2 models are available in 22 x 80mm and 22 x 110mm sizes with capacities ranging from 400GB to 3.84TB. The PCIe Gen4 M.2 22 x 80mm form factor is designed for server boot use, and is currently the only of its kind to feature power loss protection. The benefits of the 7400 Pro M.2 version are its easy integration into existing architectures and low power draws. For performance, it is expected to reach up to 4.4GB/s and 2GB/s in sequential reads and writes, while random performance is quoted at 650K IOPS read and 105K IOPS write.
The E1.S models are available in 5.9mm, 15mm, and 25mm sizes in capacities ranging from 800GB to 3.84TB. This is the most interesting form factor of the bunch. As we indicated in our article on how the E1.S ruler is going mainstream, the E1.S form factor (i.e., 15mm variant) will bring bar-setting performance with 25W+ support of the PCIe Gen5 SSDs that are right around the corner. Looking at the present, it offers greater density, flash-optimized performance, and improved power and integrated cooling options. As for performance, Micron quotes their shorruler to reach up to 6.6GB/s read and 3.5GB/s write, while random performance is expected to hit the 800K IOPS read and 150K IOPS write mark.
As you can see, Micron’s comprehensive 7400 Pro line will be able to satisfy a range of data center use cases, no matter the power, capacity, footprint constraint, and thermal requirements a server environment might have.
Micron 7400 Pro Security Features
Security seems like a big focus for Micron with their new release, offering seven new security features focused on protecting data being virtualized, moved to the cloud, or containerized. This includes a secure execution environment, which features dedicated security processing hardware with physical isolation; and asymmetric roots of trust, which grants authenticated revocation of root keys.
Here’s a quick rundown of the other new security features of the Micron 7400 Pro:
- Strong asymmetric key support: uses standard, National Institute of Standards and technology (NIST)-approved algorithms with 208-bit/3072-bit RSA keys
- RSA Delegation Key Support: Enables customers to maintain ownership of RSA keys
- Secure boot: Helps ensure firmware integrity on running platform
- Key-Based Firmware: Update Validates firmware using public key-based authentication prior to firmware update
- Key-Based Privileged Access: Protects against unauthorized privileged SSD function execution with public key-based authorization
We will be looking at the Micron 7400 Pro 7.68TB U.3 model for this review.
Micron 7400 Pro NVMe SSD Specifications
| 7400 PRO: U.3
Read-Intensive, 1 Drive Write per Day |
|||||
| Capacity | 960GB | 1.92TB | 3.84TB | 7.68TB | |
|
Performance8,9 |
Seq. Read (MB/s) | 6,500 | 6,500 | 6,600 | 6,600 |
| Seq. Write (MB/s) | 1,000 | 2,200 | 3,500 | 5,40010 | |
| Rand. Read (IOPS) | 240,000 | 430,000 | 800,000 | 1,000,000 | |
| Rand. Write (IOPS) | 60,000 | 95,000 | 150,000 | 190,000 | |
| 70/30 Rand. Read/Write (IOPS) | 105,000 | 174,000 | 275,000 | 400,000 | |
| Latency (TYP, µs) | 75 (read)
15 (write) |
75 (read)
15 (write) |
75 (read)
15 (write) |
75 (read)
15 (write) |
|
| Endurance (Total bytes written in PB)11 | 1,700
6,700 |
3,500
14,400 |
7,000
25,700 |
14,000
48,900 |
|
| 7400 PRO: E1.S
Read-Intensive, 1 Drive Write per Day |
|||||
| Capacity | 960GB | 1.92TB | 3.84TB | ||
|
Performance |
Seq. Read (MB/s) | 6,500 | 6,500 | 6,600 | |
| Seq. Write (MB/s) | 1,000 | 2,200 | 3,500 | ||
| Rand. Read (IOPS) | 240,000 | 430,000 | 800,000 | ||
| Rand. Write (IOPS) | 60,000 | 95,000 | 150,000 | ||
| 70/30 Rand. Read/Write (IOPS) | 105,000 | 174,000 | 275,000 | ||
| Latency (TYP, µs) | 75 (read)
15 (write) |
75 (read)
15 (write) |
75 (read)
15 (write) |
||
| Endurance (Total bytes written in PB)11 | 1,700
6,700 |
3,500
14,400 |
7,000
25,700 |
||
| 7400 PRO: M.2
Read-Intensive, 1 Drive Write per Day |
|||||
| Capacity | 480GB12 | 960GB12 | 1.92TB | 3.84TB | |
|
Performance |
Seq. Read (MB/s) | 4,400 | 4,400 | 4,400 | 4,400 |
| Seq. Write (MB/s) | 530 | 1,000 | 2,000 | 2,200 | |
| Rand. Read (IOPS) | 120,000 | 230,000 | 420,000 | 650,000 | |
| Rand. Write (IOPS) | 25,000 | 60,000 | 85,000 | 105,000 | |
| 70/30 Rand. Read/Write (IOPS) | 45,000 | 105,000 | 160,000 | 240,000 | |
| Latency (TYP, µs) | 85 (read)
40 (write) |
85 (read)
15 (write) |
85 (read)
15 (write) |
85 (read)
15 (write) |
|
| Endurance (Total bytes written in PB)11 | 800
3,800 |
1,700
6,700 |
3,500
14,400 |
7,000
25,700 |
|
| Micron 7400 SSD: Common Features | |
| Interface | PCIe Gen4 1×4 NVMe (v1.4) |
| Form Factors | U.3 (7mm, 15mm), E1.S (5.9mm, 15mm, 25mm), M.2 (22 x 80mm, 22 x 110mm) |
| NAND | Micron 96-layer 3D TLC NAND |
| Typ. Latency | Read: M.2: 85µs, U.3, E1.S: 75µs; Write: 25µs |
| MTTF | 2 million device hours |
| UBER | <1 sector per 1017 bits read |
| Warranty | 5 years |
| Power | Sequential read (maximum of all capacities by form factor): U.3: 13.6W / E1.S: 11.5W / M.2: 8.25W Sequential write (maximum of all capacities by form factor): U.3: 22W / E1.S: 12W / M.2: 8.25W |
| Operating Temp. | 0-70°C |
Micron 7400 Pro NVMe SSD Performance
Testing Background and Comparables
The StorageReview Enterprise Test Lab provides a flexible architecture for conducting benchmarks of enterprise storage devices in an environment comparable to what administrators encounter in real deployments. The Enterprise Test Lab incorporates a variety of servers, networking, power conditioning, and other network infrastructure that allows our staff to establish real-world conditions to accurately gauge performance during our reviews.
We incorporate these details about the lab environment and protocols into reviews so that IT professionals and those responsible for storage acquisition can understand the conditions under which we have achieved the following results. None of our reviews are paid for or overseen by the manufacturer of equipment we are testing. Additional details about the StorageReview Enterprise Test Lab and an overview of its networking capabilities are available on those respective pages.
Comparables:
Testbed
Our PCIe Gen4 Enterprise SSD reviews leverage a Lenovo ThinkSystem SR635 for application tests and synthetic benchmarks. The ThinkSystem SR635 is a well-equipped single-CPU AMD platform, offering CPU power well in excess of what’s needed to stress high-performance local storage. It is also the only platform in our lab (and one of the few on the market currently) with PCIe Gen4 U.2 bays. Synthetic tests don’t require a lot of CPU resources but still leverage the same Lenovo platform. In both cases, the intent is to showcase local storage in the best light possible that aligns with storage vendor maximum drive specs.
PCIe Gen4 Synthetic and Application Platform (Lenovo ThinkSystem SR635)
- 1 x AMD 7742 (2.25GHz x 64 Cores)
- 8 x 64GB DDR4-3200MHz ECC DRAM
- CentOS 7.7 1908
- ESXi 6.7u3
SQL Server Performance
Each SQL Server VM is configured with two vDisks: 100GB volume for boot and a 500GB volume for the database and log files. From a system resource perspective, we configured each VM with 8 vCPUs, 64GB of DRAM and leveraged the LSI Logic SAS SCSI controller. While our Sysbench workloads tested previously saturated the platform in both storage I/O and capacity, the SQL test is looking for latency performance.
This test uses SQL Server 2014 running on Windows Server 2012 R2 guest VMs and is stressed by Quest’s Benchmark Factory for Databases. StorageReview’s Microsoft SQL Server OLTP testing protocol employs the current draft of the Transaction Processing Performance Council’s Benchmark C (TPC-C), an online transaction-processing benchmark that simulates the activities found in complex application environments. The TPC-C benchmark comes closer than synthetic performance benchmarks to gauging the performance strengths and bottlenecks of storage infrastructure in database environments. Each instance of our SQL Server VM for this review uses a 333GB (1,500 scale) SQL Server database and measures the transactional performance and latency under a load of 15,000 virtual users.
SQL Server Testing Configuration (per VM)
- Windows Server 2012 R2
- Storage Footprint: 600GB allocated, 500GB used
- SQL Server 2014
-
- Database Size: 1,500 scale
- Virtual Client Load: 15,000
- RAM Buffer: 48GB
- Test Length: 3 hours
-
- 2.5 hours preconditioning
- 30 minutes sample period
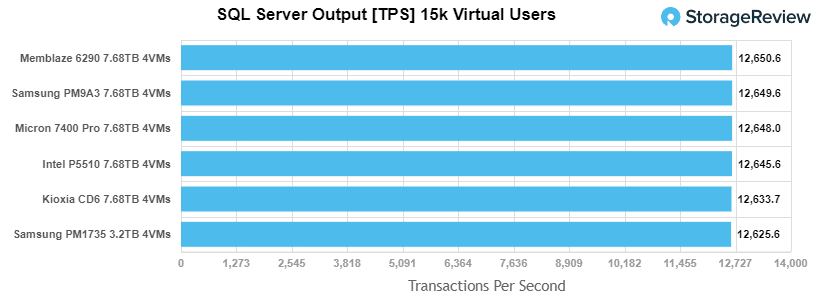
For our SQL Server transactional benchmark, the Micron 7400 Pro was placed in the middle part of the leaderboard with 12,648 TPS.
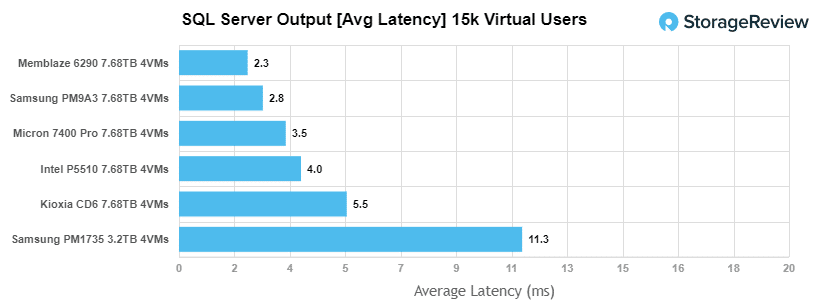
With SQL Server average latency, the Micron 7400 Pro posted solid results with an average latency of 3.5ms.
Sysbench Performance
The next application benchmark consists of a Percona MySQL OLTP database measured via SysBench. This test measures average TPS (Transactions Per Second), average latency, and average 99th percentile latency as well.
Each Sysbench VM is configured with three vDisks: one for boot (~92GB), one with the pre-built database (~447GB), and the third for the database under test (270GB). From a system resource perspective, we configured each VM with 8 vCPUs, 60GB of DRAM and leveraged the LSI Logic SAS SCSI controller.
Sysbench Testing Configuration (per VM)
- CentOS 6.3 64-bit
- Percona XtraDB 5.5.30-rel30.1
-
- Database Tables: 100
- Database Size: 10,000,000
- Database Threads: 32
- RAM Buffer: 24GB
- Test Length: 3 hours
-
- 2 hours preconditioning 32 threads
- 1 hour 32 threads
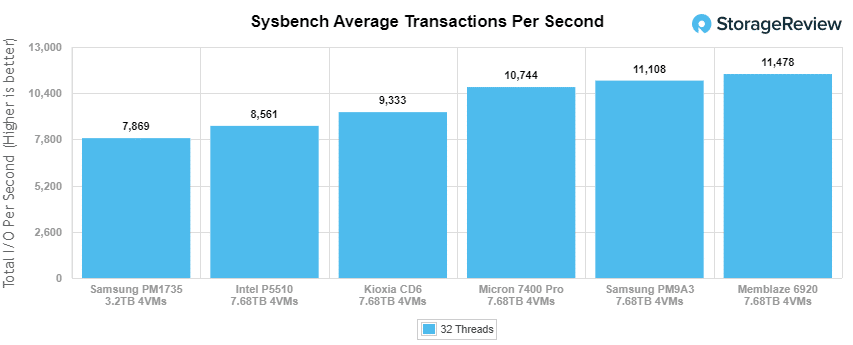
Looking at our Sysbench transactional benchmark, the Micron 7400 Pro had upper mid-range results (3rd) again with 10,744 TPS.
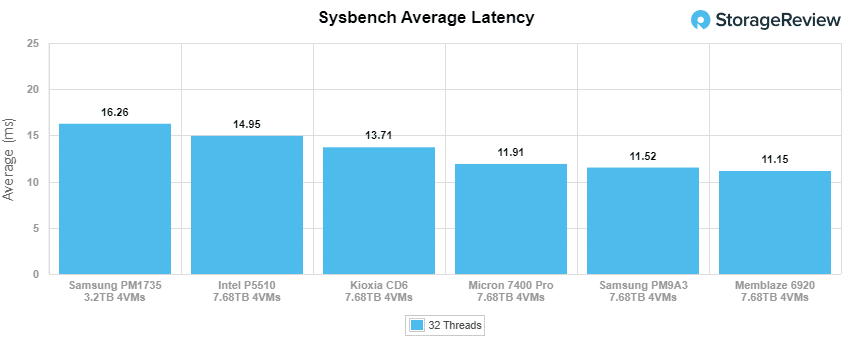
With Sysbench average latency, the Micron 7400 Pro posted 11. 19ms, which was good enough for 3rd and slightly behind the Samsung PM9A3 and Memblaze drives.
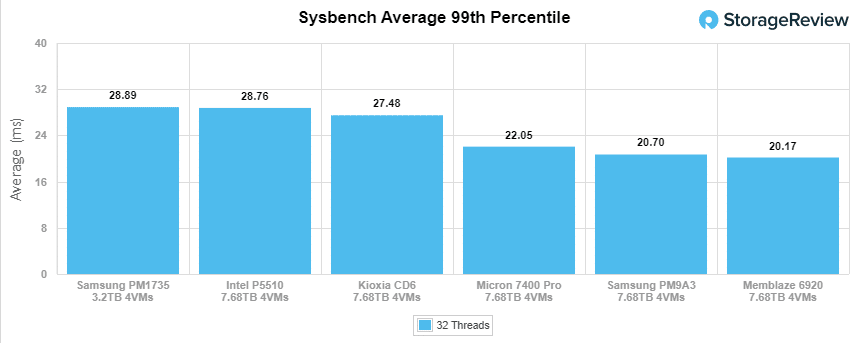
For our worst-case scenario latency (99th percentile) the Micron 7400 Pro placed third again with 22.05ms.
VDBench Workload Analysis
When it comes to benchmarking storage devices, application testing is best, and synthetic testing comes in second place. While not a perfect representation of actual workloads, synthetic tests do help to baseline storage devices with a repeatability factor that makes it easy to do apples-to-apples comparisons between competing solutions. These workloads offer a range of different testing profiles ranging from “four corners” tests, common database transfer size tests, to trace captures from different VDI environments.
All of these tests leverage the common vdBench workload generator, with a scripting engine to automate and capture results over a large compute testing cluster. This allows us to repeat the same workloads across a wide range of storage devices, including flash arrays and individual storage devices. Our testing process for these benchmarks fills the entire drive surface with data, then partitions a drive section equal to 25% of the drive capacity to simulate how the drive might respond to application workloads. This is different than full entropy tests which use 100% of the drive and takes them into a steady state. As a result, these figures will reflect higher-sustained write speeds.
Profiles:
- 4K Random Read: 100% Read, 128 threads, 0-120% iorate
- 4K Random Write: 100% Write, 128 threads, 0-120% iorate
- 16K Sequential Read: 100% Read, 32 threads, 0-120% iorate
- 16K Sequential Write: 100% Write, 16 threads, 0-120% iorate
- 64K Sequential Read: 100% Read, 32 threads, 0-120% iorate
- 64K Sequential Write: 100% Write, 16 threads, 0-120% iorate
- 4K, 8K, and 16K 70R/30W Random Mix, 64 threads, 0-120% iorate
- Synthetic Database: SQL and Oracle
- VDI Full Clone and Linked Clone Traces
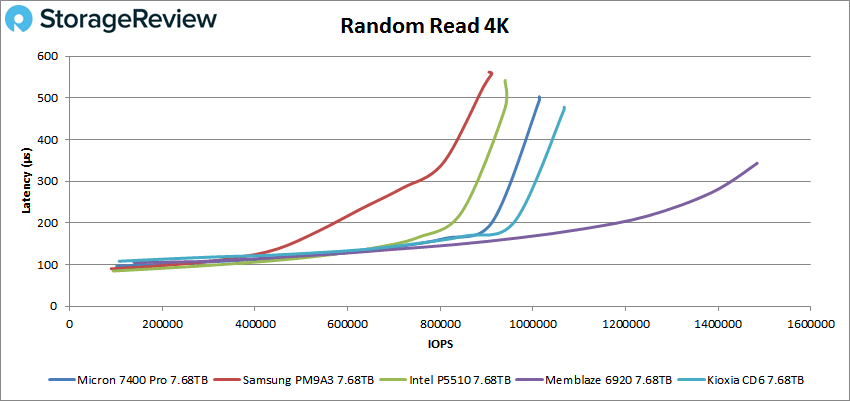
In our first VDBench Workload Analysis, Random 4K Read, the Micron 7400 Pro had a peak performance of 1.01 million IOPS at a latency of 502.9µs, placing 3rd among the tested drives.
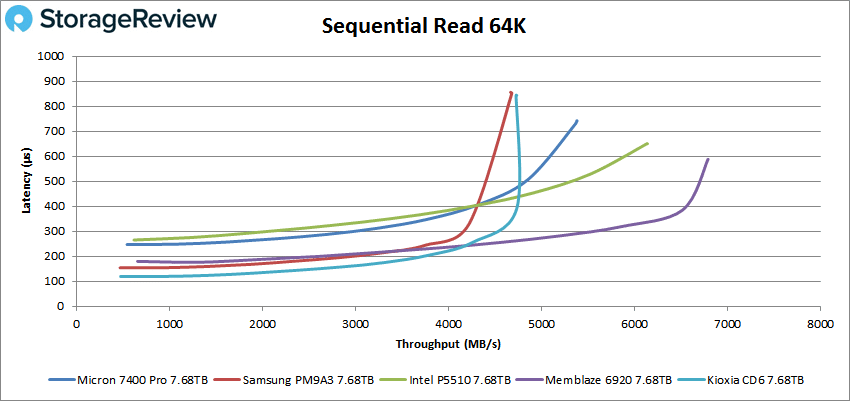
Switching over to 64k sequential workloads, the Micron 7400 Pro took third spot again, posting 5.37GB/s read (85,842 IOPS) at 730.8µs in latency.
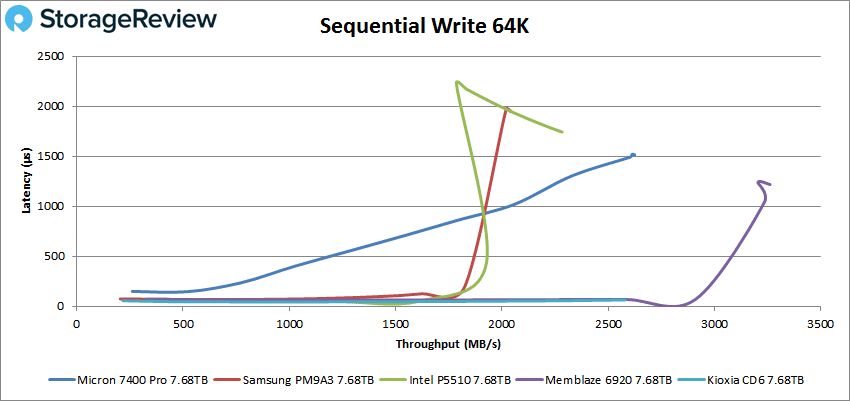
In 64K write, the Micron 7400 Pro performed much better (with stable performance), peaking at 2.61GB/s (41,801 IOPS) with a latency of 1,521.2µs.
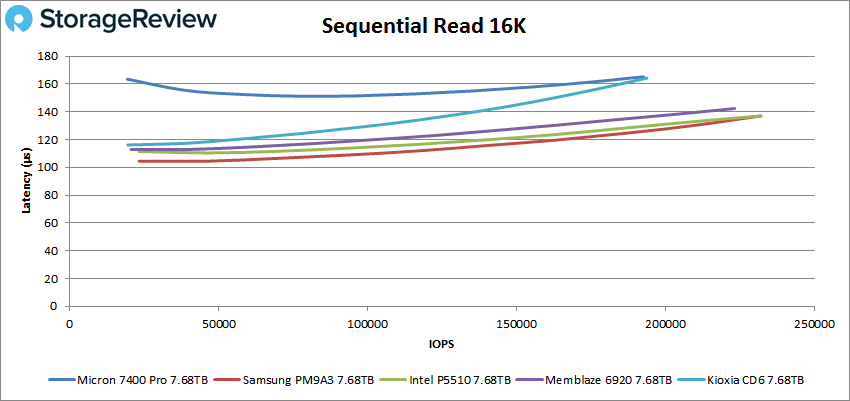
Next up is our 16K sequential performance. In reads, Micron 7400 Pro posted a peak of 3.0GB/s (192,509 IOPS) 165.2µs in latency, which was very similar to the Kioxia drive.
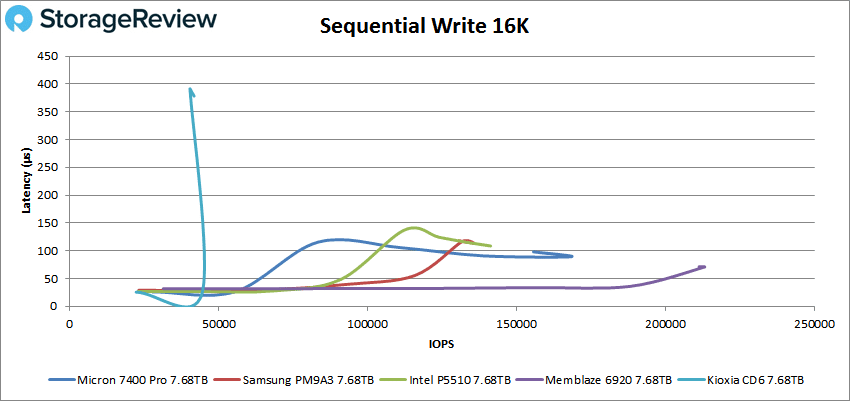
For 16K sequential writes, the Micron 7400 Pro had higher initial latency, although peaked in second place with 168,371 IOPS (2,630MB/s) with a latency of 89.3µs.
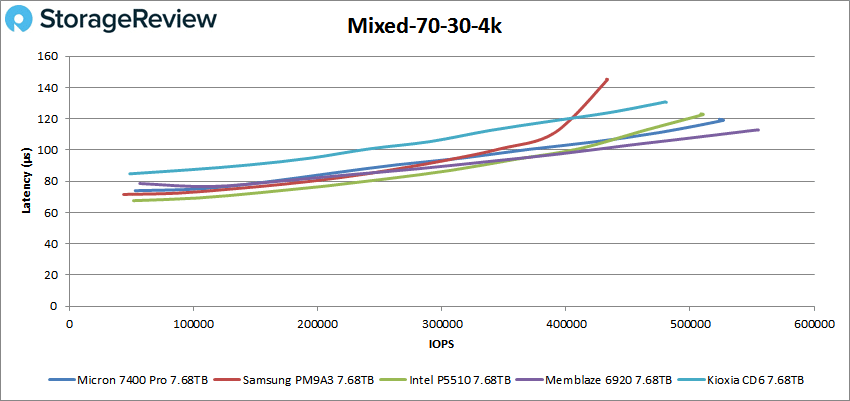
In our mixed 70/30 4k profile (70% read, 30% write), the 7400 Pro placed second with a peak of 526,707 IOPS at 119µs in latency.
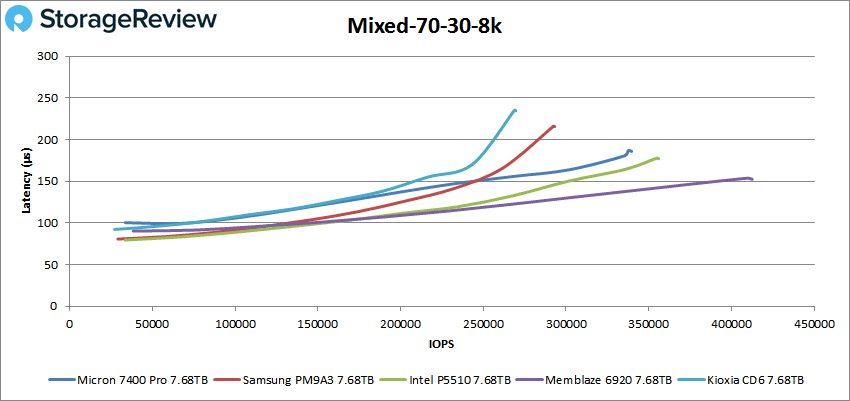
In our last mixed profile (70/30 8k), the Micron 7400 Pro peaked at 337,687 IOPS with a latency of 186.9µs.
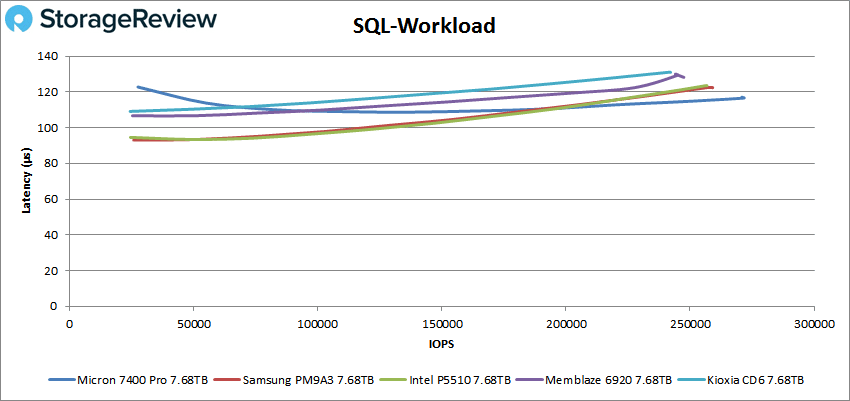
Our next set of tests is our SQL workloads: SQL, SQL 90-10, and SQL 80-20, all of which showed similar results. Starting with SQL, the new Micron drive placed first with a peak performance of 271,737 IOPS at a latency of 116.6µs.
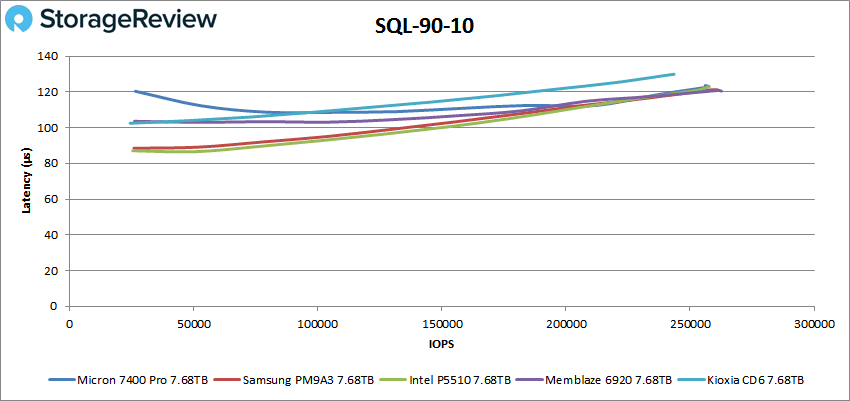
SQL 90-10 saw a tight race with the top 4 drives, as the Micron 7400 Pro peaked performance at 256,107 IOPS with a latency of 122.9µs.
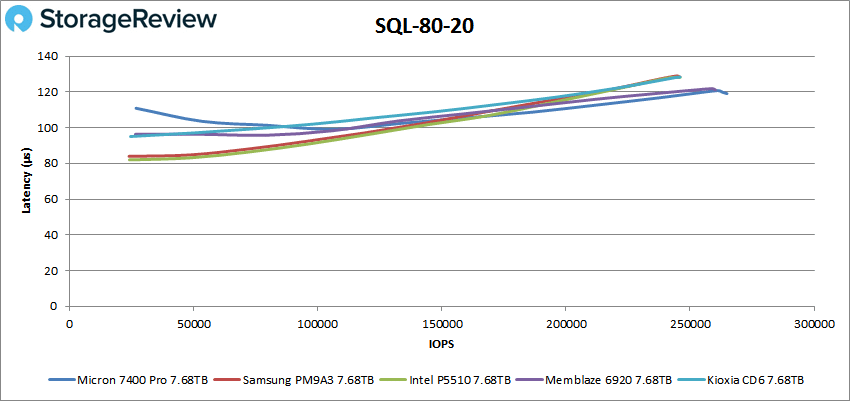
With SQL 80-20, the new Micron 7400 Pro placed first once again, peaking at 264,866 IOPS at a latency of 119.1µs.
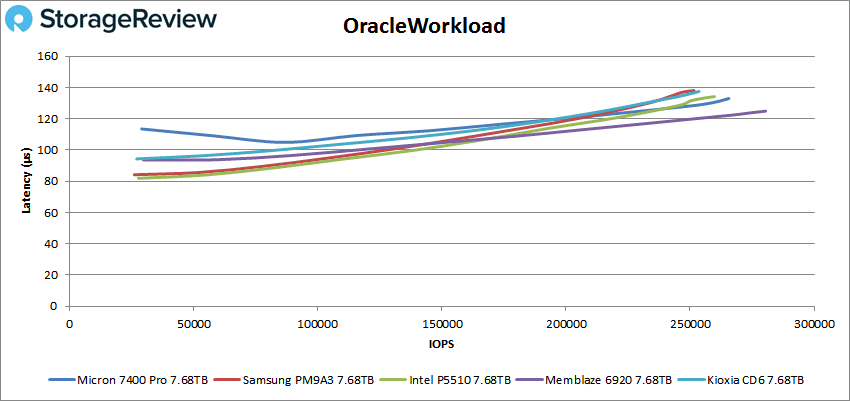
Next up are our Oracle workloads: Oracle, Oracle 90-10, and Oracle 80-20. Like with the SQL benchmarks, the Micron 7400 Pro continued its solid performance. Starting with Oracle, the Micron 7400 Pro had a peak performance of 265,626 IOPS at 133µs for second place.
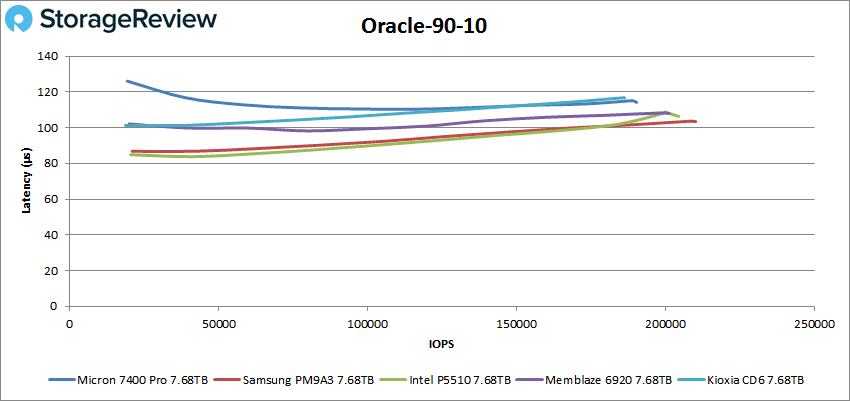
For Oracle 90-10, the Micron 7400 Pro peaked at 190K IOPS with 114.5µs in latency.
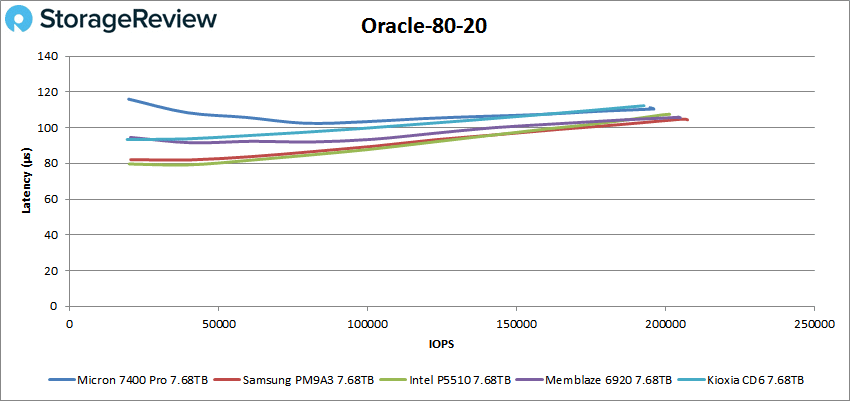
Looking at Oracle 80-20, the Micron 7400 Pro took posted a peak performance of 195,961 IOPS at 110.5µs, slightly trailing the top three drives.
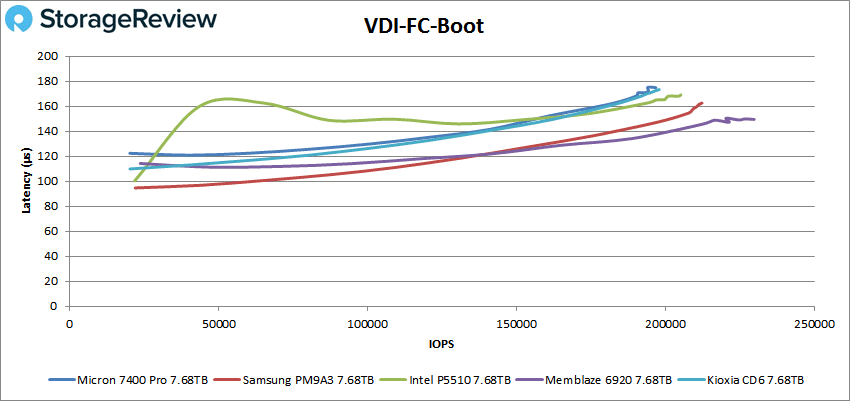
Next, we switched over to our VDI clone test, Full and Linked. For VDI Full Clone (FC) Boot, the Micron 7400 Pro fell behind the pack with a peak of 196,584 IOPS at a latency of 172.3µs.
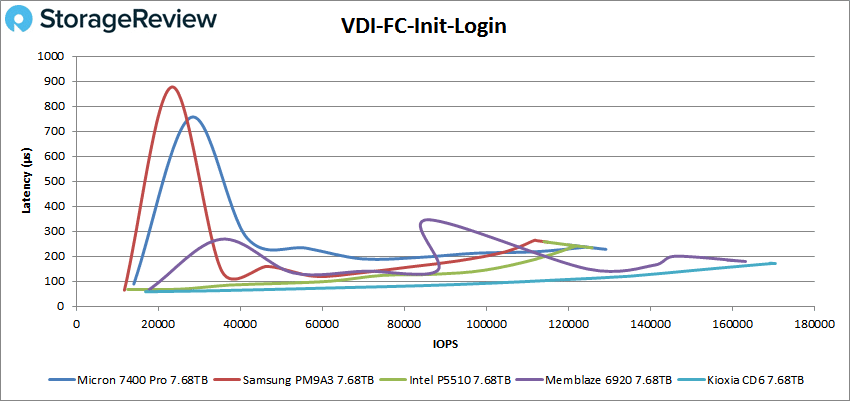
VDI FC Initial Login, the Micron 7400 Pro moved up the third among the tested drives with a peak of 128,231 IOPS and 229.7µs for latency.
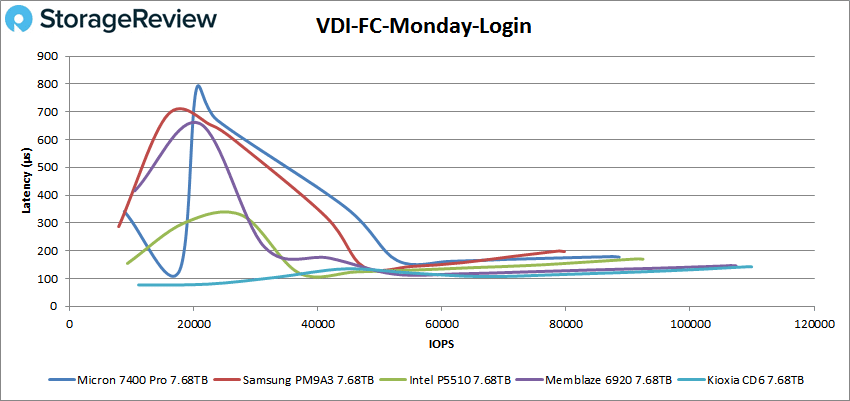
With VDI FC Monday Login, the Micron 7400 Pro placed fourth with 91,499 IOPS with a latency of 170.9µs.
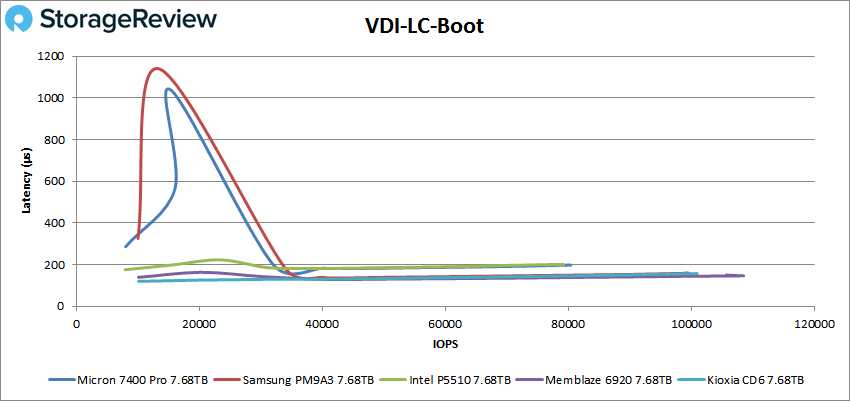
For VDI Linked Clone (LC) Boot, the Micron 7400 Pro performance took a huge spike in latency (similar to the Samsung PM9A3), though it leveled out around 38K IOPS. It eventually peaked at 80,173 IOPS with 197.7µs.
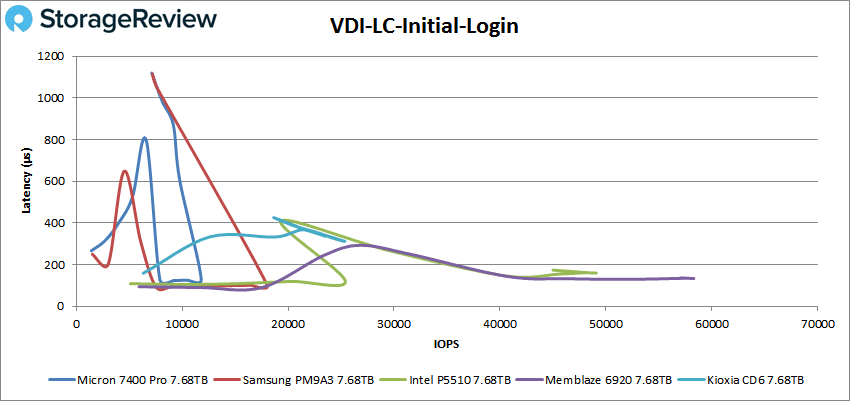
In VDI LC Initial Login, the Micron 7400 Pro’s performance struggled and never recovered. Nonetheless, it eventually peaked at just 7,127 IOPS with 1,118.8µs.
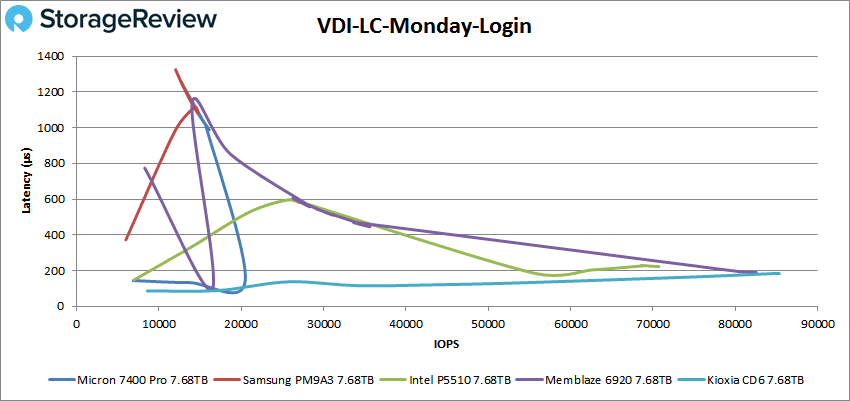
For VDI LC Monday Login, the Micron 7400 Pro continued its struggles, showing a huge spike in latency around the 20K IOPS mark, eventually ending at 12,664 IOPS at 1,260µs in latency.
Conclusion
Overall, the Micron 7400 Pro series is a solid entry into the company’s PCIe Gen4 enterprise SSD portfolio, featuring capacities up to 7.68TB, three different form factors, the company’s own 96-layer 3D TLC NAND, and their own controller. Micron indicates that these drives are ideal for organizations who want to migrate their content from their older data center technology to NVMe and flash-optimized form factors. Besides the read-intensive Pro model, the new 7400 line is also available in a “mixed-use” version dubbed “MAX”, making it more suitable for harsher workloads due to its higher much higher endurance rating.
For performance, the 7400 Pro had a strong overall showing during our benchmarks. We tested the new Micron drive against four other PCIe Gen4 enterprise 7.68TB SSDs with similar specifications and intended use cases: the KIOXIA CD6, Samsung PM9A3, Memblaze 6920, and Solidyme P5510. We looked at both application workload analysis and VDBench workloads.
In our Sysbench tests, we saw the 7400 Pro performed in the upper part of the leaderboard with aggregate scores of 10,744 TPS, 11.19ms in average latency, and 22.05ms in a worst-case scenario; all of which took the top spot. Results were similar during our SQL Server transactional benchmark, posting 12,648 TPS and an average latency of 3.5ms.
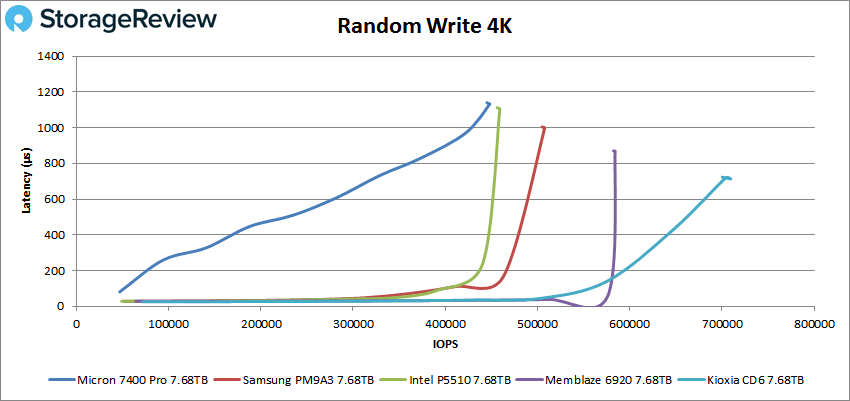
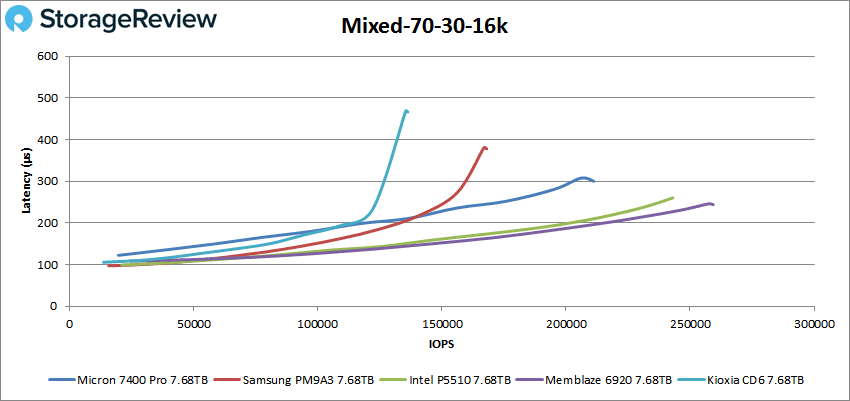
Switching over to VDBench, the Micron 7400 Pro continued this trend, often finding itself among the middle part of the leader board and higher (though it did struggle in writes). Highlights include 1.01 million IOPS read and 448K IOPS write in our 4k workloads, while hitting 5.37GB/s in 64K read, 2.61GB/s in 64K write, 3GB/s read in 16K read, 2.6GB/s in 16K writes, during our sequential workloads. Our mixed 70/30 profiles recorded 527k IOPS in 4K, 338K IOPS in 8K, and 211K IOPS in 16K.
In our SQL testing, the 7400 Pro saw peaks of 271K IOPS, 256K IOPS in SQL 90-10, and 265K IOPS in SQL 80-20, making it the best overall performer. Oracle workloads showed similar results, recording 266K IOPS, 199K IOPS in Oracle 90-10, and 196K IOPS in Oracle 80-20.
Next up were our VDI Clone tests, Full and Linked, where its performance was uneven. In Full Clone, we saw 196K IOPS in boot, 128K IOPS in Initial Login, and 91K IOPS in Monday Login. In Linked Clone, the new Micron drive really struggled, showing a peak of 80K IOPS in boot and just 7K IOPS in Monday Login. Initial Login continued this trend, showing a huge spike in latency at the 20K IOPS mark, eventually ending at 12K IOPS.
The Micron 7400 Pro is a solid-performing drive with excellent security features, making it quite clear that Micron is back in the SSD innovation game.
Engage with StorageReview
Newsletter | YouTube | Podcast iTunes/Spotify | Instagram | Twitter | Facebook | RSS Feed

