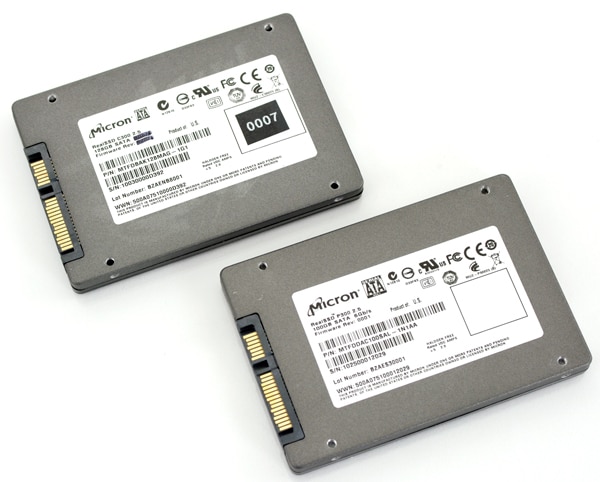
In August of last year, Micron announced the enterprise grade RealSSD P300. The P300 was the first enterprise SSD to market featuring the speedy SATA 6Gb/s interface delivering steady state IOPS up to 44,000 reads and 16,000 writes and throughput speeds of 360MB/s read and 275MB/s write. The P300 is powered by a Marvell 9174-family processor, high-endurance Micron 34nm SLC NAND and proprietary firmware. With lifetime data writes measuring in petabytes, this enterprise SSD is designed for the toughest workloads busnesses can create.
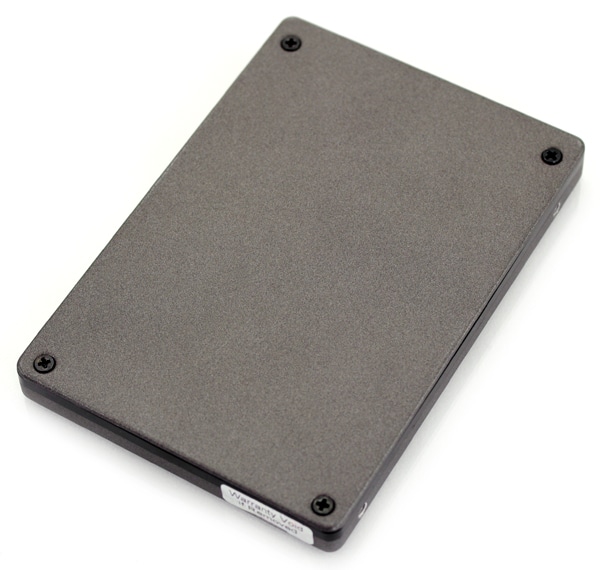
In the enterprise space, quality NAND is key – and the Micron NAND delivers. The 200GB P300 for instance offers a TBW (total bytes written) of 3.5 petabytes, which is equal to writing 1.9 terabytes per day for five years. The NAND also meets the ONFI 2.1 spec. The bottom line though, is when the P300 reaches steady state, it’s ready to deliver steady performance (both IOPS and throughput), where consumer-grade drives crumble under the pressure.
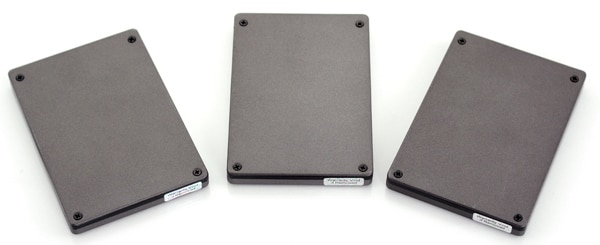
The Micron RealSSD is available in 50GB (MTFDDAC050SAL-1N1AA), 100GB (MTFDDAC100SAL-1N1AA) and 200GB (MTFDDAC200SAL-1N1AA) capacities. We have run three of the 100GB P300’s through our testbench over the past few weeks in various configurations including RAID 0, 1 and 5, as well as single drive runs on our LSI 9260-8i and through our LSI 9211 SATA 6Gb/s HBA. We’ll break down the results in this review and dive further into the benefits of performance at steady state and why this is important in the enterprise environment.
Micron RealSSD P300 Specs
- Formatted Capacity – 93.16GB
- SATA 6Gb/s Interface
- Marvell 88SS9174-BKK2 Processor
- Micron 34nm ONFI 2.1 SLC NAND
- 360MB/s reads, 287MB/s writes
- 60,000 Read, 45,000 Write Max IOPS
- 3.5 petabytes TBW (200GB Capacity)
- Operating Power Consumption: 1.9W for 50GB, 2.2W for 100GB, 2.5W for 200GB
- 2.5″ Form Factor
- 5 Year Warranty
Aesthetics
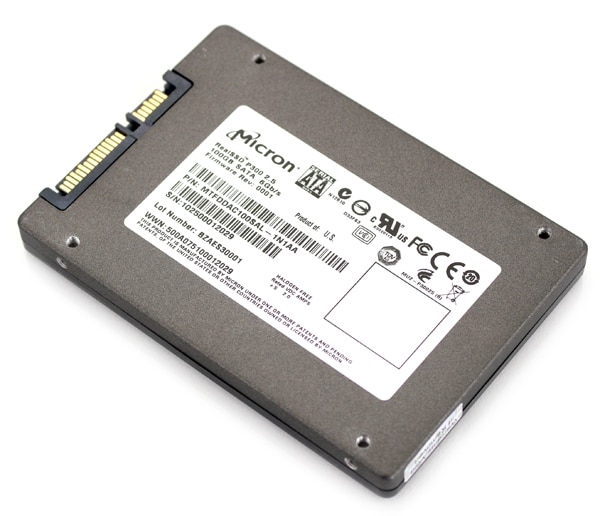
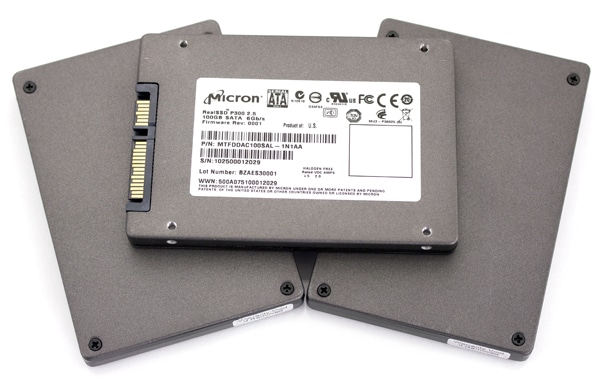
The RealSSD P300 sticks with the tried and true metal case we have seen from Micron over quite a few SSDs now. The case is made up of three sections on the 9.5mm 2.5-inch version; a top cover, plastic shim, and bottom cover. With a matte finish metallic paintjob, the design works well in any environment; be it inside a sever enclosure or stuffed into the latest notebook.
One thing that is so great about this case design is that it can pull double duty and work for both 7mm and 9.5mm 2.5-inch form-factors. With the plastic shim removed and smaller screws installed, the drive quickly transforms into the shorter 7mm drive height without any modification required.
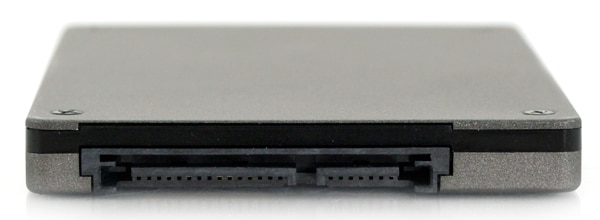
The front of the drive has the industry standard SATA power and data interface, without any exposed service pins. On this model the service pins are located internally.
Disassembly
Taking the RealSSD apart is very simple, as the case is only held together with four Phillips head screws. The case has a “Warranty Void if Removed” sticker on the side, which may get damaged if you try to open up the case. Since there are no user-serviceable parts inside this drive, don’t open your drive up and throw away the five-year included warranty.
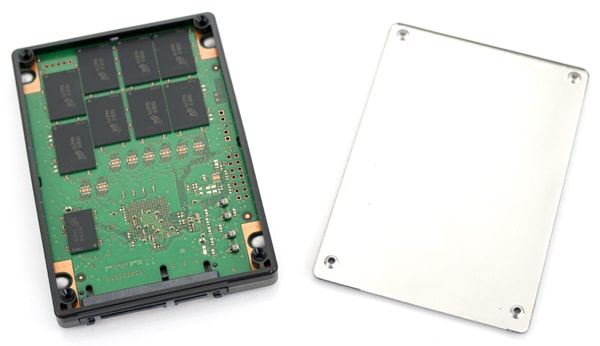
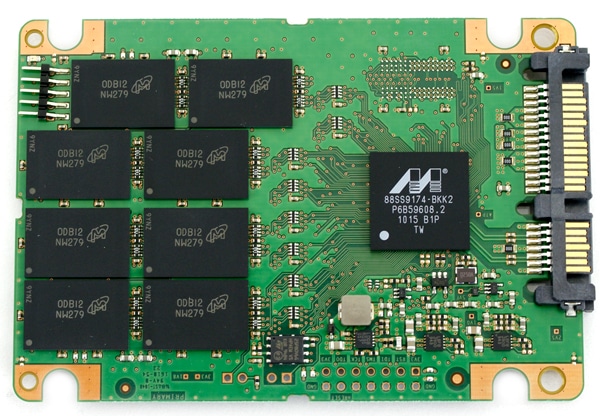
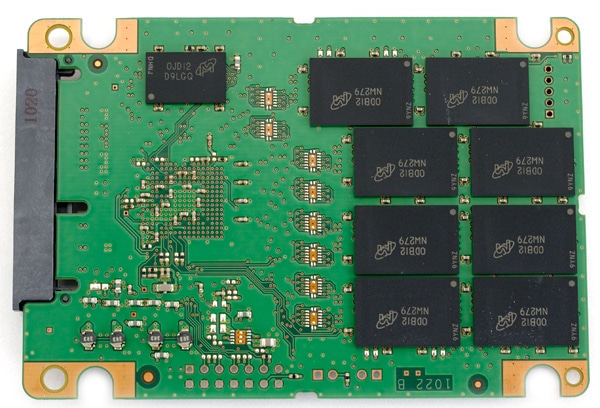
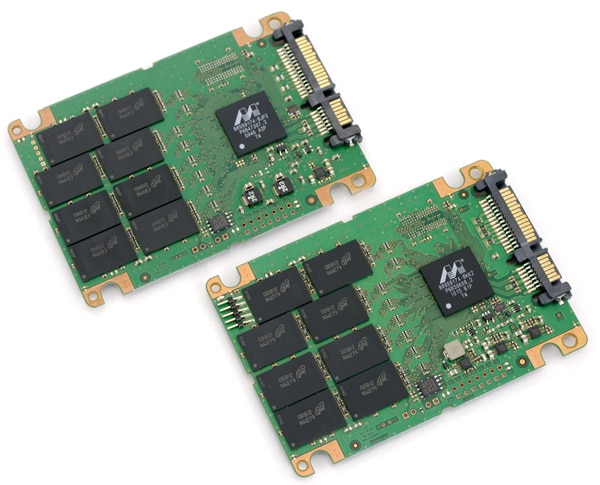
With four screws removed the top cover easily lifts off exposing the heart of the SSD inside. From the top you are actually introduced to the bottom of the SSD, which shows the NAND and RAM on the board. On the other side is where the controller and most of the components are located.
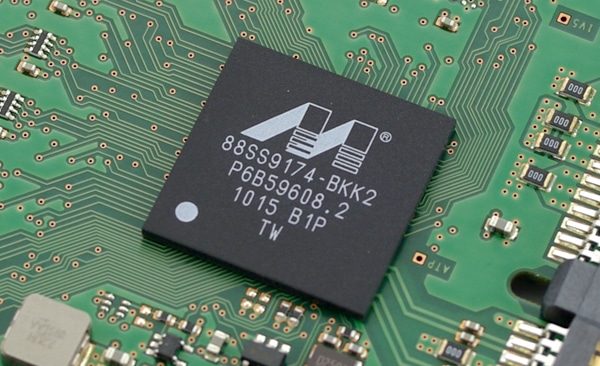
The primary components of the 100GB Micron RealSSD P300 include sixteen 0DB12-NW279 Micron 34nm SLC NAND chips, one 128MB 0JD12-D9LGQ Micron DDR piece, and the versatile SATA 3.0 Marvell 88SS9174-BKK2 processor controlling everything.
Synthetic Benchmarks
With a total of three 100GB Micron RealSSD P300s at our disposal, we were able to measure performance on a wide range of RAID and single drive settings. Through our LSI MegaRAID 9260-8i we tested the P300 as a single drive, as well as in RAID 0, 1, and 5. We also included results from a single drive connected through a LSI SAS 9211-8i HBA interface to show uncached results.
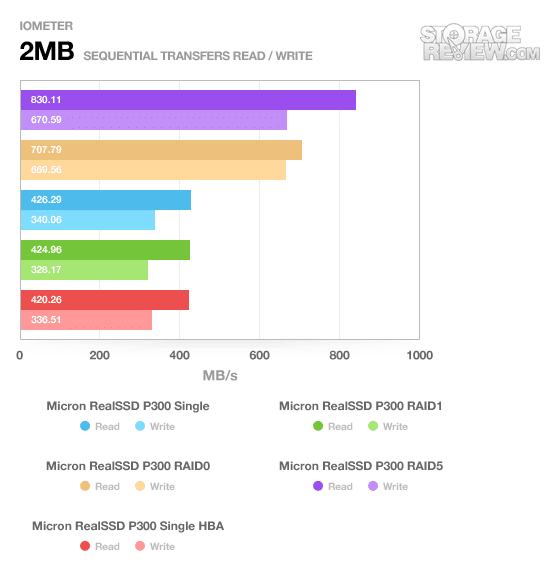
The first results we look at cover large sequential transfers using IOMeter.
At the top of the chart with speeds topping 830MB/s read are three P300s in RAID5, with a write speed of 670MB/s. The P300 by itself managed a very respectable 420MB/s read and 336MB/s write connected through our LSI SATA 6Gb/s HBA.
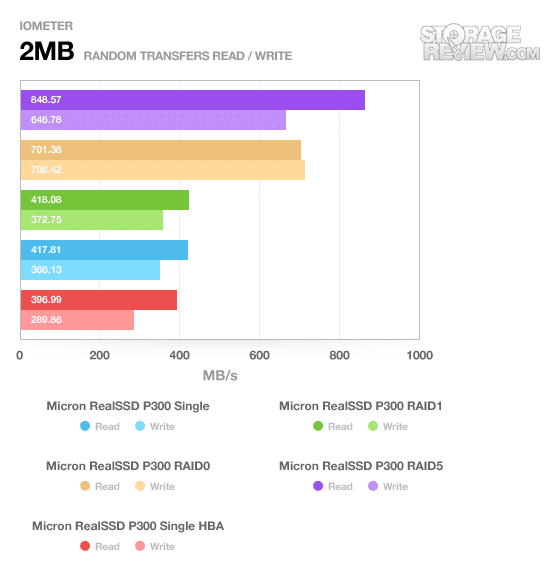
Looking at the random transfer speeds in this next test the RAID5 array still remained at the top, with some increase differentiation between the single P300 on the RAID card and through the uncached HBA.
The RAID5 array picked up speed, increasing from 830MB/s in the sequential test to 848MB/s in the random test. The P300 by itself on the 9260-8i dropped slightly to 418MB/s read and 372MB/s write, while through the HBA dropped to 396MB/s read and 289MB/s write.
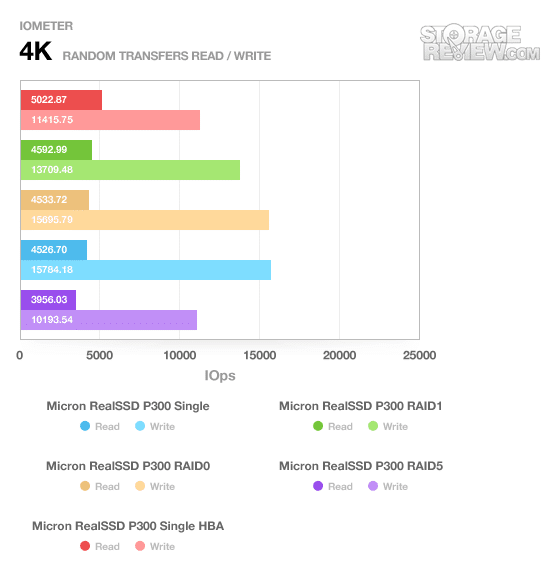
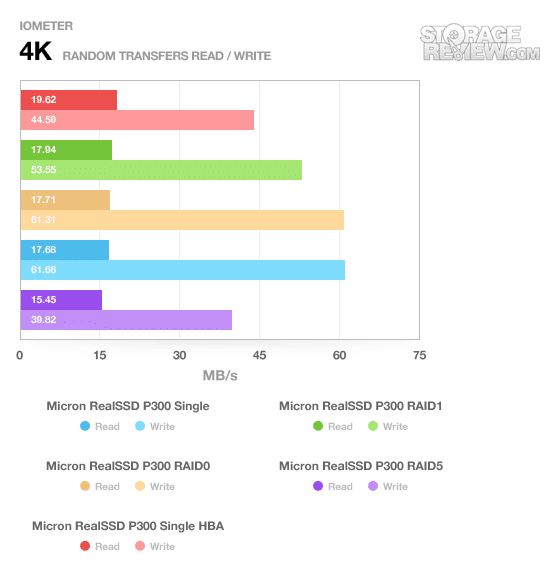
Our next test covers sustained random 4K transfers, using IOMeter to measure the performance of a 5GB LBA section at a queue depth of 1. Note that sustained and steady state speeds are vastly different, and are closer to what you would see in a single-user environment. Our steady state tests are in the section.
In this test the P300 through the 9211 stayed on top with 5000 IOPS random read and 11,400 IOPS random write. The P300 single RAID0 over the MegaRAID 9260 measured 4500 IOPS read and 15,800 IOPS write.
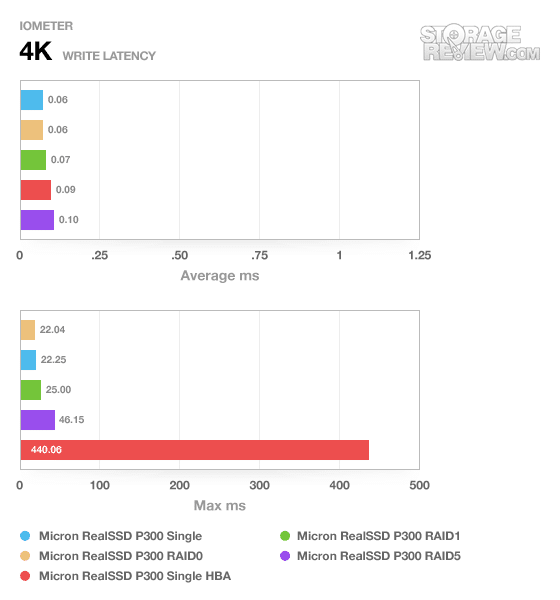
With its strong random 4K write speed, it was no surprise to see the RealSSD P300 connected through the LSI MegaRAID 9260 at the top of our write latency chart.
The single P300 through the 9260 had an average response time of 0.06ms, with a peak latency of 22.25ms. This compared to 0.09ms and 440ms through the uncached 9211 HBA.
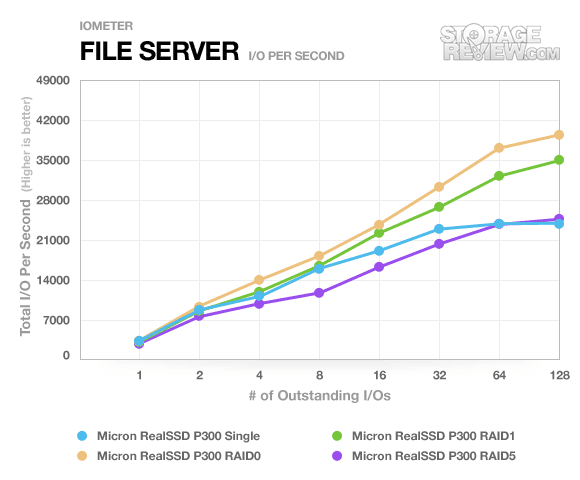
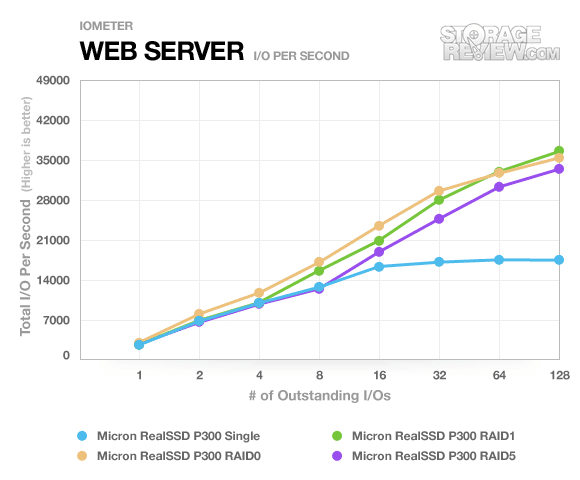
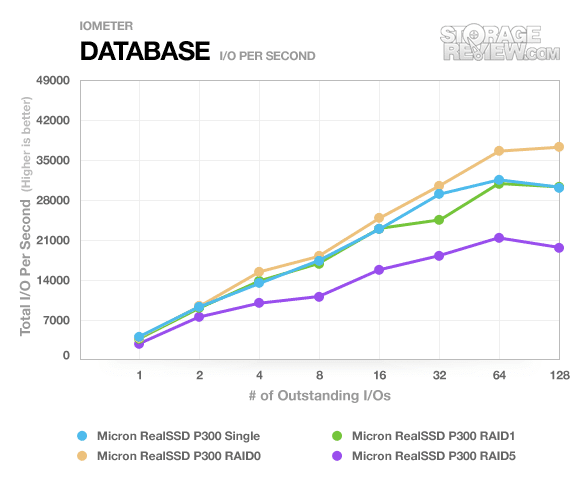
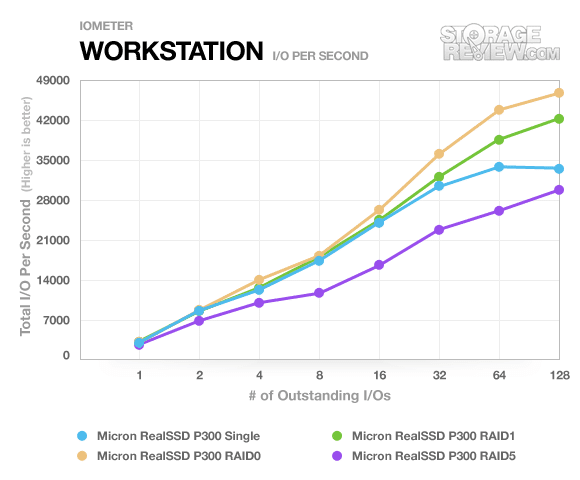
Given the enterprise nature of the 100GB Micron RealSSD P300, the IOMeter server profile tests were a perfect match for this review. The P300 exhibited strong performance upwards of a queue depth load of 128. The webserver profile on the single P300 was the only one to see a plateau after 16 outstanding I/Os.
Steady State Benchmarks
One question we have been asked countless times is what really separates consumer and enterprise drives in today’s market (besides price). In some ways you can look at the NAND flash used inside the drive you are purchasing, which would indicate how long the drive might last under the constant abuse of 24/7 writing. Another difference that you might notice right away is the usable space being less on an enterprise drive compared to a consumer product.
Enterprise SSDs are designed for entirely different usage scenarios compared to a consumer drives. While the average notebook user might see countless hours of the day with the drive sitting idle, it is not uncommon for enterprise drives to see a constant barrage of incoming data from the time the drive is installed to the time it wears out. The average home user might write terabytes of data over the span of a year, while a business might write that in a day. To handle these different loads, enterprise drives can be equipped with higher grades of NAND flash or over-provisioned with reserved space to let the drive maintain fast write speeds under a constant load. SLC NAND (versus MLC NAND) can handle much greater write loads over the course of its intended lifetime. Looking at the spec sheet of the P300 and the C300, the P300 lists a TBW (Total Bytes Written) figure of 3.5PB (3,500TB) whereas the C300 lists only 72TB.
While the next test might seem a bit unfair, putting the 128GB Crucial C300 up against the 100GB Micron P300, it best illustrates the differences between a consumer and enterprise SSD. In the introduction we mentioned the quoted steady state figures for the P300, which were 44,000 IOPS read and 16,000 IOPS write, contrasting the max IOPS of 60,000 read and 45,000 write. Steady state is the performance metric of an SSD under a constant write load going on indefinitely, compared to max/burst or sustained speeds which may only last minutes before plummeting. This is where over-provisioning comes into play, allowing the drive to handle background garbage collection tasks even if all of the usable space on the drive is filled up. Both of the SSDs we are comparing have the same 128GB capacity, but the P300 only gives 93.16GB to the end-user, where the C300 has 119.24GB available.
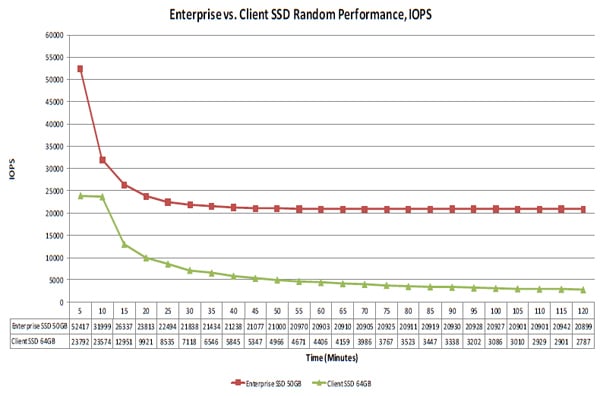
The chart below (from the SNW Spring 2011 SSD Hands-on-Lab) shows how under a constant random write load, the enterprise SSD is able to maintain much higher write speeds than the consumer SSD. In this test Micron put the 50GB P300 up against the 64GB C300.
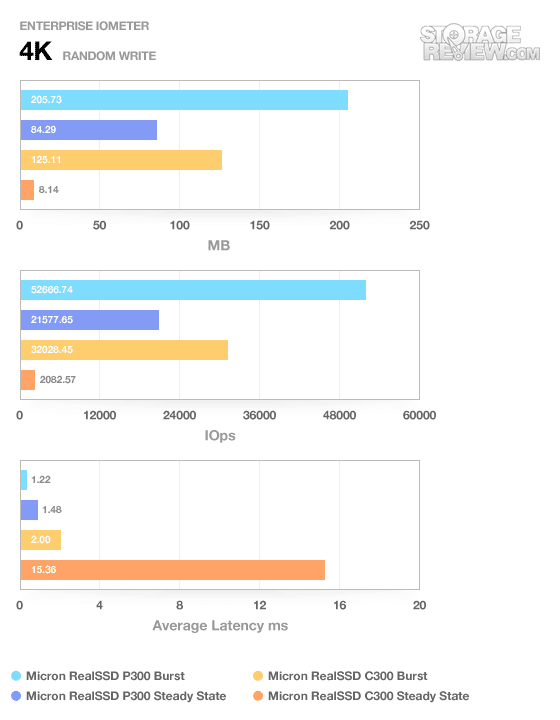
We decided to duplicate the same setup with slightly larger 100/128GB drives. As you can see below, some drives just shouldn’t be used in an enterprise environment.
Both drives saw significant drop-offs in write performance after a few hours of constant random 4K writes using IOMeter, but the big difference is how far each fell. The Micron RealSSD P300 dropped from 52.7k IOPS down to 21.6k, or roughly 60%. The C300 though went from 32k down to 2.1k, a much steeper 94.5% drop. Latency differences also changed dramatically on the C300, going from 2ms all the way up to 15.4ms with a 64 queue depth load. Needless to say the performance of any server the C300 was attached in that setting would see large spikes in lag as a result.
Real-World Benchmarks
Currently our real-world traces are more fitting for single-user consumer situations instead of multi-user enterprise settings, although we plan to roll out our first server traces soon. Until then we still wanted to include performance stats on the enterprise-class Micron RealSSD P300 to compare to other drives in the market that we have reviewed. Being the only SLC-based SSD we have tested (besides the PCIe-interface LSI WarpDrive) we decided to keep the charts still limited to different RAID configurations of the P300.
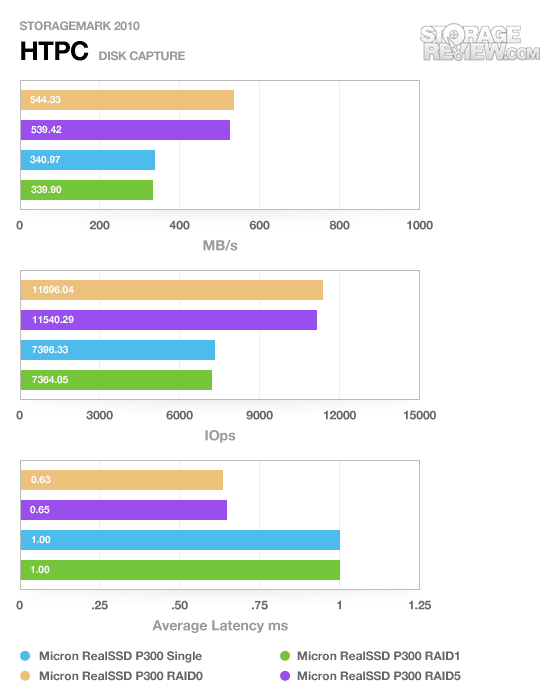
The first real-life test is our HTPC scenario. In this test we include: playing one 720P HD movie in Media Player Classic, one 480P SD movie playing in VLC, three movies downloading simultaneously through iTunes, and one 1080i HDTV stream being recorded through Windows Media Center over a 15 minute period. Higher IOps and MB/s rates with lower latency times are preferred. In this trace we recorded 2,986MB being written to the drive and 1,924MB being read.
The two-drive RAID0 array and three-drive RAID5 array performed very well in the HTPC trace. The RAID0 configuration held onto a small lead with an average 544MB/s speed, with RAID5 measuring 539MB/s. Both single drive and RAID1 setups came in almost tied with average speeds between 339 to 340MB/s.
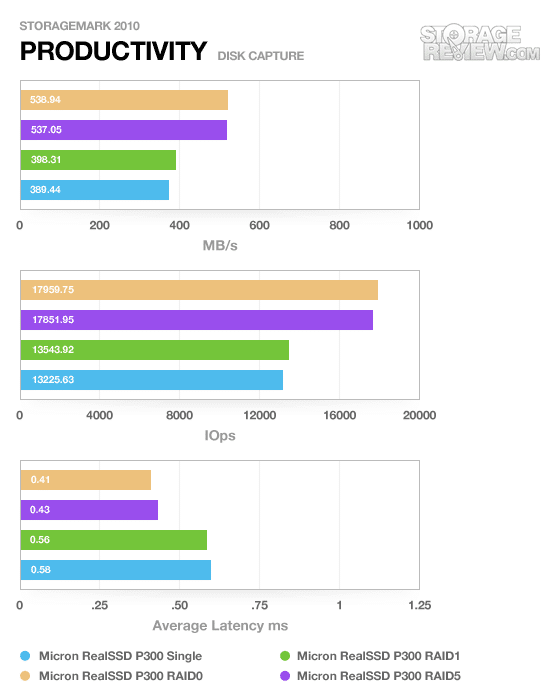
Our second real-life test covers disk activity in a productivity scenario. For all intents and purposes this test shows drive performance under normal daily activity for most users. This test includes: a three hour period operating in an office productivity environment with 32-bit Vista running Outlook 2007 connected to an Exchange server, web browsing using Chrome and IE8, editing files within Office 2007, viewing PDFs in Adobe Reader, and an hour of local music playback with two hours of additional online music via Pandora. In this trace we recorded 4,830MB being written to the drive and 2,758MB being read.
Again in our Productivity trace the RAID5 and RAID0 configurations stayed very close in speed; both measuring roughly 538MB/s. The RAID1 array edged out slightly above the single P300, with an average speed of 398MB/s compared to 389MB/s respectively.
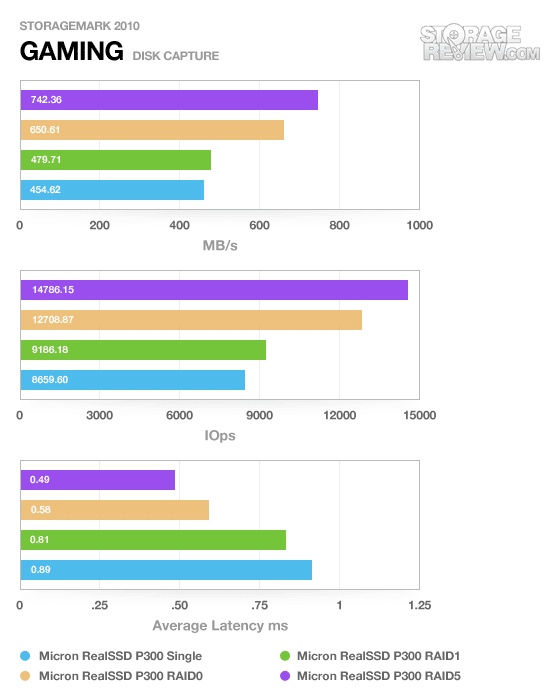
Our third real-life test covers disk activity in a gaming environment. Unlike the HTPC or Productivity trace, this one relies heavily on the read performance of a drive. To give a simple breakdown of read/write percentages, the HTPC test is 64% write, 36% read, the Productivity test is 59% write and 41% read, while the gaming trace is 6% write and 94% read. The test consists of a Windows 7 Ultimate 64-bit system pre-configured with Steam, with Grand Theft Auto 4, Left 4 Dead 2, and Mass Effect 2 already downloaded and installed. The trace captures the heavy read activity of each game loading from the start, as well as textures as the game progresses. In this trace we recorded 426MB being written to the drive and 7,235MB being read.
Given the strong bias towards read speeds in our gaming trace, the RAID5 array had no trouble staying on top. It measured an average speed of 742MB/s, compared to 650MB/s average from the RAID0 array. The RAID1 configuration was also able to pull ahead of the single P300, with a speed of 479MB/s compared to 454MB/s.
Power Consumption
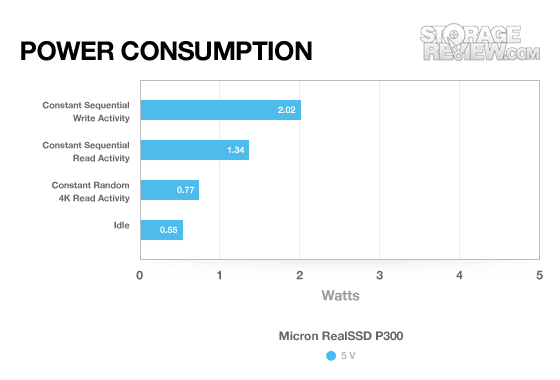
Micron provides an estimated operating power rate of the P300 for each capacity the drive is sold in. Ranging from 1.9W on the 50GB to 2.5W on the 200GB, the P300 is pretty modest on its power usage. In our power consumption test we look at how the drive handles itself under sequential 2MB write, sequential 2MB read, random 4K read, and idle.
On the 100GB RealSSD P300 we measured a peak operating power rate of 2.02 watts under a constant 2MB write pattern. Sequential read usage dropped to 1.34 watts, with the random read power rate dropping further still to 0.77 watts. Idle power rate stayed pretty low at 0.55 watts, with only a few consumer SSDs being able to match or beat that.
Warranty
Micron backs the RealSSD P300 with a five-year manufacturers warranty, as opposed to three years on their consumer models. The drive is listed as handling up to 3.5PB (Petabytes) written over its lifespan on the 200GB model, translating out to about 1.9TB per day. These figures are much greater than those you would find in any consumer counterpart utilizing MLC NAND.
Conclusion
The Micron RealSSD P300 brings a lot to the table if you are in the market for an enterprise-class SSD. It offers 50-200GB of 34nm Micron SLC NAND, a proven Marvell SATA 6Gb/s processor and is backed up with a strong five-year warranty. Offering up to 3.5PB of lifetime data written, it puts MLC counterparts to shame in a constant write environment.
The P300 also backs up its performance with steady state write speeds, which can vary greatly depending on how different manufacturers handle firmware and over-provisioning on an SSD. As we have been able to show in this review, there is a huge difference in behaviors between consumer and enterprise drives once you factor in steady state performance, which is where most enterprise drives spend a preponderance of their time. In our 4K random write steady state test, the C300 barely managed to hang on after a few hours of constant writes, while the P300 took the punishment and contently asked for more.
Pros
- Solid steady state performance
- In house Micron SLC NAND and firmware
- Better than advertised power consumption
Cons
- SLC NAND carries a premium price tag
Bottom Line
The Micron RealSSD P300 gives enterprise users with constant-write activity a high performance and reliable option. The key here is steady state performance – performance after the drive has burned through its burstable high end. Under that scenario the P300 keeps plowing away, easily dominating MLC-based SSDs. While there’s a hefty price premium for the SLC-based P300, in heavy duty use cases, the P300 is a solid option.

