
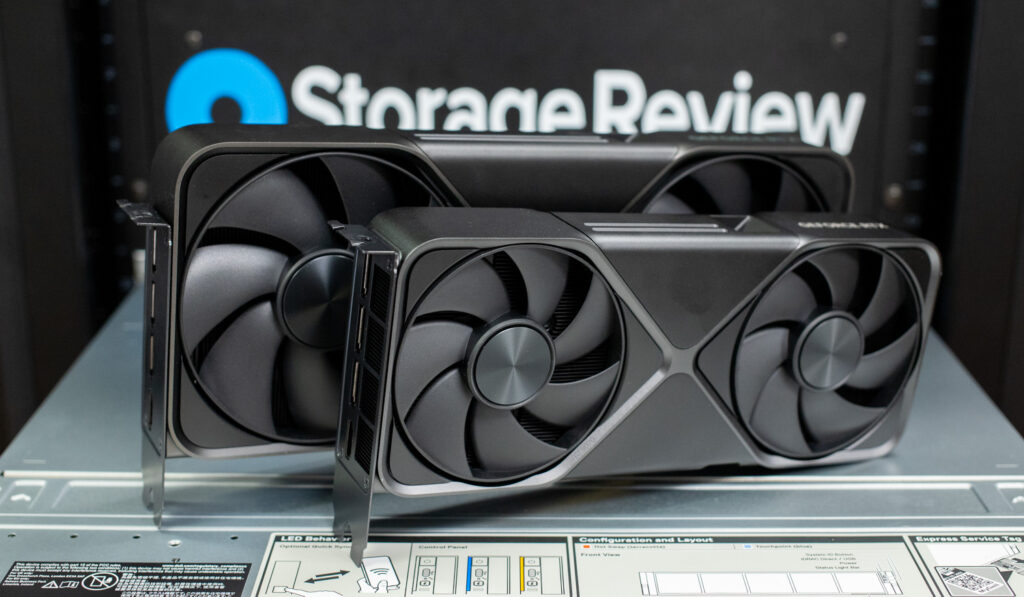
NVIDIA GeForce RTX 5070 Founders Edition Review: We test its Blackwell architecture, DLSS 4, AI performance, and gaming benchmarks.
The NVIDIA GeForce RTX 5070 Founders Edition joins the new 50-series lineup, arriving after the high-end 5080 and showcasing NVIDIA’s Blackwell architecture in a more mid-range package. While much has been speculated about its power efficiency, AI horsepower, and ray-tracing improvements, we will find out for ourselves in real-world testing. After running it through various benchmarks—from AI text generation to advanced 3D rendering—we can tell you exactly where it lands in NVIDIA’s next-gen roster.
Gamers and hardware enthusiasts are keen to see if the RTX 5070 can finally offer the strong price-to-performance ratio that midrange cards have always promised. Over the past few years, multiple RTX generations have been plagued by supply constraints, inflated prices, and underwhelming generational leaps, leaving consumers eager for more meaningful improvements.
On paper, the RTX 5070 promises a nice leap from the RTX 4070, touting DLSS 4’s Multi Frame Generation, higher memory bandwidth, and extra raw compute power—all in service of smoother gaming and snappier productivity. So, let’s take a look at its features, specifications, and details, then dive into how these advancements truly stack up against the previous generation, separating hype from real-world performance gains.
NVIDIA GeForce RTX 5070 Founders Edition Architecture
Leveraging the PCIe Gen5 interface, the RTX 5070 features 6,144 CUDA cores, running at a 2.16 GHz base clock and boosting up to 2.51 GHz. This results in 31 TFLOPS of FP32 compute performance, a clear improvement from the 4070’s 29 TFLOPS. 4th-gen ray tracing cores deliver 94 TFLOPS of RT power, offering better real-time reflections, global illumination, and path tracing support. 5th-gen Tensor cores push 988 AI TOPS, significantly improving AI-enhanced upscaling, frame generation, and computational workloads.
Compared to the RTX 4070 FE, NVIDIA indicates that the 5070 FE boasts up to a 1.9x improvement in 3D rendering when using DLSS 4 with Multi Frame Generation and 20% more rasterization performance. The difference is even more dramatic for those still using an RTX 3070: over 3x performance with DLSS 4 and 65% better traditional raster performance.
One of the most considerable hardware improvements is the jump to GDDR7 memory. The RTX 5070 retains 12GB of VRAM but upgrades from GDDR6X to GDDR7 on a 192-bit bus, increasing memory bandwidth to 675 GB/s—a 33% boost over the 4070’s 504 GB/s. This means faster texture loading, better 4K performance, and improved handling of large datasets in creative applications.
DLSS 4 & AI-Powered Features
DLSS 4 support is one of the biggest draws of the RTX 50 series. It introduces Multi Frame Generation, a new AI-powered technique that creates multiple frames per rendered frame, significantly boosting FPS in supported games. DLSS 4 enhances Ray Reconstruction and Super Resolution, improving image clarity and stability.
At launch, over 75 games already support DLSS 4, including newer games like Avowed and Kingdom Come Deliverance II and older releases like the massively popular Red Dead Redemption II and Microsoft Flight Simulator. Thanks to the new RT cores and AI-assisted denoising techniques, games that leverage ray tracing and path tracing will likely see a noticeable boost.
For competitive gamers, NVIDIA Reflex 2 brings Frame Warp, a new method for reducing system latency by dynamically adjusting frame timing based on real-time mouse input. This could benefit fast-paced shooters like Overwatch, Call of Duty multiplayer, Marvel’s Rivals, and other esports titles.
Enhancements for Content Creation & Professional Workloads
Beyond gaming, the RTX 5070 is great for creators. One major upgrade is dedicated hardware-accelerated 4:2:2 video encoding, which makes exporting professional-grade video up to 6x faster than the RTX 4070. NVIDIA Studio drivers provide optimized performance in video editing, 3D rendering, and live streaming, with AI-powered tools integrated into over 130 creative applications.
For AI-based workflows, the 5070 delivers three times the GenAI performance of the RTX 4070, thanks to FP4 acceleration and the latest Blackwell tensor cores. While certainly not the same power as the upper models of the 50-Series, this still makes it a powerful choice for machine learning, AI-driven image processing, and computational photography—helping users train models faster, enhance images with AI, and push the limits of creative automation.
NVIDIA GeForce RTX 5070 Founders Edition Efficiency & Cooling
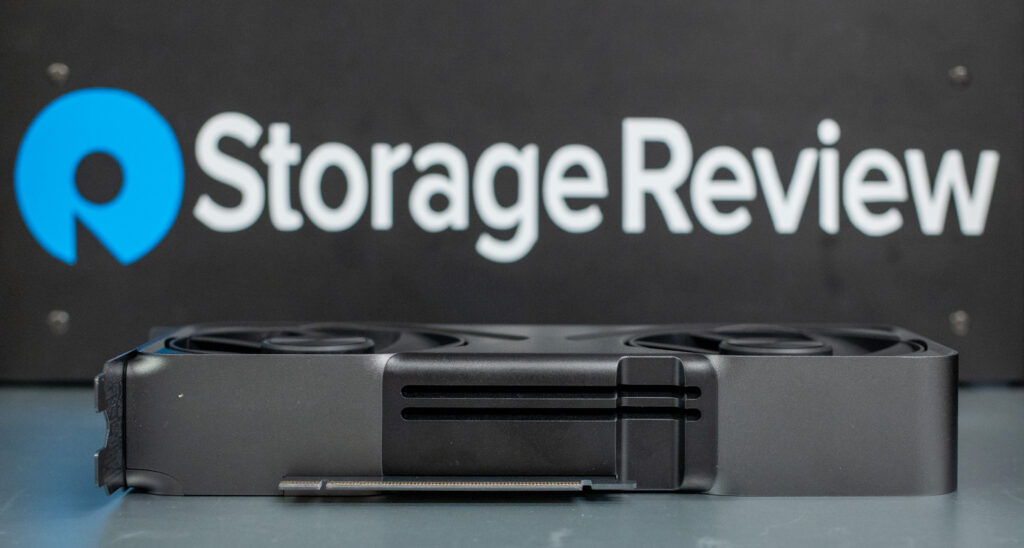
Despite its increased 250W TGP (up from the 4070’s 200W), the RTX 5070 remains surprisingly efficient given the significant performance boost. NVIDIA has balanced power draw and computational output well, ensuring users get a significant performance boost without a disproportionate jump in energy consumption. While the higher TGP might raise eyebrows, the efficiency and cooling improvements make it a smart trade-off for those needing sustained power without excessive energy waste.
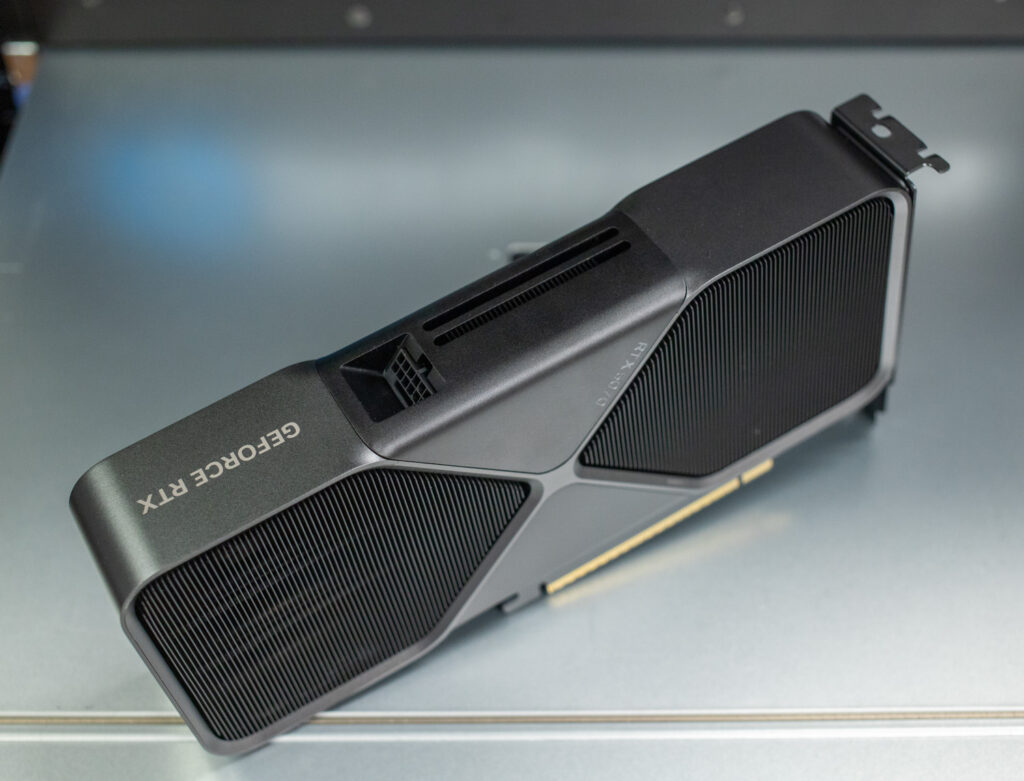
Moreover, the NVIDIA RTX 5070 Founders Edition features an optimized dual-fan setup that efficiently manages airflow and heat dissipation. With larger heatsinks and an improved vapor chamber, it’s clear that NVIDIA prioritized thermal stability. This means users can push the 5070 through extended AI training runs, high-resolution rendering, or other intensive workloads without worrying about performance dips due to thermal throttling.
For those who need reliable performance without overheating concerns, the 5070’s design feels like a well-engineered upgrade rather than a simple brute-force power bump.
Display & Connectivity
As expected, the RTX 5070 is built for high-refresh-rate gaming and professional display setups. It supports 4K at 480Hz and 8K at 120Hz through its three DisplayPort 2.1b ports and one HDMI 2.1b port. This makes it a great choice for esports monitors with extreme refresh rates, high-end 4K gaming displays, and professional 8K monitors in video production, 3D rendering, and HDR content creation.
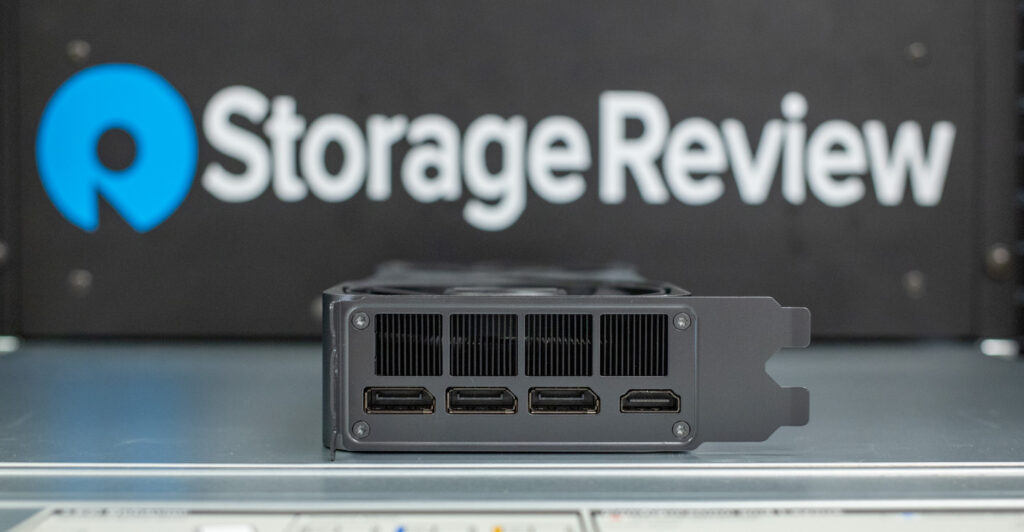
However, it’s worth noting that the HDMI Forum announced HDMI 2.2 at CES 2025, which dramatically boosts bandwidth to 96Gbps, allowing for 10K resolution and refresh rates up to 240Hz. If you’re looking to future-proof for that level of performance, you’ll likely need to wait for the next generation of RTX cards to take full advantage.
Now, let’s examine the performance results and see what the RTX 5070 offers. For RTX 4070 owners—or even those still holding onto a 30—or 20-Series GPU—the big question is whether its improvements in AI-driven graphics, ray tracing, and memory speed make upgrading worthwhile.
NVIDIA GeForce RTX 5070 Founders Edition Specifications
| GPU Comparison | NVIDIA RTX 4070 | NVIDIA RTX 5070 | ASUS Prime NVIDIA RTX 5070 Ti | NVIDIA RTX 5080 |
| GPU Name | AD104 | GB205 | GB203 | GB203 |
| Architecture | Ada Lovelace | Blackwell 2.0 | Blackwell 2.0 | Blackwell 2.0 |
| Process Size | 5 nm | 5 nm | 5 nm | 5 nm |
| Transistors | 35,800 million | 31,000 million | 45,600 million | 45,600 million |
| Density | 121.8M / mm² | 117.9M / mm² | 120.6M / mm² | 120.6M / mm² |
| Die Size | 294 mm² | 263 mm² | 378 mm² | 378 mm² |
| Slot Width | Dual-slot | Dual-slot | 2.5 Slot | Dual-slot |
| Dimensions | 240 mm x 110 mm x 40 mm | 242 mm x 112 mm | 304 x 126 x 50 mm | 304 mm x 137 mm x 48 mm |
| TDP | 200 W | 250 W | 300 W | 360 W |
| Video Connections | 1x HDMI 2.1, 3x DisplayPort 1.4a | 1x HDMI 2.1b, 3x DisplayPort 2.1a | 1x HDMI 2.1b, 3x DisplayPort 2.1b | 1x HDMI 2.1b, 3x DisplayPort 2.1b |
| Power Connectors | 1x 16-pin | 1x 16-pin | 1x 16-pin | 1x 16-pin |
| Bus Interface | PCIe 4.0 x16 | PCIe 5.0 x16 | PCIe 5.0 x16 | PCIe 5.0 x16 |
| Base Clock | 1920 MHz | 2165 MHz | 2300 MHz | 2295 MHz |
| Boost Clock | 2475 MHz | 2510 MHz | OC mode: 2482MHz Default mode: 2452MHz (Boost Clock) |
2617 MHz |
| Memory Clock | 1313 MHz (21 Gbps effective) | 2209 MHz (28 Gbps effective) | 1750 MHz (28 effective) Gbps |
2366 MHz (30 Gbps effective) |
| Memory Size | 12 GB | 12 GB | 16 GB | 16 GB |
| Memory Type | GDDR6X | GDDR7 | GDDR7 | GDDR7 |
| Memory Bus | 192 bit | 192 bit | 256 bit | 256 bit |
| Memory Bandwidth | 504.2 GB/s | 672.2 GB/s | 896.0 GB/s | 960.0 GB/s |
| CUDA Cores | 5888 | 6,144 | 8960 | 10,752 |
| TMUs | 184 | 192 | 280 | 336 |
| ROPs | 64 | 64 | 128 | 128 |
| SM Count | 46 | 48 | 70 | 84 |
| Tensor Cores | 184 | 192 | 280 | 336 |
| RT Cores | 46 | 48 | 70 | 84 |
| L1 Cache | 128 KB (per SM) | 128 KB (per SM) | 128 KB (per SM) | 128 KB (per SM) |
| L2 Cache | 36 MB | 40 MB | 64 MB | 64 MB |
| Pixel Rate | 158.4 GPixel/s | 160.6 GPixel/s | 313.9 GPixels/s | 335.0 GPixel/s |
| Texture Rate | 455.4 GTexel/s | 481.9 GTexel/s | 686.6 GTexel/s | 879.3 GTexel/s |
| FP16 (half) | 29.15 TFLOPS (1:1) | 30.84 TFLOPS (1:1) | 43.94 TFLOPS (1:1) | 56.28 TFLOPS (1:1) |
| FP32 (float) | 29.15 TFLOPS | 30.84 TFLOPS | 43.94 TFLOPS | 56.28 TFLOPS |
| FP64 (double) | 455.4 GFLOPS (1:64) | 481.9 GFLOPS (1:64) | 686.6 GFLOPS (1:64) | 879.3 GFLOPS (1:64) |
| Launch Price (USD) | $599 | $549 | $749 | $999 |
StorageReview AMD Threadripper Test Platform
Here is the test platform we will be using for our RTX 5070 FE testing:
- Motherboard: ASUS Pro WS TRX50-SAGE WIFI
- CPU: AMD Ryzen Threadripper 7980X 64-Core
- RAM: 128GB DDR5 4800MT/s
- Storage: 2TB Samsung 980 Pro
- OS: Windows 11 Pro for Workstations
- Driver: NVIDIA 571.86 GameReady Driver
The AMD Ryzen Threadripper 7980X sits at the core of our test system, with 64 cores and extensive multi-threading capabilities. This ensures CPU limitations don’t interfere with GPU-focused benchmarks, especially in AI processing, ray tracing, and high-resolution rendering, where workloads are heavily offloaded to the GPU.
We paired the 7980X with the ASUS Pro WS TRX50-SAGE WIFI motherboard to deliver ample PCIe bandwidth, ensuring the GPU can achieve its full potential without bottlenecks. Our system also includes 128GB of DDR5 memory at 4800MT/s, providing enough headroom for smooth operation when handling large datasets. Although the Samsung 980 Pro is a slightly older Gen4 SSD, it still delivers fast read/write speeds, keeping load times minimal and preventing data-heavy tasks—like AI model inference or texture streaming—from being hindered by storage performance.
This setup should allow us to isolate and accurately measure the GeForce RTX 5070’s real-world performance, so let’s get right into it.
We will compare the RTX 5070 FE against the following GPUs:
- NVIDIA RTX 5080 (16GB GDDR7)
- ASUS Prime NVIDIA RTX 5070 Ti (16GB GDDR7)
- NVIDIA RTX 4070 (12GB GDDR6X)
UL Procyon: AI Text Generation
First up in our gauntlet of tests is the Procyon AI Text Generation Benchmark. This benchmark simplifies AI LLM performance testing by offering a compact and consistent evaluation method, allowing for repeated testing across multiple LLM models while minimizing the complexity of large model sizes and variable factors. Developed with AI hardware leaders, this benchmark optimizes the use of local AI accelerators for more reliable and efficient performance assessments. The results measured below were tested using TensorRT.
Here, the RTX 5070 Founders Edition improves on the previous generation’s 4070 across every test. Whether it’s the Overall Scores, Output Time to First Token, or Tokens Per Second, the 5070 FE shows a jump in performance—generally in the neighborhood of 10–15%. That bump translates into faster AI outputs, shorter wait times, and smoother model inference. For instance, in the Phi benchmark, the 4070’s score of 3,191 increases to 3,453 on the 5070 FE, with Tokens Per Second climbing from 141.575 to 150.435. While not earth-shattering, that difference is enough to see a noticeable improvement in synthetic workloads and real-world usage.
Compared to the more powerful 5070 Ti, the 5070 FE expectedly trails by roughly 15–25%, depending on the specific test. For example, in the same Phi benchmark, the Ti version hits 4,179 on the Overall Score—a marked jump from the FE’s 3,453. This performance gap remains consistent across the Mistral and Llama series tests, showing that the Ti provides a more substantial margin for users who need heavier AI throughput. Meanwhile, the flagship 5080 sits at the top of the leaderboard, outpacing the 5070 Ti by an additional 5–10%. Its advantage is most evident in token generation speed and time to first token, where shaving off a fraction of a second can add up in high-volume workloads.
While the 5070 FE is no slouch for AI inference tasks, power users who want even faster generation times—or those handling vast datasets—might find that the 5070 Ti or 5080 better meets their needs in this performance area.
| UL Procyon: AI Text Generation | NVIDIA RTX 4070 | NVIDIA RTX 5070 | ASUS Prime NVIDIA RTX 5070 Ti | NVIDIA RTX 5080 |
| Phi Overall Score | 3,191 | 3,453 | 4,179 | 4,400 |
| Phi Output Time To First Token | 0.356 s | 0.323 s | 0.290 s | 0.277 s |
| Phi Output Tokens Per Second | 141.575 tokens/s | 150.435 tokens/s | 192.487 tokens/s | 209.459 tokens/s |
| Phi Overall Duration | 21.743 s | 20.302 s | 15.771 s | 14.908 s |
| Mistral Overall Score | 2,987 | 3,562 | 4,412 | 4,635 |
| Mistral Output Time To First Token | 0.508 s | 0.433 s | 0.374 s | 0.347 s |
| Mistral Output Tokens Per Second | 99.590 tokens/s | 120.507 tokens/s | 160.167 tokens/s | 163.598 tokens/s |
| Mistral Overall Duration | 30.651 s | 25.496 s | 19.480 s | 18.933 s |
| Llama3 Overall Score | 2,810 | 3,125 | 4,187 | 4,424 |
| Llama3 Output Time To First Token | 0.423 s | 0.379 s | 0.306 s | 0.283 s |
| Llama3 Output Tokens Per Second | 82.130 tokens/s | 100.388 tokens/s | 131.853 tokens/s | 136.177 tokens/s |
| Llama3 Overall Duration | 36.147 s | 29.720 s | 22.786 s | 21.985 s |
| Llama2 Overall Score | 2,658 | 3,125 | 4,284 | 4,790 |
| Llama2 Output Time To First Token | 0.947 s | 0.785 s | 0.560 s | 0.493 s |
| Llama2 Output Tokens Per Second | 49.487 tokens/s | 56.647 tokens/s | 75.905 tokens/s | 83.653 tokens/s |
| Llama2 Overall Duration | 61.300 s | 53.234 s | 39.545 s | 35.703 s |
UL Procyon: AI Image Generation
The Procyon AI Image Generation Benchmark consistently and accurately measures AI inference performance across various hardware, from low-power NPUs to high-end GPUs. It includes three tests: Stable Diffusion XL (FP16) for high-end GPUs, Stable Diffusion 1.5 (FP16) for moderately powerful GPUs, and Stable Diffusion 1.5 (INT8) for low-power devices. The benchmark uses the optimal inference engine for each system, ensuring fair and comparable results.
The RTX 5070 FE improves over the 4070 in every image-generation test—most notably in Stable Diffusion 1.5 (FP16), where it jumps from a 2,400 overall score on the 4070 to 2,937 on the 5070 FE. This gap translates into faster image production and shorter inference times across FP16 and INT8 benchmarks, making the 5070 FE a strong contender for users focused on AI-driven graphics workloads. Compared to the 5070 Ti and 5080, the 5070 FE lags roughly 20–25% in most tests, which may justify the Ti’s steeper price for users with incredibly demanding AI image-generation needs. Meanwhile, the 5080 pushes things further, topping the Ti by another 15–20%.
From a real-world standpoint, the RTX 5070 FE delivers a clear edge over the 4070, translating into noticeably faster inference times and smoother content creation workflows. However, if you’re regularly handling complex or large-scale image-generation tasks, the extra 20–25% performance boost offered by the 5070 Ti—or the additional 15–20% leap with the 5080—might be worth the investment.
| UL Procyon: AI Image Generation (overall score: higher is better) | NVIDIA RTX 4070 | NVIDIA RTX 5070 | ASUS Prime NVIDIA RTX 5070 Ti | NVIDIA RTX 5080 |
| Stable Diffusion 1.5 (FP16) — Overall Score | 2,400 | 2,937 | 3,755 | 4,650 |
| Stable Diffusion 1.5 (FP16) — Overall Time | 41.661 s | 34.038 s | 26.625 s | 21.503 s |
| Stable Diffusion 1.5 (FP16) — Image Generation Speed | 2.604 s/image | 2.127 s/image | 1.664 s/image | 1.344 s/image |
| Stable Diffusion 1.5 (INT8) — Overall Score | 31,048 | 36,320 | 46,744 | 55,683 |
| Stable Diffusion 1.5 (INT8) — Overall Time | 8.052 s | 6.883 s | 5.348 s | 4.490 s |
| Stable Diffusion 1.5 (INT8) — Image Generation Speed | 1.006 s/image | 0.860 s/image | 0.669 s/image | 0.561 s/image |
| Stable Diffusion XL (FP16) — Overall Score | 1,940 | 2,473 | 3,352 | 4,257 |
| Stable Diffusion XL (FP16) — Overall Time | 309.269s | 242.606s | 178.946 s | 140.928s |
| Stable Diffusion XL (FP16) — Image Generation Speed | 19.329 s/image | 15.163 s/image | 11.184 s/image | 8.808 s/image |
Luxmark
Luxmark is a GPU benchmark that uses LuxRender, an open-source ray tracing renderer, to evaluate a system’s performance in handling highly detailed 3D scenes. This benchmark is pertinent for assessing the graphical rendering prowess of servers and workstations, especially for visual effects and architectural visualization applications, where accurate light simulation is critical.
In Luxmark, which gauges advanced ray-tracing performance, the RTX 5070 FE delivers around a 20% boost over the 4070 in the Food scene test (7,535 vs. 9,061) and roughly 10% in the Hall scene (20,003 vs. 22,062). Compared to the 5070 Ti, it lags by about 33% in Food (9,061 vs. 12,073) and 30% in Hall (22,062 vs. 28,635)—a notable gap that may justify the Ti’s higher price tag for users tackling large-scale 3D renders or VFX projects. The 5080 extends those margins even further, outperforming the 5070 FE by more than 50% in Food (9,061 vs.13,637) and around 40% in Hall (22,062 vs. 30,815).
| Luxmark (higher is better) | NVIDIA RTX 4070 | NVIDIA RTX 5070 | ASUS Prime NVIDIA RTX 5070 Ti | NVIDIA RTX 5080 |
| Food Score | 7,535 | 9,061 | 12,073 | 13,637 |
| Hall Score | 20,003 | 22,062 | 28,635 | 30,815 |
In related workflows—such as architectural visualization or visual effects production—the 5070 FE still represents a solid overall jump from the 4070.
Geekbench 6
Geekbench 6 is a cross-platform benchmark that measures overall system performance. The Geekbench Browser allows you to compare any system to it.
In the results table below, the RTX 5070 FE puts up 188,892 points, a decent improvement from the 4070’s 174,725. An 8% jump in Geekbench 6’s GPU OpenCL score—from 174,725 to 188,892—may not sound huge at first glance. However, it can still offer a modest boost for those tackling resource-intensive tasks like high-resolution video editing, complex 3D rendering, or machine-learning inference. While it won’t dramatically impact simpler workflows, the extra headroom can be more noticeable if you frequently push your GPU to its limits.
| Geekbench (higher is better) | NVIDIA RTX 4070 | NVIDIA RTX 5070 | ASUS Prime NVIDIA RTX 5070 Ti | NVIDIA RTX 5080 |
| GPU OpenCL Score | 174,725 | 188,892 | 246,875 | 265,397 |
The gap expectedly widens when compared to the higher-end models of the 50-Series. The 5070 Ti racks up 246,875 points, about 30% more power. At the top of the leaderboard, the 5080 pushes even further to 265,397, appealing to workstation pros and serious enthusiasts. Still, the 5070 FE is a sweet spot for users who want a noticeable upgrade in heavier GPU-based tasks without having to venture into more expensive territory.
V-Ray
The V-Ray Benchmark measures rendering performance for CPUs, NVIDIA GPUs, or both using advanced V-Ray 6 engines. It uses quick tests and a simple scoring system to let users evaluate and compare their systems’ rendering capabilities. It’s an essential tool for professionals seeking efficient performance insights.
Here, the RTX 5070 FE posts a score of 6,553, which is a significant 47% jump over the 4,469 scored by the RTX 4070. This increase will likely translate into a much smoother experience in rendering-intensive workloads, such as ray-traced scenes, architectural visualizations, or high-end CGI. For professionals or enthusiasts upgrading to the 5070 from a 4070, render times could see a noticeable drop, depending on the rest of their system setup.
| V-Ray (higher is better) | NVIDIA RTX 4070 | NVIDIA RTX 5070 | ASUS Prime NVIDIA RTX 5070 Ti | NVIDIA RTX 5080 |
| vpaths | 4,469 | 6,553 | 8,018 | 9,311 |
Comparing the RTX 5070 to the higher-end models, the 5070 Ti shows a vpath score of 8,018, outperforming the 5070 FE by about 22%. The 5080, again, pushes even further to 9,311, offering 42% more performance than the 5070 FE. While the Ti and 5080 are better suited for heavy-duty rendering workloads, the 5070 FE still represents a substantial step up from the previous generation, making it a strong mid-range option.
3D Mark
3DMark Port Royal, Speed Way, and Steel Nomad are GPU benchmarks testing performance in different scenarios. Port Royal focuses on ray tracing, Speed Way evaluates performance in racing simulations, and Steel Nomad challenges GPUs with high-intensity, realistic graphics. They assess GPU capabilities in rendering, lighting, and dynamic scenes.
| 3DMark Test (higher is better) | NVIDIA GeForce RTX 4070 | NVIDIA RTX 5070 | ASUS PRIME NVIDIA RTX 5070 Ti |
| Port Royal | 11,074 | 14,026 | 19,290 |
| Speed Way | 4,477 | 5,869 | 7,709 |
| Steel Nomad | 3,748 | 5,019 | 6,458 |
The NVIDIA RTX 5070 delivers up to 31% higher performance than the RTX 4070 across 3DMark benchmarks, offering a substantial value upgrade for its price point. The ASUS PRIME RTX 5070 Ti pushes performance even further, averaging 41% higher than the RTX 4070.
NVIDIA GeForce RTX 5070 Founders Power Efficiency Results
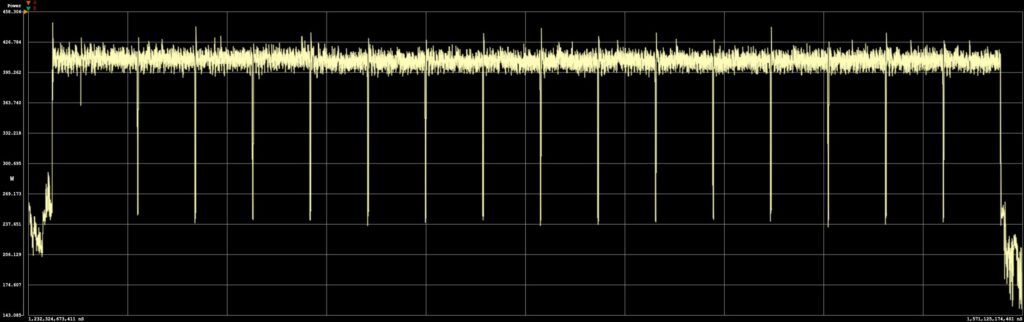
We’ve been using the Procyon AI Image test as a benchmark to measure the power consumption of all the new 50-series NVIDIA GPUs. Running the Stable Diffusion XL FP16 test, we look at the interval 2nd to last image being generated. We measure the time from the start to finish of that interval, peak power consumed, average high draw, and idle power after the test completes. Our testing showed an average consumption of 409W under sustained workloads, with peaks hitting 429W and idle draw at 184W. With the NVIDIA GeForce RTX 5070 having a listed power rating of 250W, the consumption was around 225W, with a peak of 245W. The card completed our 19.2-second test cycle with 2.46Wh of total energy use. This is a noticeable uptick over the 5070Ti and more than double what we measured from the GeForce RTX 5090.
| Stable Diffusion XL FP16 Image Power Used (lower is better) | NVIDIA RTX 5070 | ASUS Prime NVIDIA RTX 5070 Ti | NVIDIA RTX 5080 | NVIDIA RTX 5090 |
| Power Consumed | 2.46Wh | 1.66Wh | 1.39Wh | 1.16Wh |
| Test Duration | 19.2 s | 11.1 s | 8.7 s | 5.1 s |
Conclusion
The NVIDIA RTX 5070 FE hits a vital price point at $549, offering a blend of performance and next-gen features without veering into high-end pricing. For those coming from a 30- or 20-series GPU, this card represents a clear upgrade—higher frame rates, improved memory bandwidth, and AI-powered features like DLSS 4’s Multi Frame Generation contribute to a smoother, more responsive experience. If you’re on a 40-series GPU, the 5070 still delivers meaningful improvements, particularly in rendering and AI workloads.
In our testing, the RTX 5070 consistently outperformed the 4070 by 10–15% in AI-driven applications, with even bigger jumps in rendering and compute-heavy tasks. V-Ray, for example, saw a performance boost of over 40%, significantly reducing render times for complex ray-traced scenes. These gains highlight NVIDIA’s Blackwell advancements, including enhanced tensor and RT cores and the switch to GDDR7 memory, which allows for better handling of high-resolution textures and demanding creative workloads. While 12GB of VRAM leaves a bit to be desired, it’s more than enough for many gaming and AI tasks, especially smaller local models.
Ultimately, the RTX 5070 FE feels like a balanced option that makes next-gen features accessible at a reasonable price. NVIDIA has left room for those who need more power with the 5070 Ti and 5080, but for most users, the 5070 strikes an outstanding balance between cost and performance. The real test, however, will be availability. If NVIDIA keeps stock levels stable, this could finally be the midrange card that delivers both performance and accessibility without the supply headaches of previous generations.
Engage with StorageReview
Newsletter | YouTube | Podcast iTunes/Spotify | Instagram | Twitter | TikTok | RSS Feed