The NVIDIA GeForce RTX 5090, which will launch on January 30, 2025, with an MSRP of $1,999, will redefine high-performance gaming and AI workloads. Built on the Blackwell architecture, this flagship GPU pushes the boundaries of computational power with 32GB of GDDR7 memory, a 512-bit memory bus, and a massive increase in CUDA, Tensor, and RT core performance. Critically, NVIDIA has several AI claims for the 50-Series platform, which this review aims to explore.
At the heart of the RTX 5090’s advancements is DLSS 4 with Multi Frame Generation, leveraging AI to generate up to three additional frames per rendered frame, delivering up to 8X performance gains in supported titles. The new Transformer-based AI model enhances Ray Reconstruction, Super Resolution, and DLAA, dramatically improving visual fidelity while reducing latency through NVIDIA Reflex 2.
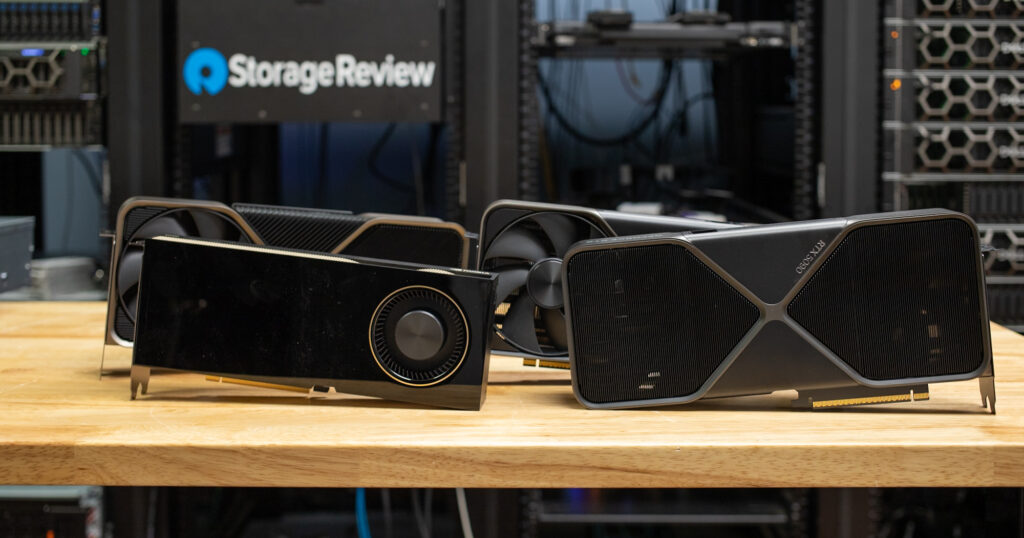
Beyond the obvious gaming benefits, the RTX 5090 is pitched as an AI powerhouse, accelerating generative AI workflows with native FP4 precision and cutting model memory requirements in half compared to previous FP16 implementations. We recently looked at the RTX 4090 vs. the RTX 6000 Ada to see if a gaming-centric card could hold up against a productivity powerhouse for workstation-based AI workloads. The results generally show the dominance of the 6000 Ada, but for those on a budget, the 4090 did surprisingly well. The new RTX 5090 aims to further blur the line between the gaming and productivity GPUs with several embedded AI enhancements.
NVIDIA GeForce RTX 5090 Blackwell Architecture & Hardware Innovations
The RTX 5090’s heart contains 21,760 CUDA cores, a 33% increase over the RTX 4090’s 16,384 cores. This massive core count, combined with the 5th-generation Tensor Cores and 4th-generation RT Cores, aims to deliver unparalleled performance in gaming, compute-intensive workloads, and AI acceleration.
The 680 Tensor Cores, up from 512 in the RTX 4090, provide even faster matrix operations, enabling more efficient AI inference. Meanwhile, the 170 RT Cores, a 33% increase from the RTX 4090’s 128, enhance ray tracing performance, allowing for even more realistic lighting, shadows, and reflections in games and professional rendering tasks. These upgrades translate to a staggering 104.8 TFLOPS of FP16 performance, a 27% improvement over the RTX 4090’s 82.58 TFLOPS.
The RTX 5090 also introduces 32GB of GDDR7 memory, a significant upgrade in bandwidth and capacity compared to RTX 4090’s 24GB of GDDR6X. The 5090 runs on a 512-bit memory bus and achieves an astounding memory bandwidth of 1.79 TB/s, nearly double the 1.01 TB/s of the RTX 4090. This massive bandwidth increase is particularly impactful for AI workloads, where inference requires rapid access to model weights. Faster memory enables smoother handling of complex AI models, reducing latency during inference. Additionally, the increased bandwidth accelerates GPU Direct Storage, allowing for use cases like loading massive model weights directly from fast storage devices sequentially. This will enable running even the largest AI models without requiring them to be fully loaded into memory.
NVIDIA GeForce RTX 50-Series Specifications
The Nvidia RTX 5090 represents a significant upgrade over the RTX 4090 in nearly every aspect. Below is a detailed comparison of the two GPUs:
| GPU Comparison | NVIDIA RTX 5090 | NVIDIA RTX 4090 | NVIDIA RTX 5080 | NVIDIA RTX 5070 |
| GPU Name | GB202 | AD102 | GB203 | GB205 |
| Architecture | Blackwell 2.0 | Ada Lovelace | Blackwell 2.0 | Blackwell 2.0 |
| Process Size | 4 nm | 5 nm | 4 nm | 4 nm |
| Transistors | 92,200 million | 76,300 million | 45,600 million | 31,000 million |
| Density | 123.9M / mm² | 125.3M / mm² | 120.6M / mm² | 117.9M / mm² |
| Die Size | 744 mm² | 609 mm² | 378 mm² | 263 mm² |
| Slot Width | Dual-slot | Triple-slot | Dual-slot | Dual-slot |
| Dimensions | 304 mm x 137 mm x 48 mm | 304 mm x 137 mm x 61 mm | 304 mm x 137 mm x 48 mm | N/A |
| TDP | 575 W | 450 W | 360 W | 250 W |
| Outputs | 1x HDMI 2.1b,3x DisplayPort 2.1b | 1x HDMI 2.1, 3x DisplayPort 1.4a | 1x HDMI 2.1b, 3x DisplayPort 2.1b | 1x HDMI 2.1b, 3x DisplayPort 2.1a |
| Power Connectors | 1x 16-pin | 1x 16-pin | 1x 16-pin | 1x 16-pin |
| Bus Interface | PCIe 5.0 x16 | PCIe 4.0 x16 | PCIe 5.0 x16 | PCIe 5.0 x16 |
| Base Clock | 2017 MHz | 2235 MHz | 2295 MHz | 2165 MHz |
| Boost Clock | 2407 MHz | 2520 MHz | 2617 MHz | 2510 MHz |
| Memory Clock | 2209 MHz (28 Gbps effective) | 1313 MHz (21 Gbps effective) | 2366 MHz (30 Gbps effective) | 2209 MHz (28 Gbps effective) |
| Memory Size | 32 GB | 24 GB | 16 GB | 12 GB |
| Memory Type | GDDR7 | GDDR6X | GDDR7 | GDDR7 |
| Memory Bus | 512 bit | 384 bit | 256 bit | 192 bit |
| Memory Bandwidth | 1.79 TB/s | 1.01 TB/s | 960.0 GB/s | 672.2 GB/s |
| CUDA Cores | 21,760 | 16,384 | 10,752 | 6,144 |
| Tensor Cores | 680 | 512 | 336 | 192 |
| ROPs | 192 | 176 | 128 | 64 |
| SM Count | 170 | 128 | 84 | 48 |
| Tensor Cores | 680 | 512 | 336 | 192 |
| RT Cores | 170 | 128 | 84 | 48 |
| L1 Cache | 128 KB (per SM) | 128 KB (per SM) | 128 KB (per SM) | 128 KB (per SM) |
| L2 Cache | 88 MB | 72 MB | 64 MB | 40 MB |
| Pixel Rate | 462.1 GPixel/s | 443.5 GPixel/s | 335.0 GPixel/s | 160.6 GPixel/s |
| Texture Rate | 1,637 GTexel/s | 1,290 GTexel/s | 879.3 GTexel/s | 481.9 GTexel/s |
| FP16 (half) | 104.8 TFLOPS (1:1) | 82.58 TFLOPS (1:1) | 56.28 TFLOPS (1:1) | 30.84 TFLOPS (1:1) |
| FP32 (float) | 104.8 TFLOPS | 82.58 TFLOPS | 56.28 TFLOPS | 30.84 TFLOPS |
| FP64 (double) | 1.637 TFLOPS (1:64) | 1,290 GFLOPS (1:64) | 879.3 GFLOPS (1:64) | 481.9 GFLOPS (1:64) |
| Launch Price (USD) | $1,999 | $1,599 | $999 | $549 |
NVIDIA GeForce RTX 5090 Build and Design
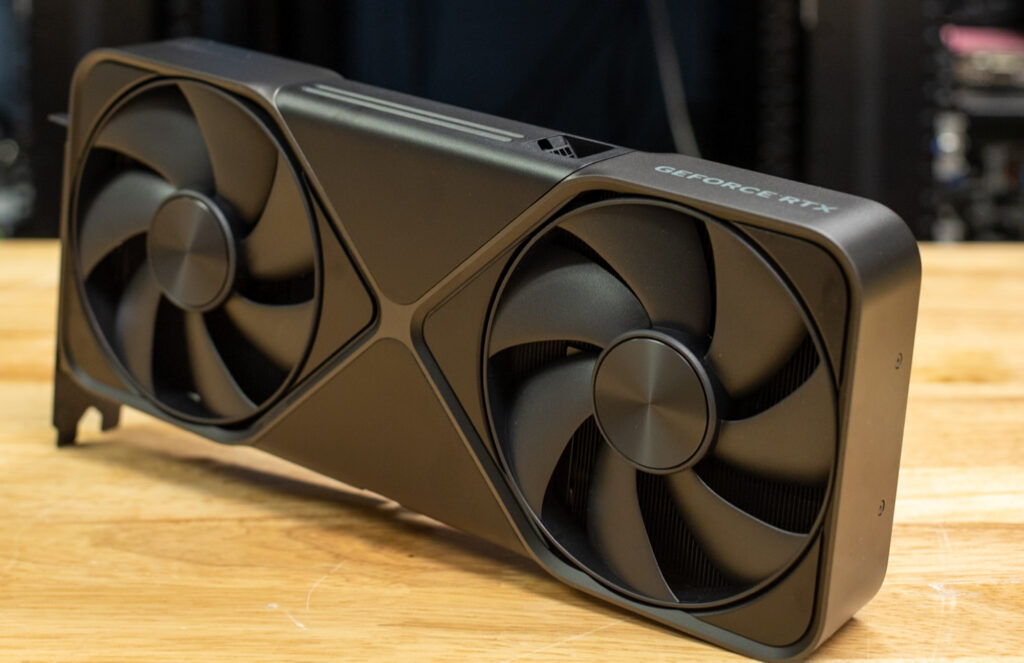
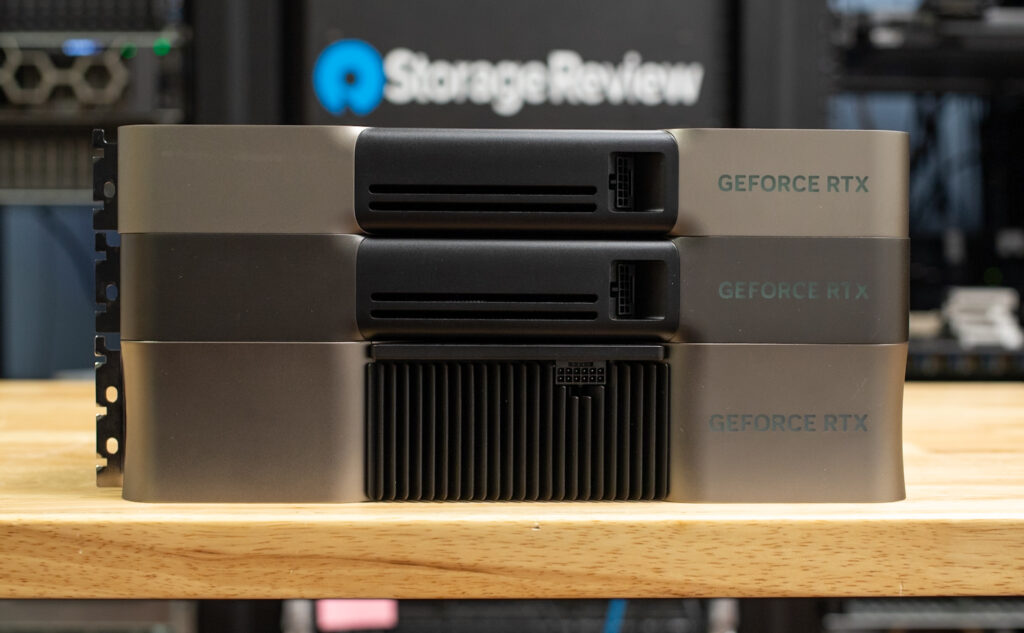
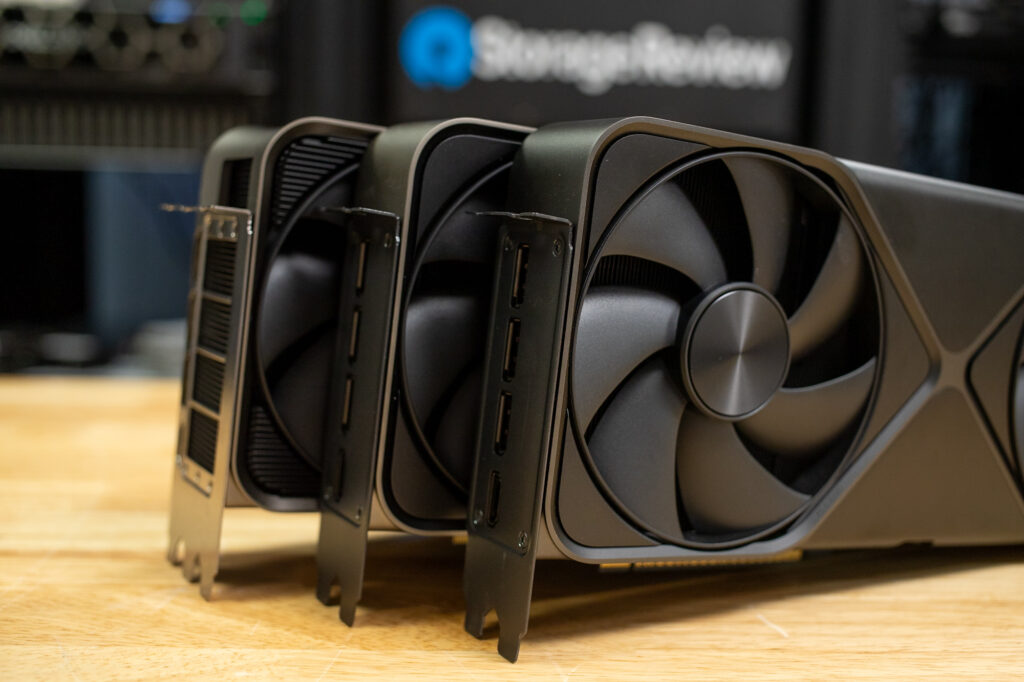
The RTX 5090 Founders Edition maintains Nvidia’s sleek industrial design language with subtle refinements. Measuring 304mm in length and 137mm in width, the card fits into a standard 2-slot configuration, making it surprisingly compact for its power.
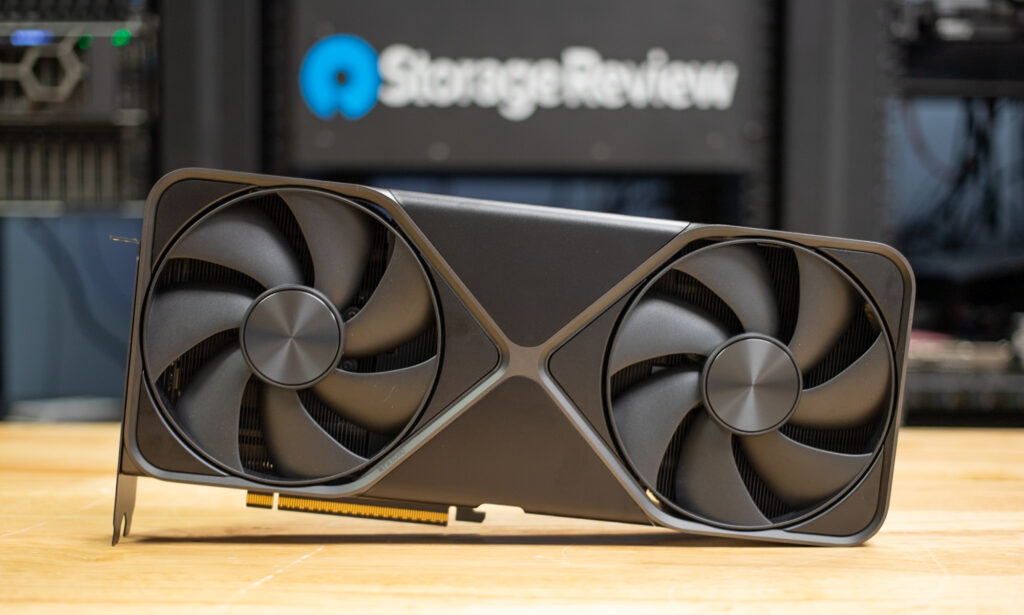
Nvidia has introduced a dual flow-through design for the RTX 5090, which improves cooling efficiency and airflow. The card features what Nvidia calls a 3D vapor chamber, paired with dual axial fans to keep temperatures in check, even under heavy workloads. While it’s difficult to see without holding it in your hand, you can see the light through both heatsink sections behind each fan.
The central part of the card has the circuit board, with small tubes carrying the wires to each video output. This dramatically increases the performance of the cooling capabilities of the RTX 5090, allowing it to maintain a similar profile to the RTX 4090, even while consuming significantly more power.
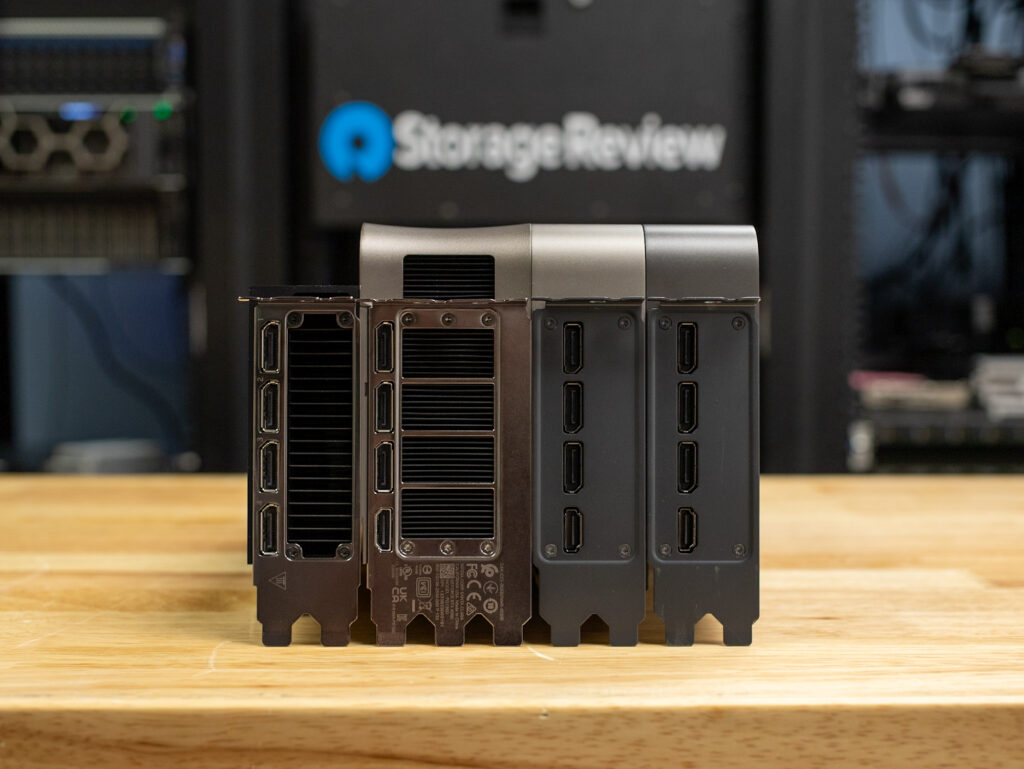
One of the standout features of the RTX 5090 is the inclusion of a liquid metal thermal compound applied straight from the factory. This ensures better thermal conductivity than traditional thermal paste, allowing the GPU to maintain lower temperatures and higher sustained performance.

Despite its increased max power draw of 575W, the RTX 5090 retains a compact dual-slot form factor, making it more accessible for high-end PC builds than the bulkier triple-slot RTX 4090.
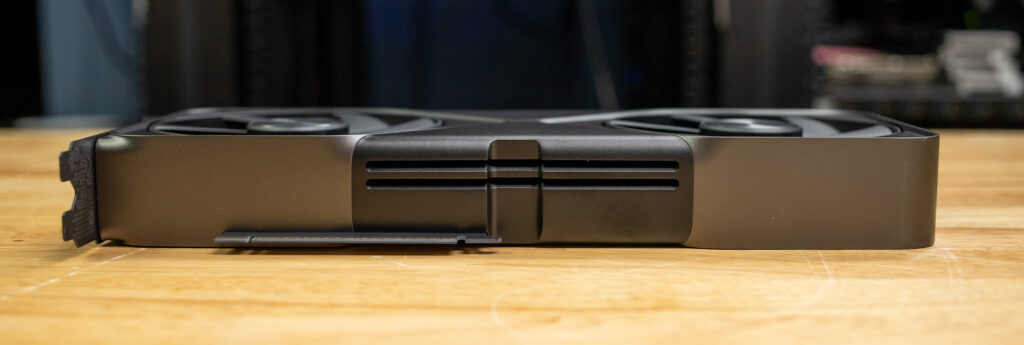
The card also supports PCIe Gen 5, which offers higher bandwidth for next-generation motherboards and peripherals. Thus, it’s ready for the future of gaming and content creation.
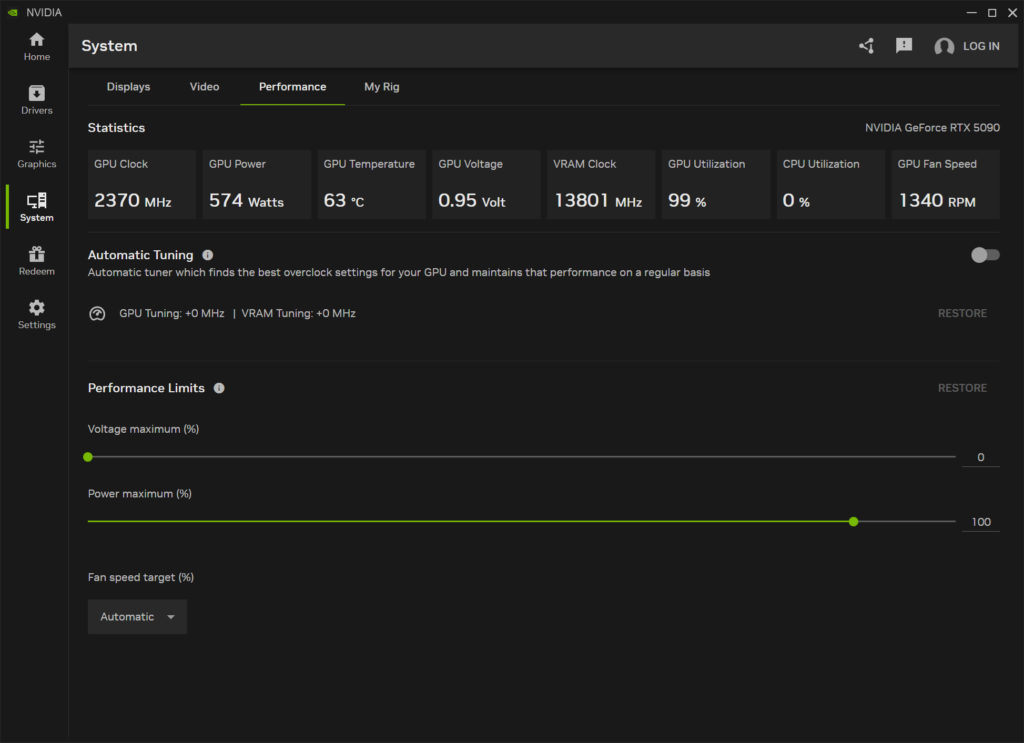
Age of AI Gaming
The RTX 5090 isn’t just about raw power. It’s about redefining gaming with AI. Nvidia has taken its AI-driven features to the next level, making this generation a game-changer for performance and visual fidelity.
DLSS 4: Multi-Frame Generation
DLSS (Deep Learning Super Sampling) has been a cornerstone of Nvidia’s GPUs for years, but the RTX 5090 introduces DLSS 4—which takes things to a whole new level. While previous versions of DLSS could generate one AI frame for every traditionally rendered frame, DLSS 4 can now generate up to three AI frames per rendered frame.

This results in an incredibly smooth gaming experience, even with all the settings maxed on the most demanding games. When paired with Reflex 2, Nvidia’s latency-reduction technology, games look better and feel more responsive than ever.
Ray Reconstruction
Ray tracing has always been a demanding feature, but the RTX 5090’s AI-powered Ray Reconstruction changes the game. By replacing traditional denoisers with an AI-trained network, Nvidia has significantly improved the quality of ray-traced reflections, shadows, and lighting.
This feature enhances image quality by generating additional pixels for ray-traced scenes, making them look more realistic and immersive. It’s a significant step forward for ray tracing, especially in demanding titles.
AV1 Encoding and Decoding
For content creators, the RTX 5090 includes 3x 9th Gen NVENC encoders and 2x 6th Gen NVDEC decoders, with full AV1 compatibility. This ensures faster, more efficient video encoding and decoding, making it an excellent choice for streamers and video editors.
NVIDIA GeForce RTX 5090 Review – Performance Benchmarks
To fully take advantage of the benefits of the new NVIDIA GeForce RTX 5090, we leveraged our AMD ThreadRipper platform. This system, as configured, offers a 64-core CPU and a water cooling loop. It has plenty of underlying CPU horsepower to let the GPU do its work without being held back. The complete configuration of the system is listed below.
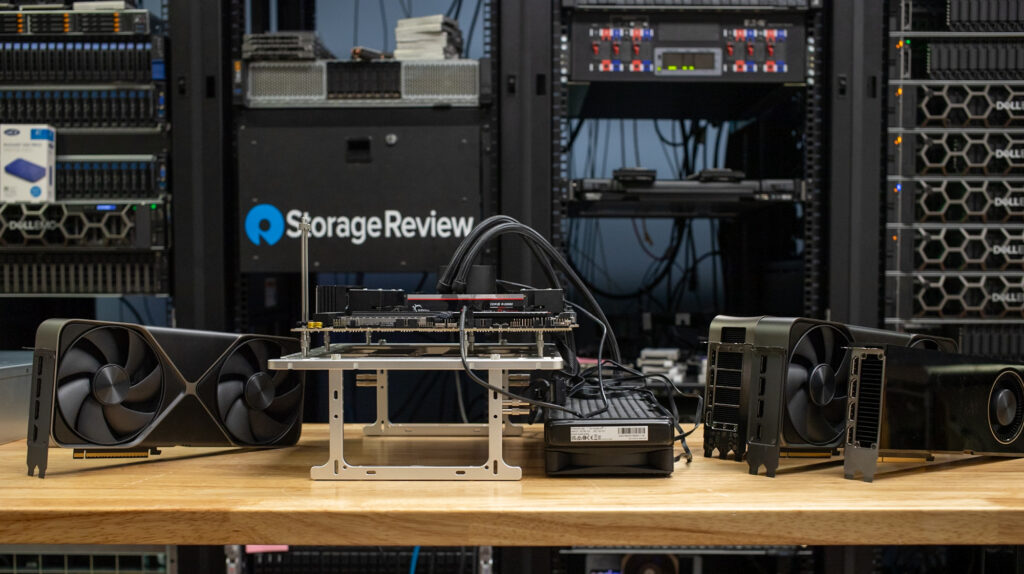
StorageReview AMD ThreadRipper Test Platform
- Motherboard: ASUS Pro WS TRX50-SAGE WIFI
- CPU: AMD Ryzen Threadripper 7980X 64-Core
- RAM: 32GB DDR5 4800MT/s
- Storage: 2TB Samsung 980 Pro
- OS: Windows 11 Pro for Workstations
- Driver: NVIDIA 571.86 GameReady Driver
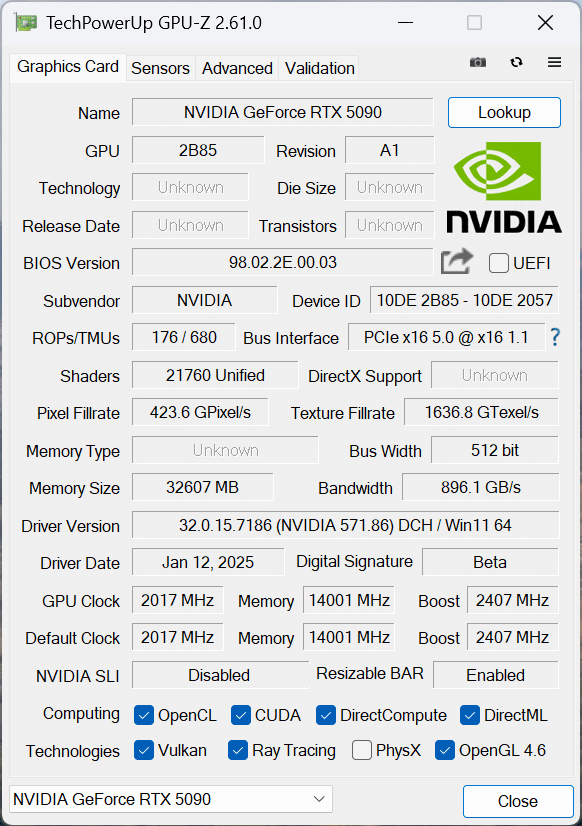
At the time of this review, we used the early-release NVIDIA 571.86 GameReady drivers for the GPUs we tested. However, it’s important to note that not all applications fully support the new Blackwell architecture. Many of the tests we used were updated, and many are still being updated. Therefore, we will continue to explore older tests as they become optimized for use with NVIDIA’s new 50-series GPUs.
UL Procyon: AI Text Generation
The Procyon AI Text Generation Benchmark Benchmark simplifies AI LLM performance testing by offering a compact and consistent evaluation method. It allows for repeated testing across multiple LLM models while minimizing the complexity of large model sizes and variable factors. Developed with AI hardware leaders, it optimizes the use of local AI accelerators for more reliable and efficient performance assessments. The results measured below were tested using TensorRT.
In the Procyon® AI Text Generation Benchmark, the Nvidia RTX 5090 leads with the highest overall scores and fastest performance across all tested models:
- Phi: 5,749 RTX 5090, outperforming the RTX 4090 4,958 and RTX 6000 Ada 4,508.
- Mistral: 6,267 RTX 5090, followed by the RTX 4090 5,094 and RTX 6000 Ada 4,255.
- Llama3: 6,104 RTX 5090, with the RTX 4090 at 4,849 and RTX 6000 Ada at 4,026.
- Llama2: 6,591 RTX 5090, ahead of the RTX 4090 5,013 and RTX 6000 Ada 3,957.
In terms of overall duration, the RTX 5090 also outperforms the other GPUs:
- Phi: 10.280 s RTX 5090, faster than the RTX 4090 12.872 s and RTX 6000 Ada 13.869 s.
- Mistral: 12.593 s RTX 5090, with the RTX 4090 at 17.010 s and RTX 6000 Ada at 19.092 s.
- Llama3: 14.304 s RTX 5090, ahead of the RTX 4090 19.991 s and RTX 6000 Ada 22.062 s.
- Llama2: 23.018 s RTX 5090, faster than the RTX 4090 32.448 s and RTX 6000 Ada 38.923 s.
The RTX 5090 consistently delivers superior overall performance and faster processing times in every category in this test.
| UL Procyon: AI Text Generation | NVIDIA RTX 5090 | NVIDIA RTX 4090 | NVIDIA RTX 6000 Ada |
| Phi Overall Score | 5,749 | 4,958 | 4,508 |
| Phi Output Time To First Token | 0.244 s | 0.255 s | 0.288 s |
| Phi Output Tokens Per Second | 314.435 tokens/s | 244.343 tokens/s | 228.359 tokens/s |
| Phi Overall Duration | 10.280 s | 12.872 s | 13.869 s |
| Mistral Overall Score | 6,267 | 5,094 | 4,255 |
| Mistral Output Time To First Token | 0.297 s | 0.322 s | 0.419 s |
| Mistral Output Tokens Per Second | 255.945 tokens/s | 183.266 tokens/s | 166.633 tokens/s |
| Mistral Overall Duration | 12.593 s | 17.010 s | 19.092 s |
| Llama3 Overall Score | 6,104 | 4,849 | 4,026 |
| Llama3 Output Time To First Token | 0.234 s | 0.259 s | 0.348 s |
| Llama3 Output Tokens Per Second | 214.285 tokens/s | 150.039 tokens/s | 138.620 tokens/s |
| Llama3 Overall Duration | 14.304 s | 19.991 s | 22.062 s |
| Llama2 Overall Score | 6,591 | 5,013 | 3,957 |
| Llama2 Output Time To First Token | 0.419 s | 0.500 s | 0.679 s |
| Llama2 Output Tokens Per Second | 134.502 tokens/s | 92.853 tokens/s | 78.532 tokens/s |
| Llama2 Overall Duration | 23.018 s | 32.448 s | 38.923 s |
UL Procyon: AI Image Generation
The Procyon AI Image Generation Benchmark offers a consistent, accurate way to measure AI inference performance across various hardware, from low-power NPUs to high-end GPUs. It includes three tests: Stable Diffusion XL (FP16) for high-end GPUs, Stable Diffusion 1.5 (FP16) for moderately powerful GPUs, and Stable Diffusion 1.5 (INT8) for low-power devices. The benchmark uses the optimal inference engine for each system, ensuring fair and comparable results.
In the Procyon AI Image Generation Benchmark, the Nvidia RTX 5090 outperforms the other GPUs across all tests:
- Stable Diffusion 1.5 (FP16): The RTX 5090 leads with an overall score of 8,193, a generation time of 12.204 s, and an image generation speed of 0.763 s/image.
- Stable Diffusion 1.5 (INT8): The RTX 5090 again leads with an overall score of 79,272, a generation time of 3.154 s, and an image generation speed of 0.394 s/image.
- Stable Diffusion XL (FP16): Finally, the RTX 5090 scores ahead once more with 7,179 overall, with a generation time of 83.573 s and an image generation speed of 5.223 s/image.
| UL Procyon: AI Image Generation | NVIDIA RTX 5090 | NVIDIA RTX 4090 | NVIDIA RTX 6000 Ada |
| Stable Diffusion 1.5 (FP16) – Overall Score | 8,193 | 5,260 | 4,230 |
| Stable Diffusion 1.5 (FP16) – Overall Time | 12.204 s | 19.011 s | 23.639 s |
| Stable Diffusion 1.5 (FP16) – Image Generation Speed | 0.763 s/image | 1.188 s/image | 1.477 s/image |
| Stable Diffusion 1.5 (INT8) – Overall Score | 79,272 | 62,160 | 55,901 |
| Stable Diffusion 1.5 (INT8) – Overall Time | 3.154 s | 4.022 s | 4.472 s |
| Stable Diffusion 1.5 (INT8) – Image Generation Speed | 0.394 s/image | 0.503 s/image | 0.559 s/image |
| Stable Diffusion XL (FP16) – Overall Score | 7,179 | 5,025 | 3,043 |
| Stable Diffusion XL (FP16) – Overall Time | 83.573 s | 119.379 s | 197.172 s |
| Stable Diffusion XL (FP16) – Image Generation Speed | 5.223 s/image | 7.461 s/image | 12.323 s/image |
Luxmark
Luxmark is a GPU benchmark that uses LuxRender, an open-source ray tracing renderer, to evaluate a system’s performance in handling highly detailed 3D scenes. This benchmark is pertinent for assessing the graphical rendering prowess of servers and workstations, especially for visual effects and architectural visualization applications, where accurate light simulation is critical.
In the Luxmark OpenCL benchmark, the NVIDIA RTX 5090 leads with the highest scores for both Hall and Food GPU tests:
- Food Score: 23,141 RTX 5090, surpassing the RTX 4090 17,171 and RTX 6000 Ada 14,873.
- Hall Score: 51,725 RTX 5090, outperforming the RTX 4090 38,887 and RTX 6000 Ada 32,132.
| Luxmark (higher is better) | NVIDIA RTX 5090 | NVIDIA RTX 4090 | NVIDIA RTX 6000 Ada |
| Food Score | 23,141 | 17,171 | 14,873 |
| Hall Score | 51,725 | 38,887 | 32,132 |
Geekbench 6
Geekbench 6 is a cross-platform benchmark that measures overall system performance. The Geekbench Browser allows you to compare any system to it.
The NVIDIA RTX 5090 leads with a superior Geekbench GPU OpenCL score of 374,807. This score outperforms the RTX 6000 Ada’s 336,882 and the RTX 4090’s 333,384, establishing it as the top performer in this comparison.
| Geekbench (higher is better) | NVIDIA RTX 5090 | NVIDIA RTX 4090 | NVIDIA RTX 6000 Ada |
| GPU OpenCL Score | 374,807 | 333,384 | 336,882 |
V-Ray
The V-Ray Benchmark measures rendering performance for CPUs, NVIDIA GPUs, or both using advanced V-Ray 6 engines. It uses quick tests and a simple scoring system to let users evaluate and compare their systems’ rendering capabilities. It’s an essential tool for professionals seeking efficient performance insights.
In this test, the NVIDIA RTX 5090 takes the lead with an impressive score of 14,764, significantly outperforming the RTX 4090 10,847 and the RTX 6000 Ada 10,766. The RTX 5090 again clearly dominates in rendering performance.
| V-Ray (higher is better) | NVIDIA RTX 5090 | NVIDIA RTX 4090 | NVIDIA RTX 6000 Ada |
| vpaths | 14,764 | 10,847 | 10,766 |
NVIDIA GeForce RTX 5090 Power Consumption
Power consumption is a significant component of any high-end computing platform. Each new generation of GPU consumes more power under load, meaning larger power supplies and ample airflow for cooling. However, there is another aspect to power regarding performance: faster GPUs might spike higher, but the duration of each workload decreases.
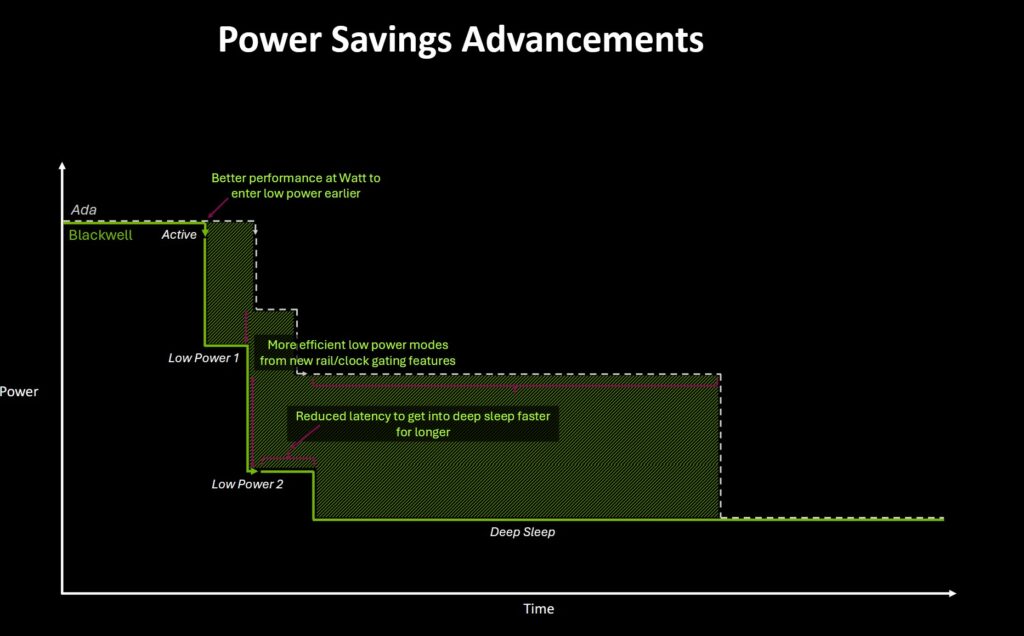
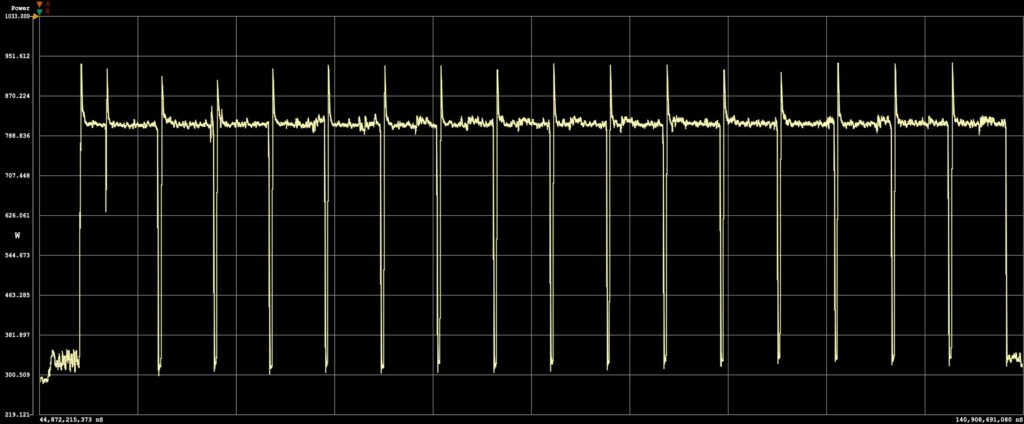
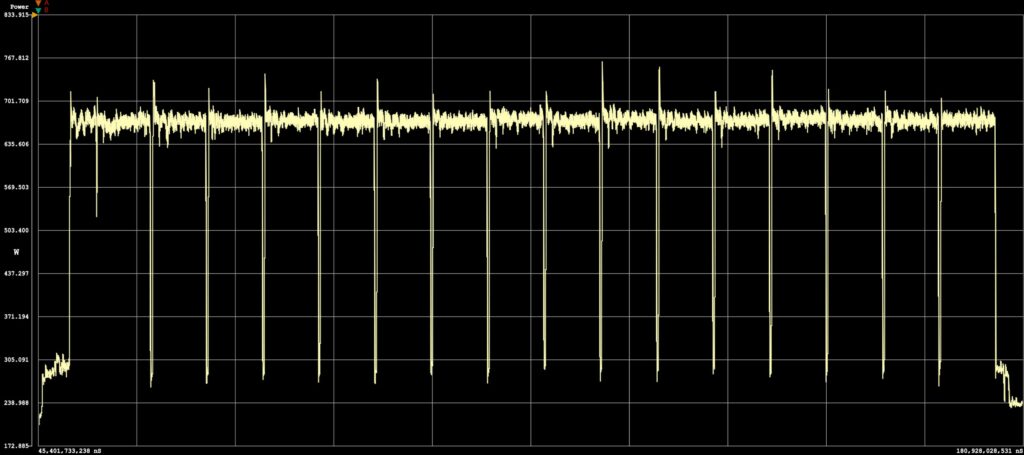
NVIDIA discussed the improved power efficiency of the Blackwell architecture during the Editor’s Day at CES 2025, which we wanted to see play out in an AI-driven workload. Leveraging the Quarch Mains Analyzer in our test lab, we measured the total system power consumed while running the Procyon AI Image Generator Stable Diffusion XL FP16 test. This workload pushed each GPU to its power limits, with defined start and stop points for each generated image being readily visible.
First, we look at the NVIDIA RTX 6000 Ada, which has a maximum power consumption of 300W. While running the Procyon AI image-generating test, we saw system power increase from a background load of 235W to 514W or a 279W increase under load. When looking at time per image, the second-to-last image saw a GPU load lasting 12.6 seconds. The total power consumed for that last image creation measured 1.76Wh.
Next, we look at the same test segment run with the NVIDIA GeForce RTX 4090, which has a max power consumption of 450W. With the test running the AI image generating test, the system increased from a floor of 233W up to an average of 669W, which worked out to a 436W increase under load. Looking at the 2nd to last image being created, the time under load measured 7.3 seconds. That works out to 1.35Wh for the total power consumed over that period.
Finally, we look at the new NVIDIA GeForce RTX 5090, which has the highest max power consumption of 600W. While this card is running the Procyon AI image-generating test, the system increased from a background power of 272W to 811W, working to 539W. The time to generate the second-to-last image was measured at just 5.1 seconds, and 1.16Wh was used over that period.
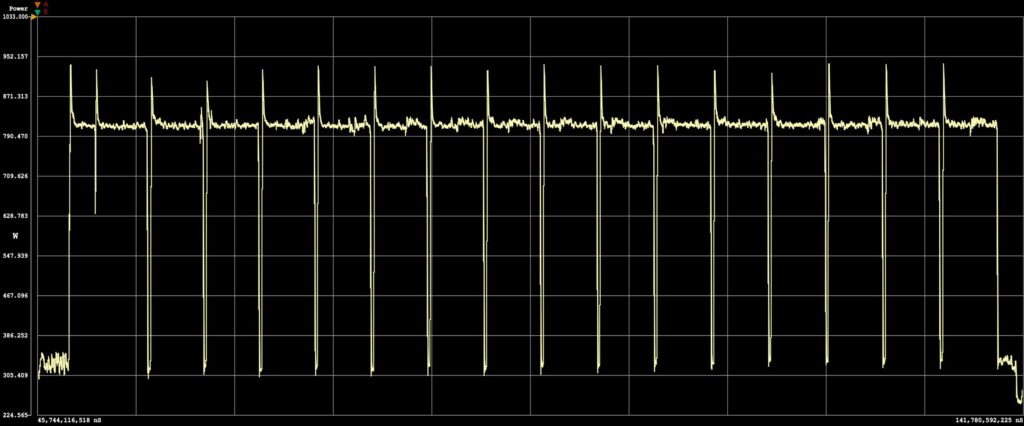
As we moved through all three of those NVIDIA GPUs, while the peak power drawn by each faster model did increase, the total energy consumed decreased. This is an essential factor when considering the purchase of new GPUs for workloads. Power consumption will increase, but the energy needed to complete specific workloads decreases.
Conclusion
This review provides a very early look at the NVIDIA GeForce RTX 5090’s overall capabilities. Not all software is optimized for the new architecture, and Linux drivers for more AI-centric workloads will not be available until the card is up for general sale at the end of January.
We saw massive performance gains in all the workloads that could take advantage of the new RTX 5090. Some applications will need updates, as we saw situations ranging from incompatibility to operations running slower than expected. Where we get excited is seeing just how much performance potential this card has to offer. Compared to the RTX 4090 across Procyon AI text and image generation workloads, the RTX 5090 offered 16% and 56% gains, respectively. In V-Ray measuring rendering performance, the performance of the RTX 5090 increased 36% over its predecessor. None of the GPU-accelerated workloads we are seeing are scaling back. Things are getting more intense. When you introduce the concept of AI Assistants, users won’t just be gaming or working; you’ll have an AI workload running in parallel. That will require additional GPU resources alongside another intensive task.
That brings us to the topic of price and value. The GeForce RTX 4090 came at an initial pricepoint of $1,599, while the new GeForce RTX 5090 bumps the starting price to $1,999, a 25% increase for the top-end offering. Is that worth it for many? Yes. For users who frequently push their GPUs to peak saturation, a faster GPU allows you to do more things. If your workload can run in less time and you can be more productive, that cost spread out over the years of your PC can be well worth it. Will everyone need the top model? Probably not. There will be a wide range of models, including the RTX 5070 at a price of $549, with the RTX 5060 to be priced even lower.
Power consumption is another thing to remember with this next-generation card. The GeForce RTX 4090 was power-hungry at 450W, and the RTX 5090 takes that up a notch to a whopping 575W. This will create new challenges for PC and workstation chassis design, as it must accommodate additional cooling needs and larger power supplies.
Overall, the new NVIDIA GeForce RTX 5090 has us thoroughly impressed and eager to see how far performance increases will go as application support gets more widespread. Like the RTX 3090 and A6000, or RTX 4090 and 6000 Ada did before it, the GeForce RTX 5090 points to where the next workstation model will be going and we can’t wait.


 Amazon