QSAN Technology Inc. has launched its next-generation Hybrid Flash Storage 3300 series, optimized in price and performance for SMB workloads. In our lab is the QSAN XCubeSAN XS3312D, a 2U, dual-controller SAN designed to meet the needs of small and medium businesses, remote or edge locations, and anywhere else where a blend of performance and cost-effectiveness is required. The rest of the family includes 2U 2 6 bay, 3U 16 bay, and 4U 24 bay models. All support the ability to add up to 20 additional JBODs.
QSAN Technology Inc. has launched its next-generation Hybrid Flash Storage 3300 series, optimized in price and performance for SMB workloads. In our lab is the QSAN XCubeSAN XS3312D, a 2U, dual-controller SAN designed to meet the needs of small and medium businesses, remote or edge locations, and anywhere else where a blend of performance and cost-effectiveness is required. The rest of the family includes 2U 2 6 bay, 3U 16 bay, and 4U 24 bay models. All support the ability to add up to 20 additional JBODs.
QSAN XCubeSAN XS3312D Hardware Overview
The next-gen QSAN XCubeSAN XS3312D is an entry-level block storage array designed to meet the performance, simplicity, and affordability required by modern workloads, with pay-as-you-grow flexibility. This solution can be an excellent choice for virtualization, media editing, large-scale surveillance, and backup applications.
The architecture is based on the Intel Xeon 64-bit, 4-core processor and can be configured as a single controller (XS3312S) or a dual active-active controller configuration (XS3312D). The XCubeSAN ships with a base memory configuration of 16GB DDR4 ECC DIMM, which can be upgraded to 256GB for a single controller or 512GB for the dual controller configuration (256GB per controller). We tested the dual active-active controller configuration.
The QSAN XS3312D can grow to 492 drive bays with XCubeDAS or third-party expansions and includes support for SAS, NL-SAS, and SED drives connected via SAS 3.0 12Gb/s interface. The single-controller configuration can also accommodate the SATA 6Gb/s interface. All drives are hot-swappable.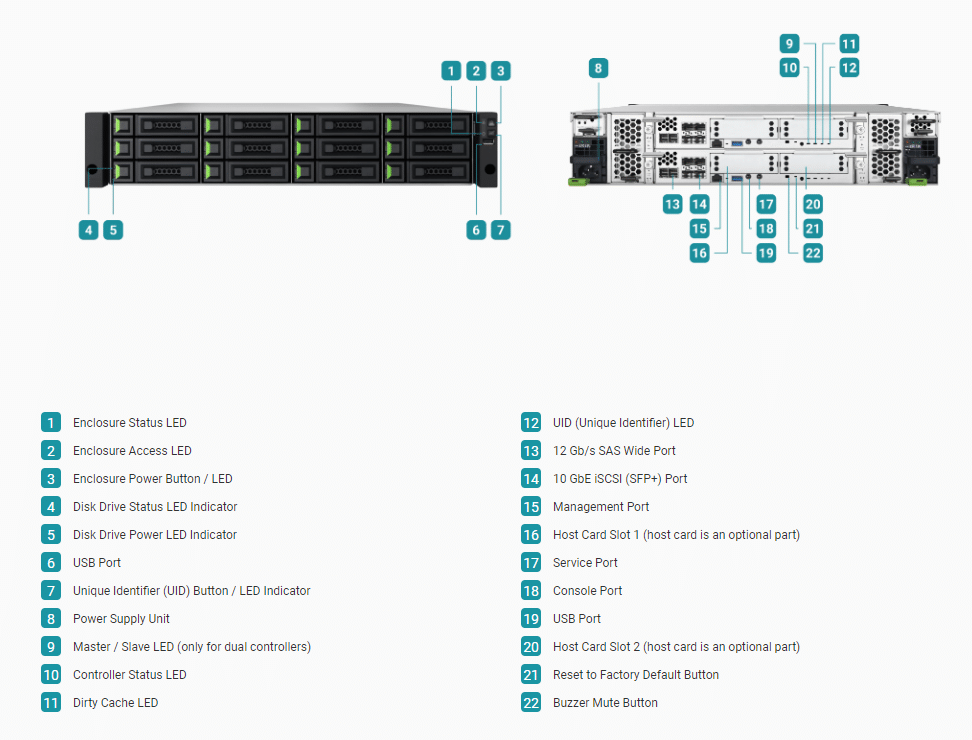
What we Tested
We tested the QSAN XCubeSAN XS3312D, a 12-drive, dual-controller active-active unit. The XCubeSAN series is a high-availability SAN storage system with full redundancy in modular design. It has a dual-active architecture, automatic failover/failback mechanism, and cache-to-flash technology. Don’t let the size fool you. The XCubeSAN can expand to 492 drive bays using XCubeDAS or third-party expansion units.
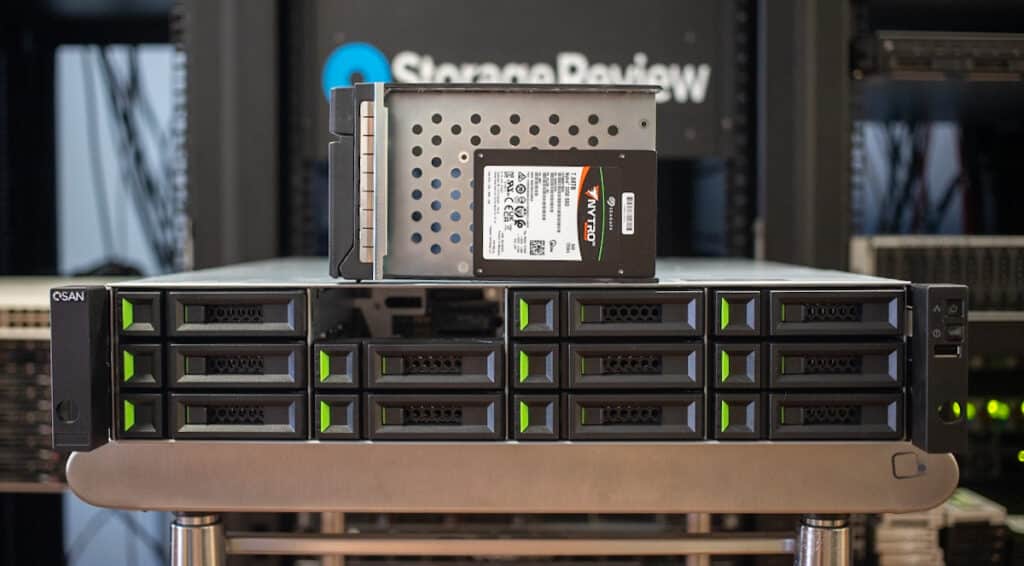
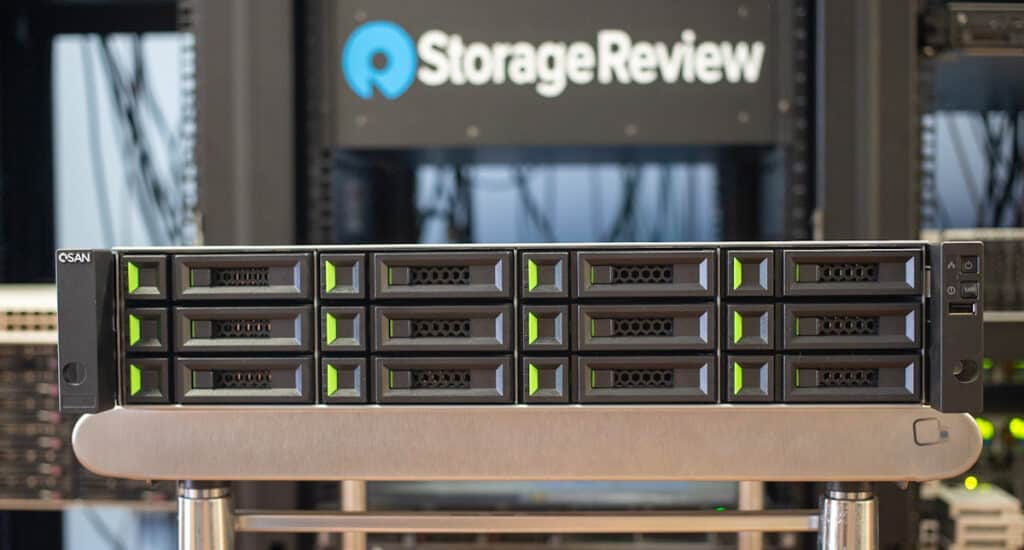 QSAN XCubeSAN XS3312D – Front View
QSAN has developed an impressive interactive management console that displays configuration details, status, alerts, and more. The QSAN XEVO is a flash-based storage management system with an intuitive GUI, and data is available within five minutes following installation. XEVOs core technology provides the flexibility and intelligence needed to simplify all content for a hybrid storage system.
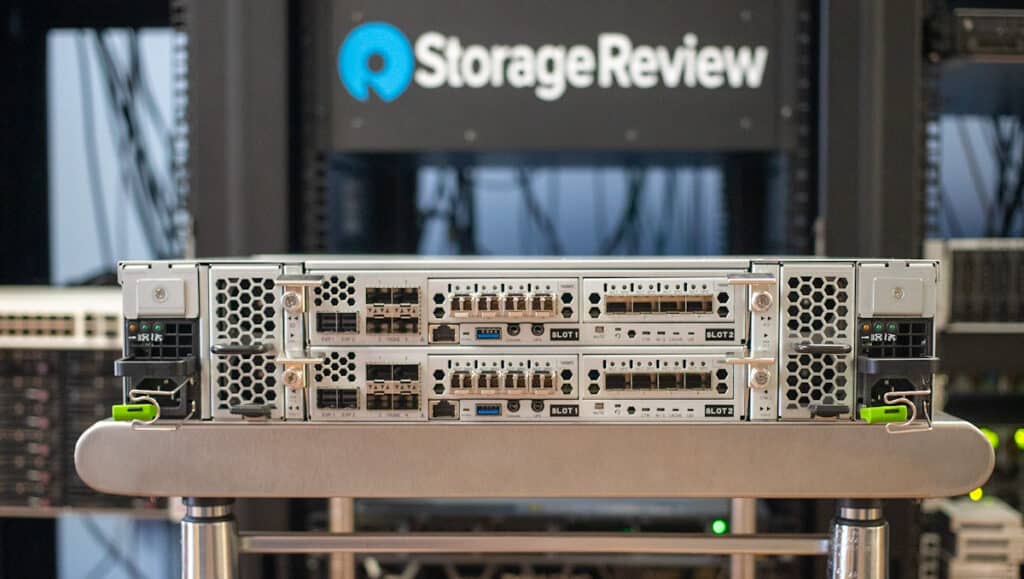 QSAN XCubeSAN XS3312D – Rear View
XS3312D Capabilities At-A-Glance
The QSAN XCubeSAN XS3312D provides many of the capabilities found in enterprise-class SAN arrays. Some of the key functional capabilities include:
- QSLife – for monitoring and analysis of SSD activity to alert for drive health issues
- QReport – for business usage analysis to identify areas for improvement
- Quality of Service – for management of QoS to balance the workload priorities
- QAuth – to configure and manage SED & ISE
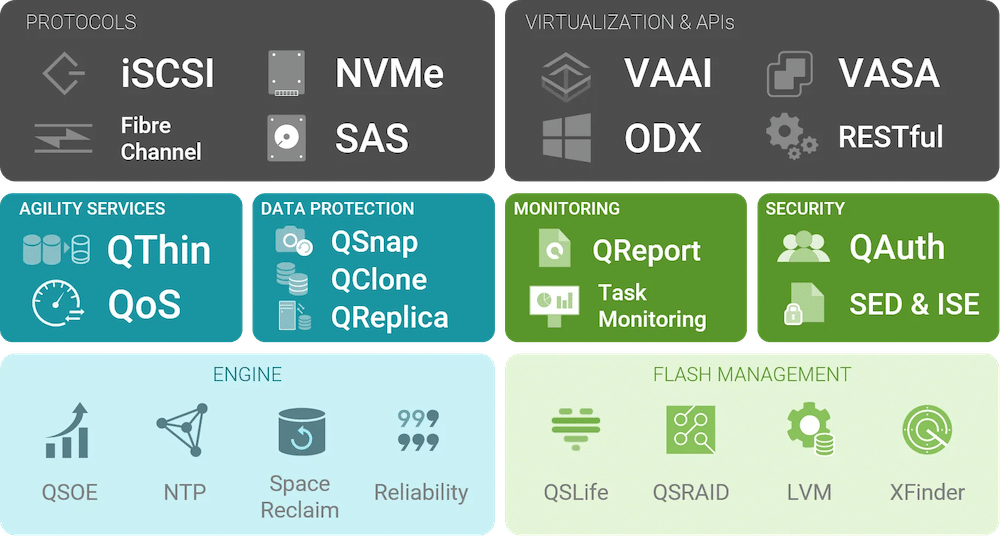
The QSAN XCubeSAN XS3312D delivers excellent performance with 12.8 GB/s and 1.3M IOPS and a scale-up capacity of up to 10.8PB of storage. The design delivers the high reliability of enterprise-class systems and 99.999 percent availability with no single point of failure. The versatile connectivity capability includes 12 host ports (allowing it to be connected to multiple hosts without requiring a separate switch) and the option to utilize 25GbE iSCSI and 32Gb FC host cards.
The QSAN XCubeSAN XS3312D provides flexible connectivity options that can meet virtually any host connection needs, including:
- PCIe Expansion (Gen3x8 Slot) x 2
- 1GbE RJ45 LAN port – 1 per controller for onboard management
- 10GbE SFP+ LAN port – 4 iSCSI per controller onboard, and optional for 4 iSCSI additional
- 10GbE RJ45 LAN port – 2 iSCSI optional
- 25GbE SFP28 LAN port – 2 iSCSI optional
- 16Gb SFP+ Fibre Channel – 2 / 4 optional
- 32Gb SFP28 Fibre Channel – 2 optional
- 12Gb/s SAS Wide port – 2 onboard per controller for expansion
- USB port – 1 front / 2 rear
- 1 Console port
- 1 Service Port (UPS)
For storage configuration, the QSAN XCubeSAN XS3312D allows businesses to structure and use disk drives in various ways, providing enterprise-class features expected in SAN environments including:
- RAID: 0, 1, 5, 6, 10, 50, 60, 5EE, 6EE, 50EE, 60EE, N-way Mirror
- Thin provisioning
- SSD Cache and auto-tiering options
- Snapshot and local volume cloning
- Replication: Asynchronous and optional Synchronous
The XS3312D supports SED (Self-Encrypting Drives) to protect data in the event drives are lost, stolen, or misplaced. RBAC (Role-Based Access Control) prevents unauthorized access to data.
QSAN Management
Before diving into the results of our performance testing, let’s look at the graphical interface, QSAN XEVO. This interface is used for managing and monitoring the array, and providing a GUI-based storage management interface that simplifies implementation, configuration, and maintenance.
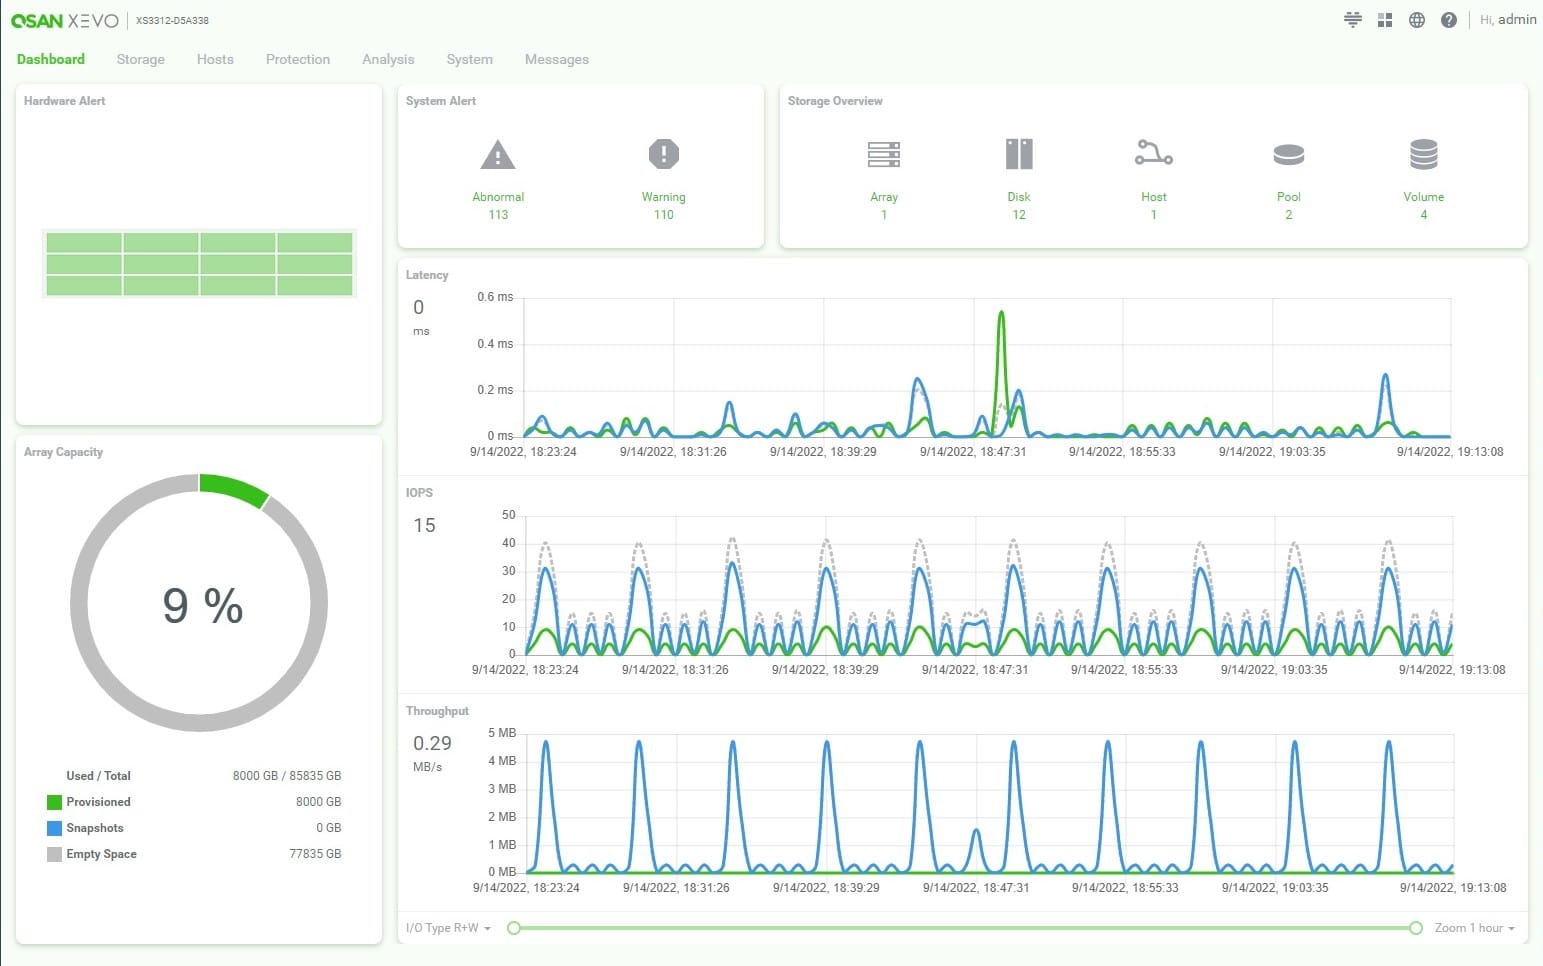
The dashboard in XEVO presents an excellent overall view of the status of the storage infrastructure while allowing quick access to tools to view more details when needed.
The performance graphs provide a graphical view of the activity and performance of the array. And if there’s anything amiss, the color of the relevant items will change from green to yellow or red.
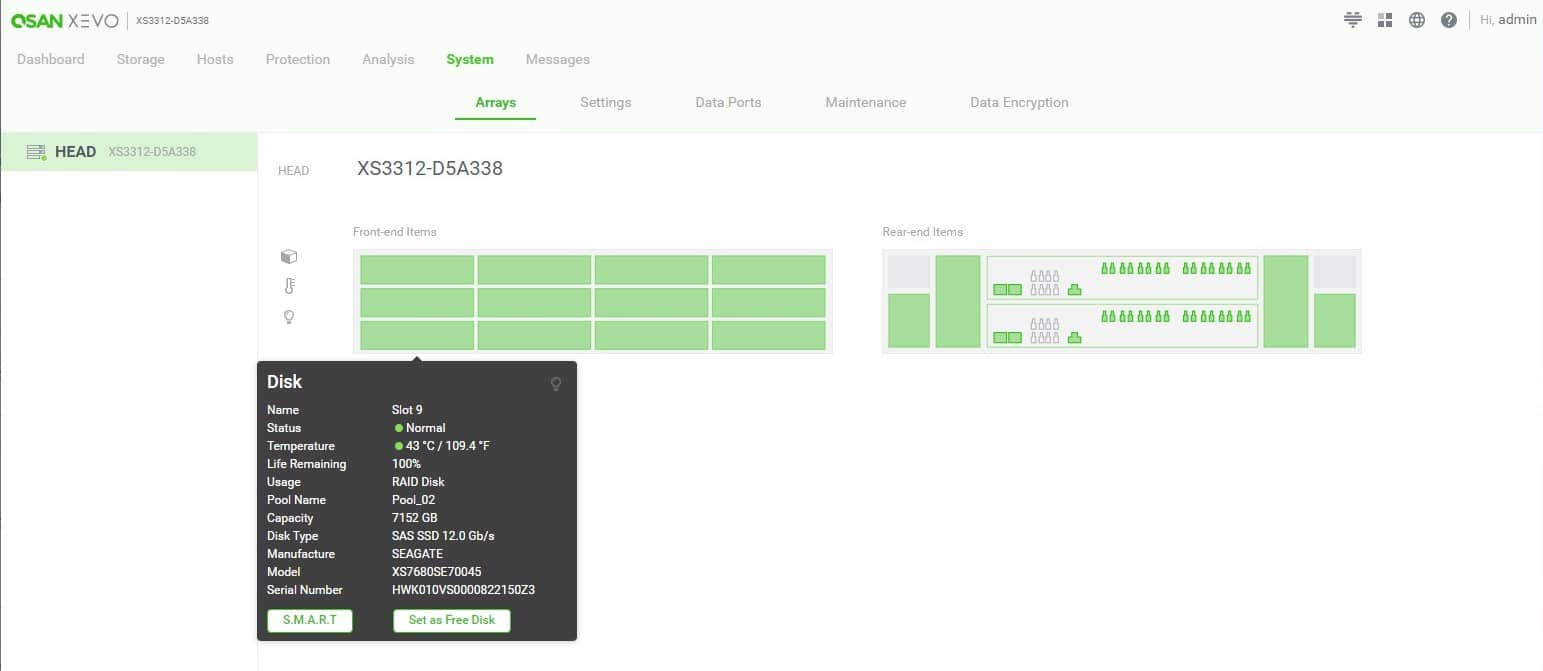
In the Storage Overview section, the Array and Disk objects display the number of devices in these categories, and clicking on either of these or the System menu link at the top left will bring up the System view.
QSAN XEVO Array and Disk Configuration
The graphical interface depicts a front and back view of the installed system. Hovering over any of the green areas will display additional information. The colors will change depending on the alert status for the indicated disk, power controller, fan, port, etc.
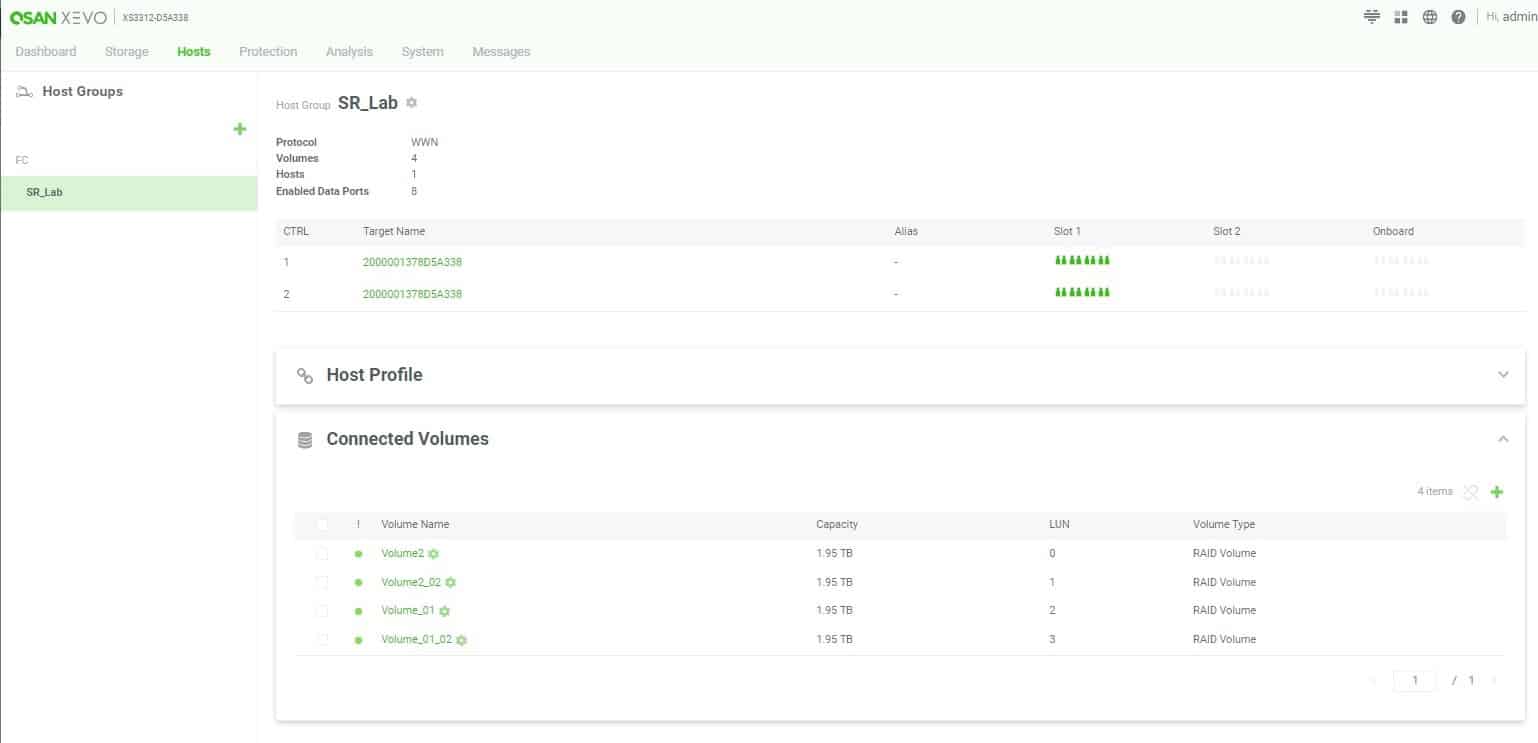
The Host View shows detailed information for managing and configuring hosts and includes the ability to manage volumes.
QSAN XEVO Host Management
In this screen capture, there is a Host (SR_Lab) under the Fibre Channel connection, there are two controllers active for this host, and 4 volumes (i.e., LUNs) are presented to hosts. The user can modify the volumes and change their LUN designations.
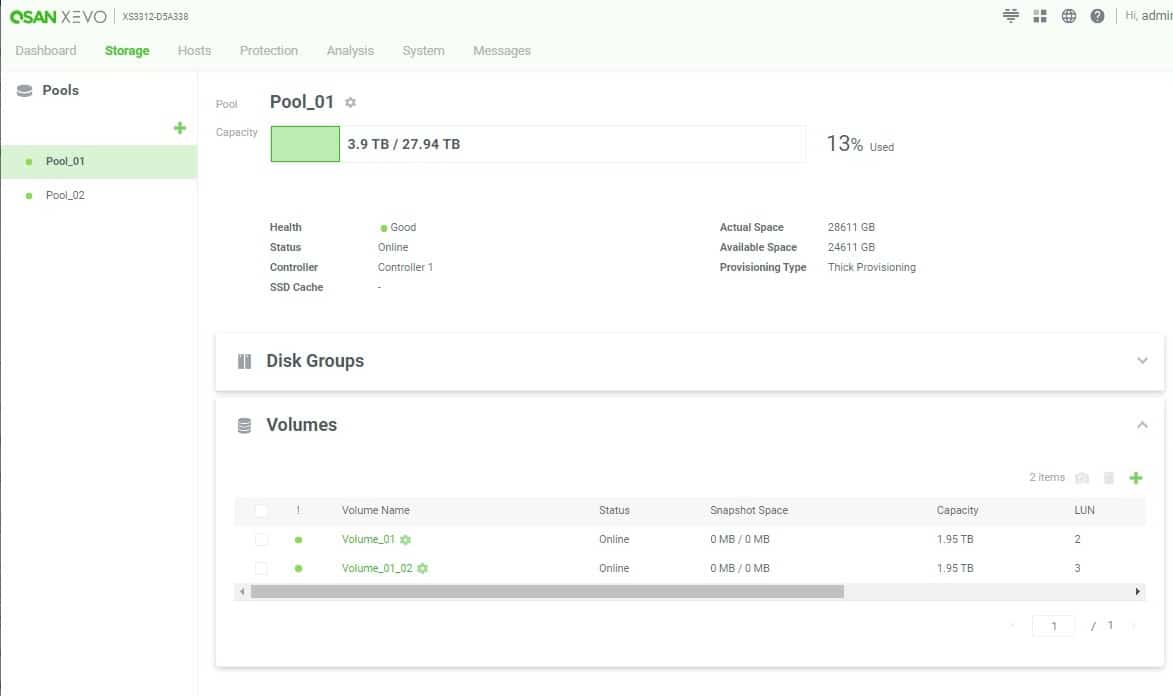
The Pool Management interface manages the configuration of disk drives and volumes contained within the pools.
QSAN XEVO Pool Management
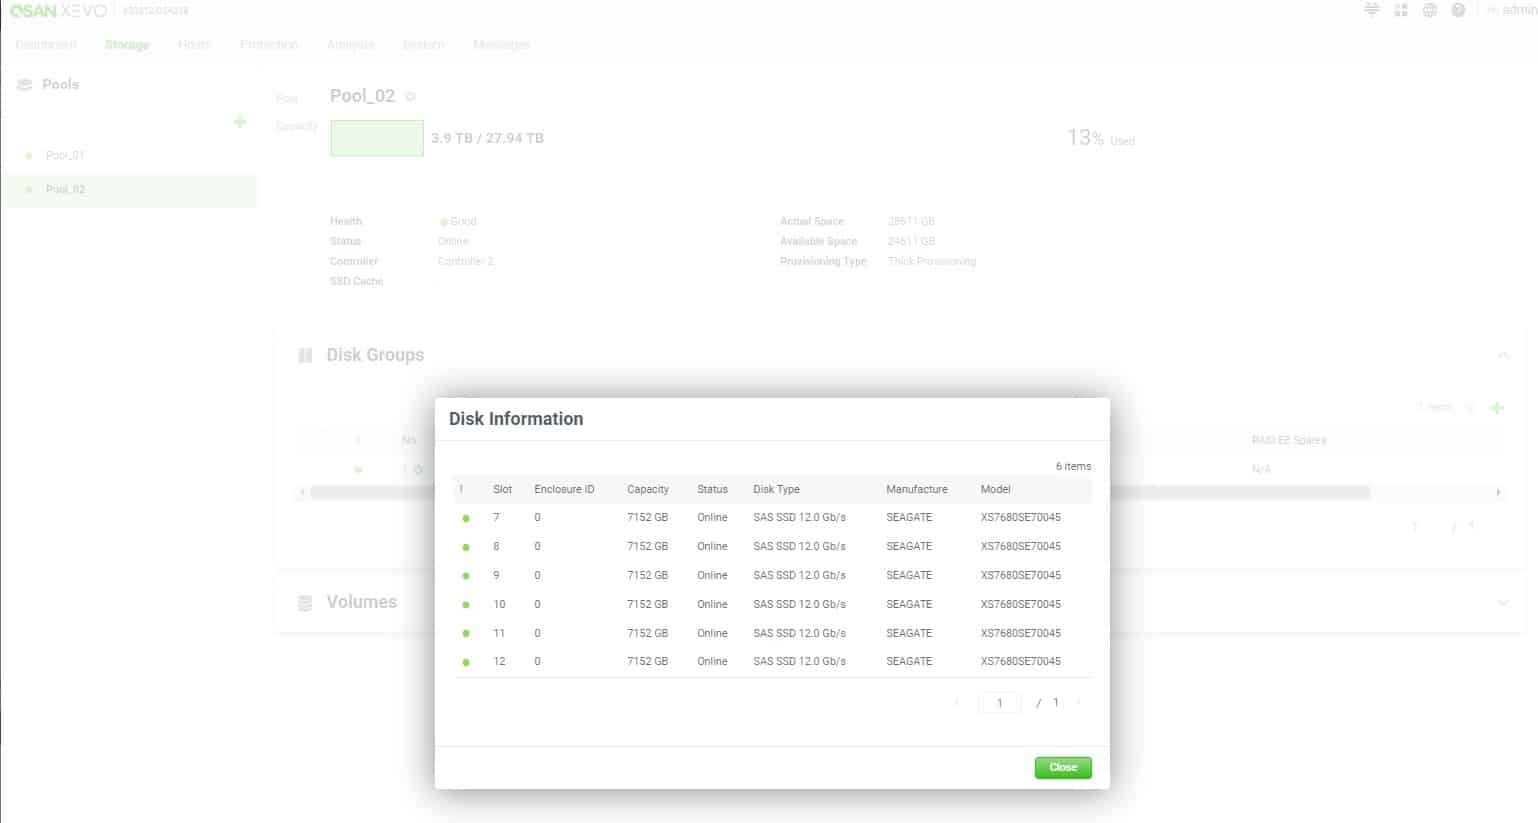
As shown below, the pool named Pool_02 has 6 disk drives (slots) assigned to the configuration.
QSAN XEVO Pool Management Disk Configuration
The information about each drive is provided, including the alert level (green in this instance), the slot number, capacity, current status, and disk type.
In addition to the administration functions, XEVO can display detailed views of the arrays’ performance, including volumes, disk drives, and data ports. An example of the performance graphs for the Data Port connections to hosts is provided below.
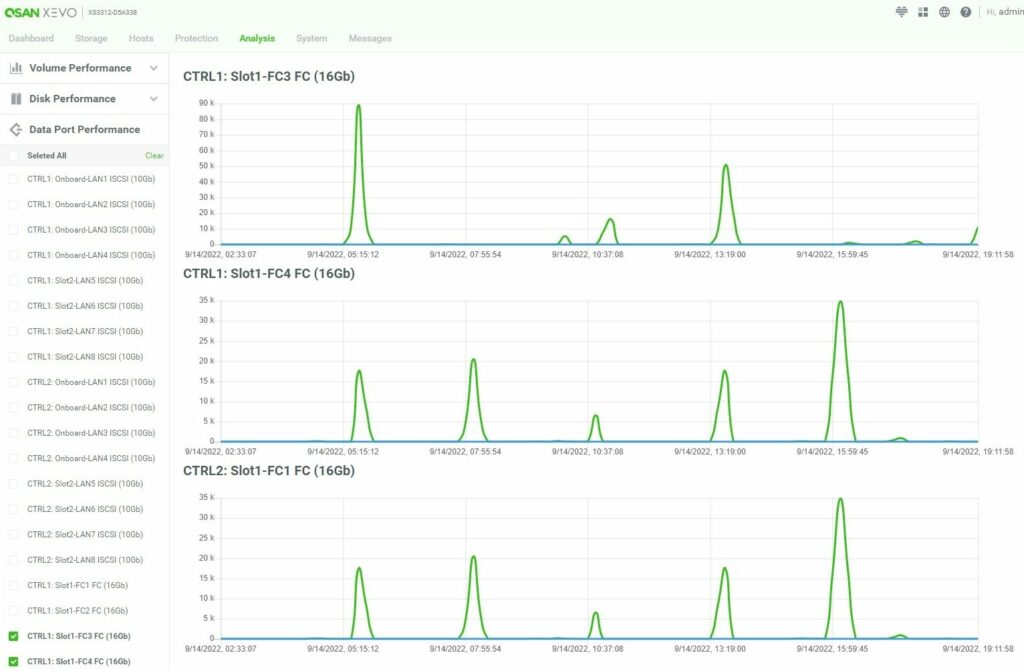
Below is the volume monitoring available in this array, showing each volume’s latency, IOPS, and throughput.
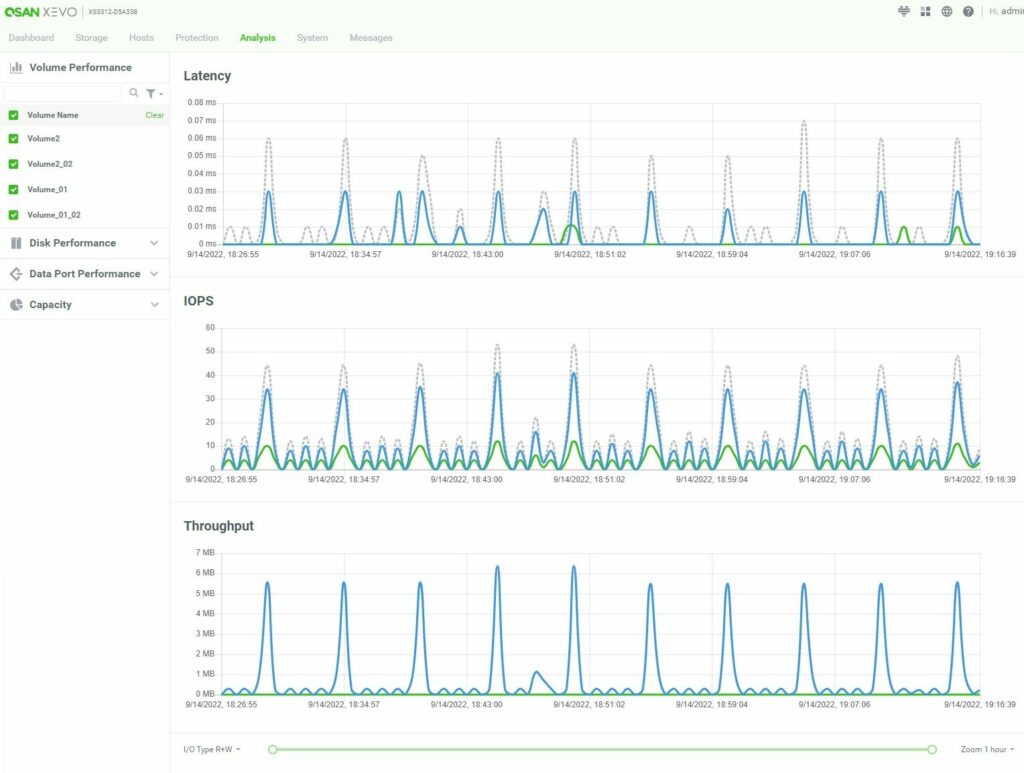
The available performance monitoring on the array is useful when determining bottlenecks in the storage infrastructure.
Overall the user interface is intuitive and easy to use. For a systems integrator putting these units to work for customers, configuring should be a breeze. For a small business that has to care for the array, tasks like performing regular monitoring and maintenance are obvious, meaning any IT generalist should be able to pick this GUI up and run with it.
QSAN XCubeSAN XS3312D Performance
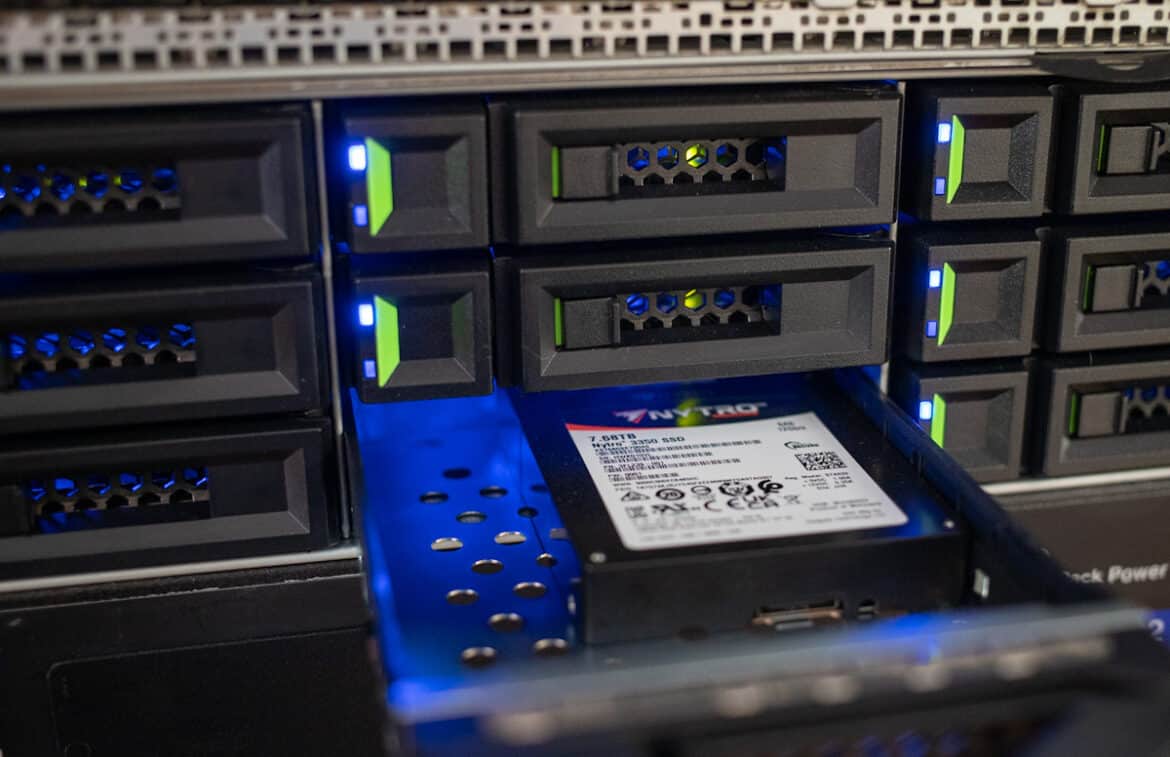
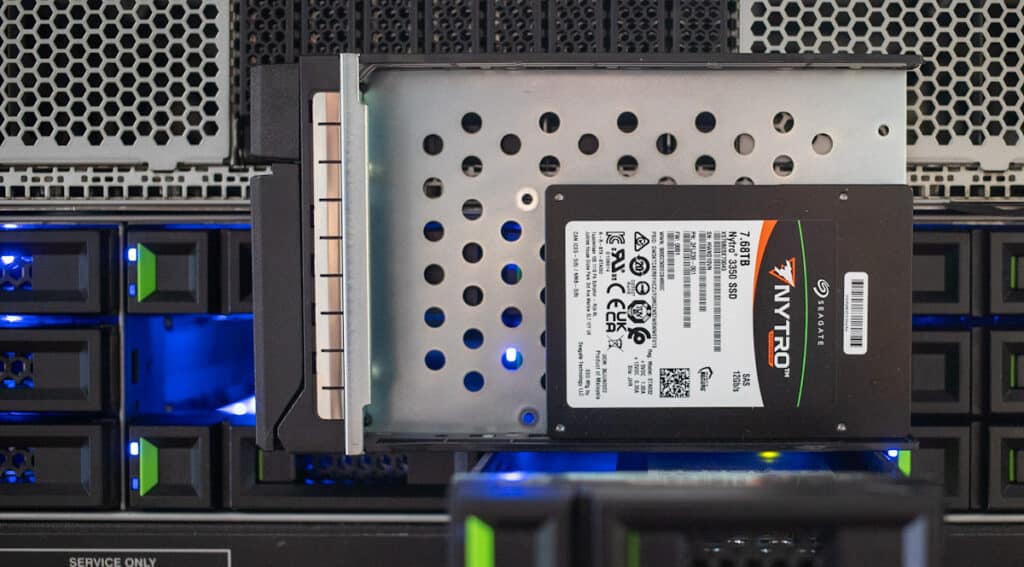
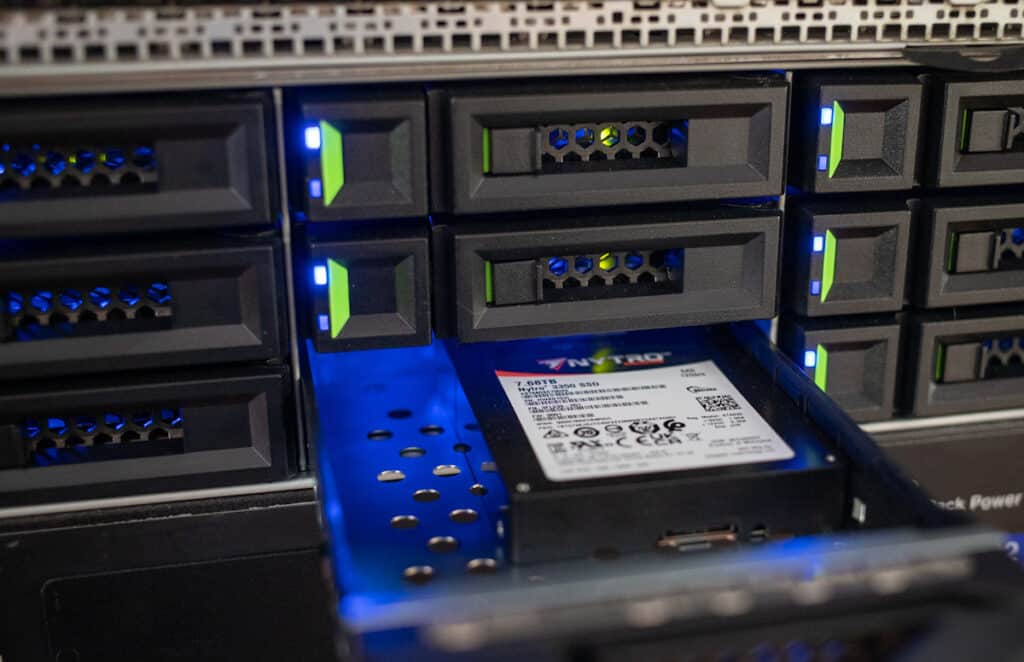
For these tests, we used 12x 7.68TB Seagate Nytro 3350 SAS SSDs. For each configuration, we leveraged two RAID groups made up of 6 SSDs each. We split the drives across both controllers for an active/active configuration. Using SSDs allows the tests to eliminate most of the drive latency and push the limits of the storage array.
SQL Server Performance
Microsoft SQL Server OLTP testing protocol employs the current draft of the Transaction Processing Performance Council’s Benchmark C (TPC-C), an online transaction processing benchmark that simulates the activities found in complex application environments. The TPC-C benchmark comes closer than synthetic performance benchmarks to gauging the performance strengths and bottlenecks of storage infrastructure in database environments.
Each SQL Server VM is configured with two vDisks: a 100GB volume for boot and a 500GB volume for the database and log files. From a system resource perspective, we configured each VM with 16 vCPUs and 64GB of DRAM.
This test uses SQL Server 2014 running on Windows Server 2012 R2 guest VMs. While our traditional usage of this benchmark has been to test large 3,000-scale databases on local or shared storage, in this iteration, we focus on spreading out four 1,500-scale databases evenly across our servers.
SQL Server Testing Configuration (per VM)
- Windows Server 2012 R2
- Storage Footprint: 600GB allocated, 500GB used
- SQL Server 2014
- Database Size: 1,500 scale
- Virtual Client Load: 15,000
- RAM Buffer: 48GB
- Test Length: 3 hours
- 2.5 hours preconditioning
- 30 minutes sample period
In our SQL Server application workload, we measured an average latency of 11ms with RAID6 and 3ms with RAID10, showing that the XCubeSAN XS3312D can achieve a pretty low average latency under this load.

Sysbench MySQL Performance
Our first local-storage application benchmark consists of a Percona MySQL OLTP database measured via SysBench. This test also measures average TPS (Transactions Per Second), average latency, and average 99th percentile latency.
Sysbench Testing Configuration (per VM)
- CentOS 6.3 64-bit
- Percona XtraDB 5.5.30-rel30.1
- Database Tables: 100
- Database Size: 10,000,000
- Database Threads: 32
- RAM Buffer: 24GB
- Test Length: 3 hours
- 2 hours preconditioning 32 threads
- 1 hour 32 threads
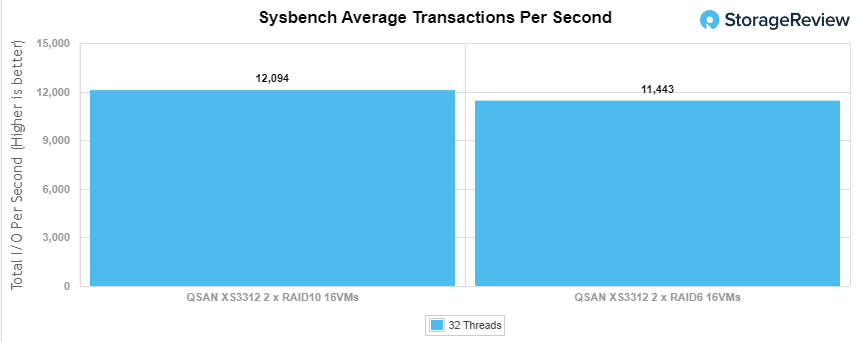
In our Sysbench workload, both RAID configurations were very closely matched. We evenly split the 16 Sysbench VMs across the volumes presented from both our RAID6 and RAID10 pools to measure performance differences between the two RAID types. We measured an aggregate of 12,094 TPS on RAID10 and 11,443 TPS on RAID6.
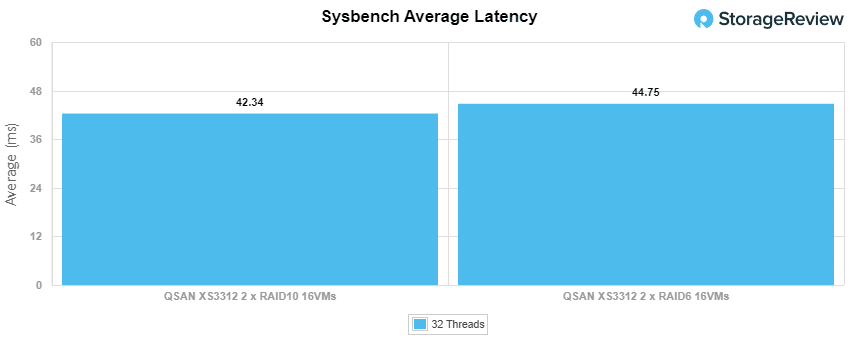
The average latency across the 16VM workload measured 42.49ms for RAID10 and 44.75ms for RAID6.
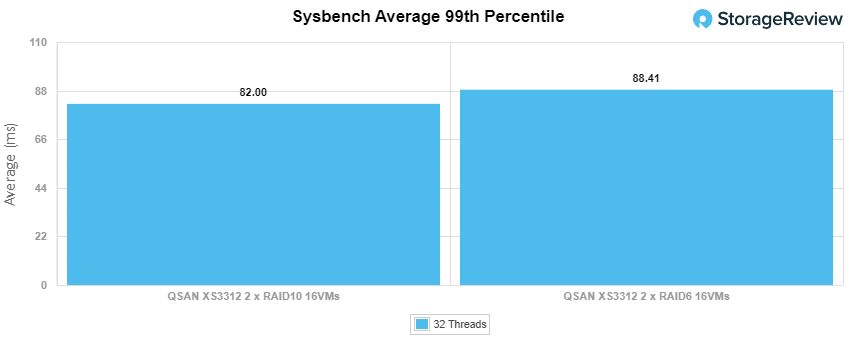
In our last Sysbench test measuring average 99th percentile latency, we saw 82.00ms for RAID10 and 88.41 for RAID6.
VDBench Workload Analysis
Regarding benchmarking storage arrays, application testing is best, and synthetic testing comes in second place. While not a perfect representation of actual workloads, synthetic tests help baseline storage devices with a repeatability factor that makes it easy to compare competing solutions. These workloads offer a range of different testing profiles ranging from four corner tests and common database transfer size tests to trace captures from different VDI environments. These tests leverage the common vdBench workload generator, with a scripting engine to automate and capture results over a large compute testing cluster. This allows us to repeat the same workloads across a wide range of storage devices, including flash arrays and individual storage devices.
Profiles:
- 4K Random Read: 100% Read, 128 threads, 0-120% iorate
- 4K Random Write: 100% Write, 64 threads, 0-120% iorate
- 64K Sequential Read: 100% Read, 16 threads, 0-120% iorate
- 64K Sequential Write: 100% Write, 8 threads, 0-120% iorate
- Synthetic Database: SQL and Oracle
- VDI Full Clone and Linked Clone Traces
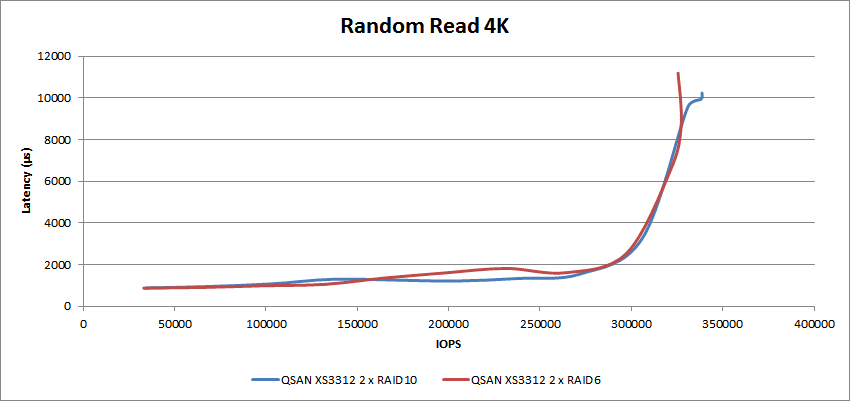
Starting with our four-corners workload (peak throughput and peak bandwidth), we looked at the small-block I/O saturation in a 4K random read workload. Here we saw both RAID groups show sub-2ms latency up through 280K IOPS before peaking out at about 326K IOPS for RAID6 and 338K IOPS for RAID10, respectively.
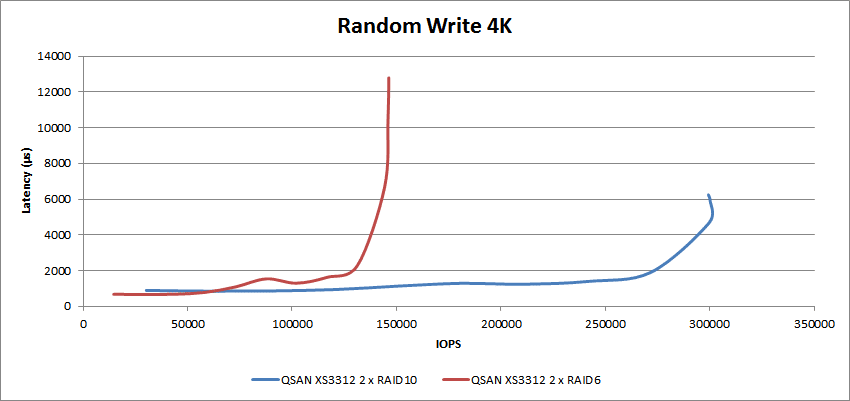
In our random write workload, RAID6 peaked at 146K IOPS with 12.8ms latency, while RAID10 pushed the array much further and achieved just over 300K IOPS at 5.9ms average latency.
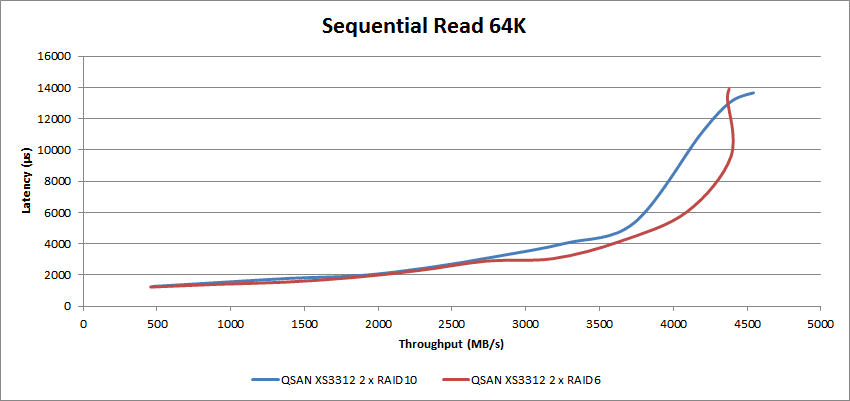
In the 64K sequential read tests, both RAID configurations crossed over the 2ms latency mark at 2.2GB/s throughput. However, the RAID10 configuration began experiencing higher latency growth at the 3.7GB/s throughput mark, topping out at 13.7ms latency at the 4.54GB/s mark. RAID6, meanwhile, hit a wall at around 4.39GB/s with 9.58ms latency.
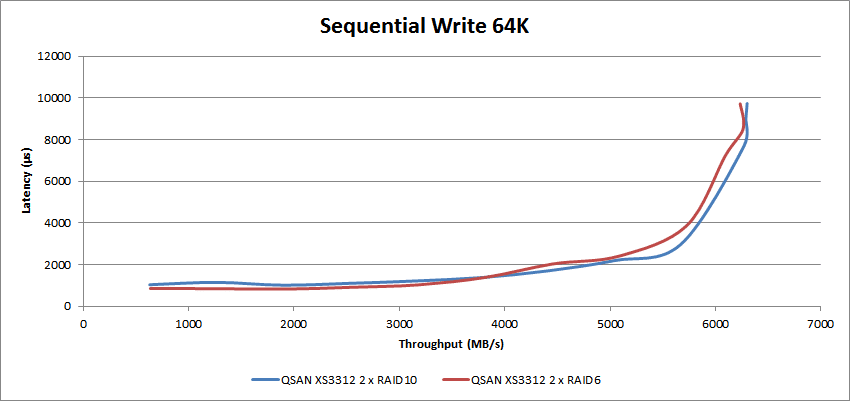
For the sequential write tests, the QSAN XS3312D achieved up to 6.3GB/s throughput and 9.7ms latency with RAID10, and RAID6 came close to matching this at around 6.2GB/s. RAID6 crossed 2ms latency at 4.5GB/s while RAID10 achieved 5.0GB/s at 2ms latency.
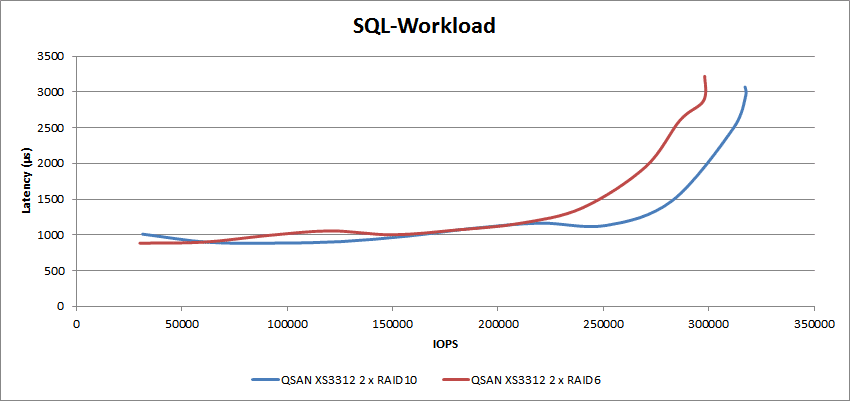
Our next set of tests covers three synthetic SQL workloads: SQL, SQL 90-10, and SQL 80-20. With the standard SQL workload, we were able to push the storage array to 318K IOPS before crossing 3ms of latency with RAID10. RAID6 maxed at 298K IOPS with 3.22ms latency.
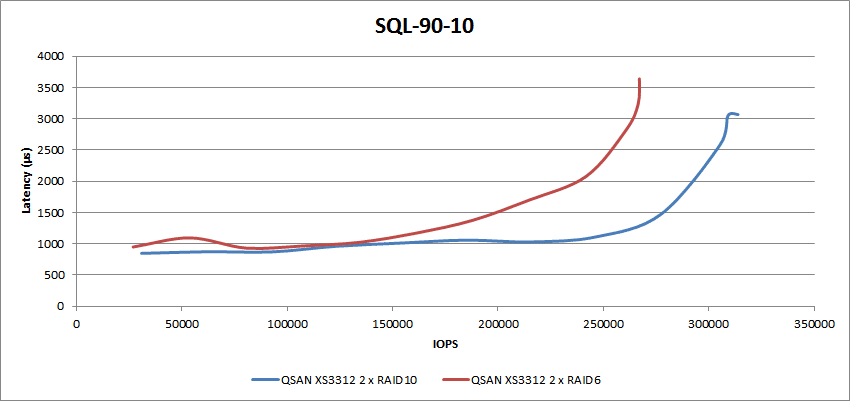
In our SQL 90% read and 10% write tests, the QSAN XS3312D achieved around 309K IOPS at 3.1ms latency on RAID10, and RAID6 topped out at 267K IOPS with over 3.64ms latency.
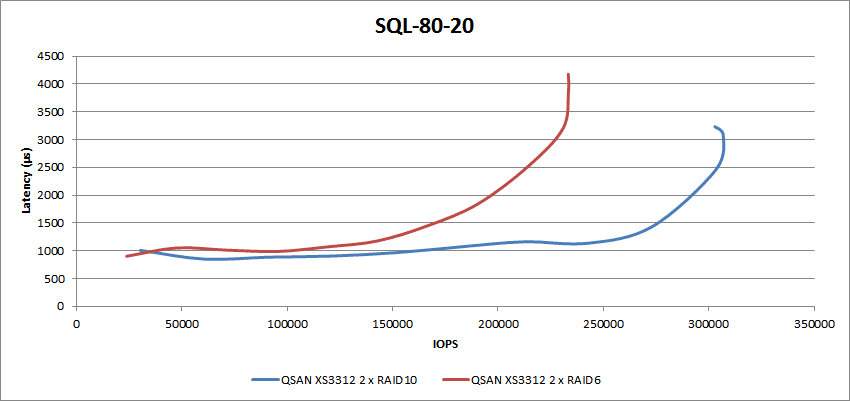
In the SQL 80-20 tests, RAID6 achieved 233K IOPS at 4.18ms latency, while RAID10 achieved 307K IOPS at 3.1ms latency.
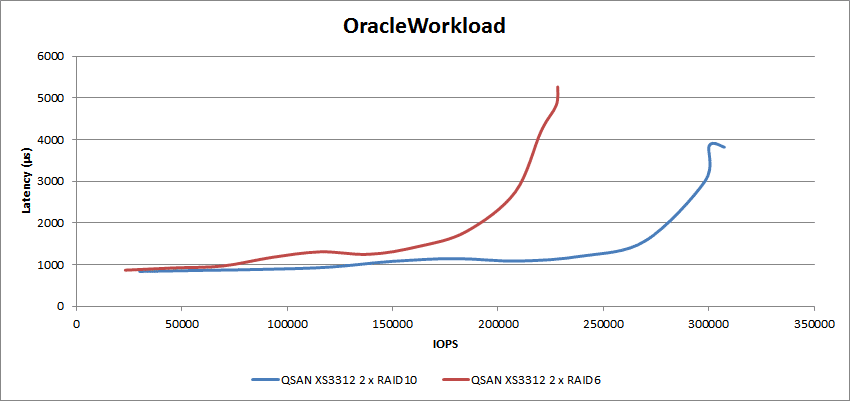
Next, we have our synthetic Oracle workloads: Oracle, Oracle 90-10, and Oracle 80-20. In the first Oracle workload test, RAID6 achieved 228K IOPS at 5.26ms latency, and RAID10 pushed the QSAN XS3312D to 300K IOPS at 3.86ms latency.
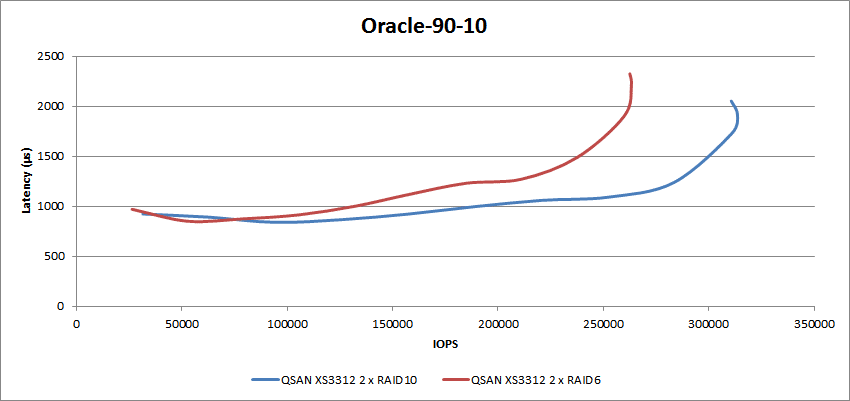
In the Oracle 90% read 10% write tests, RAID6 reached 262.5K IOPS at 2.32ms latency, and RAID10 hit 316.6K IOPS at 1.92ms latency.
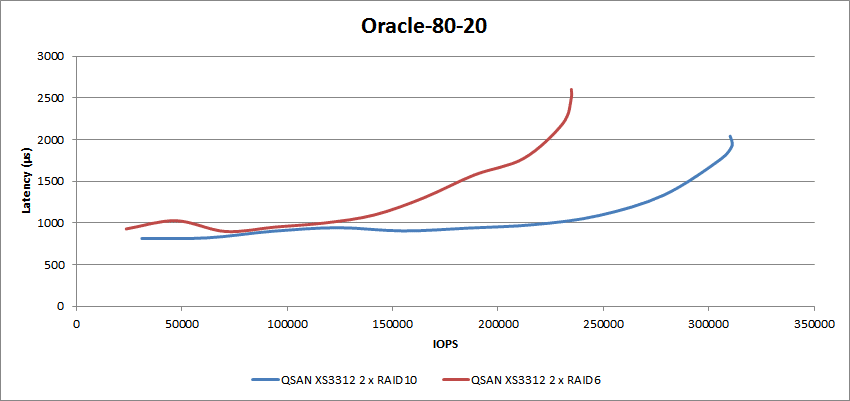
For the 80% read/20% write tests, RAID6 achieved 234.8K IOPS at 2.6ms latency, and RAID10 reached 311K IOPS at 1.9ms latency.
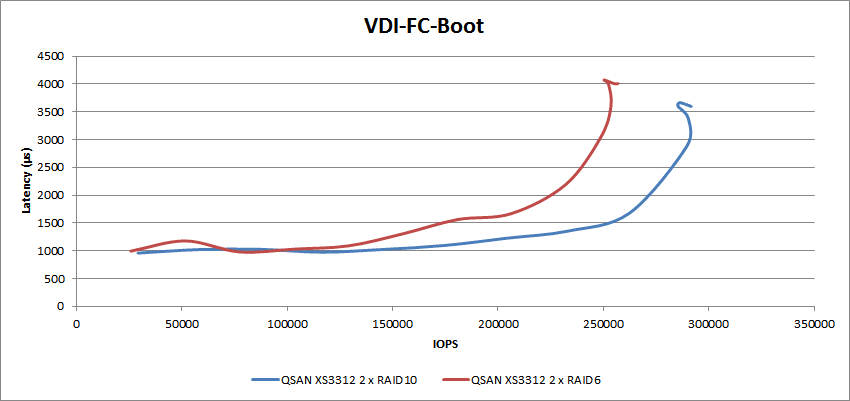
In our last section of benchmarks, we look at synthetic VDI performance, measuring both Full Clone and Linked Clone scenarios. We start with Full Clone looking at Boot, Initial Login, and Monday Login events. For the VM boot tests, RAID10 was able to achieve 290K IOPS at 3.4ms latency, and RAID6 hit 253.6K IOPS at 3.6ms.
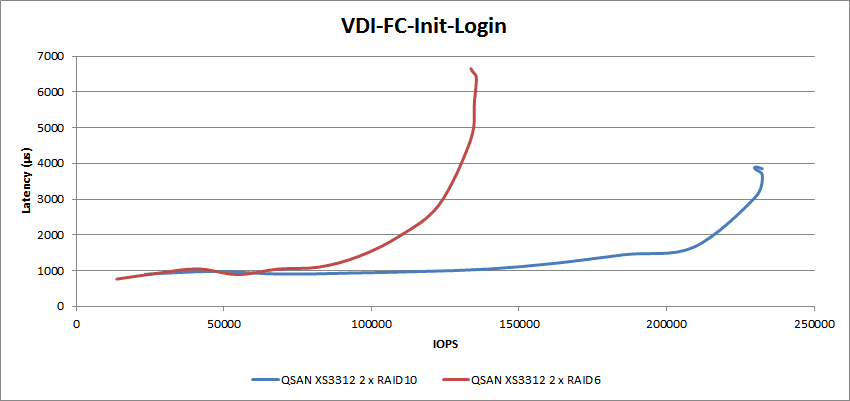
In the FC Initial Login tests, RAID10 was able to achieve a 232.5K IOPS at 3.64ms latency, and RAID6 hit 135.5K IOPS at 6.3ms.
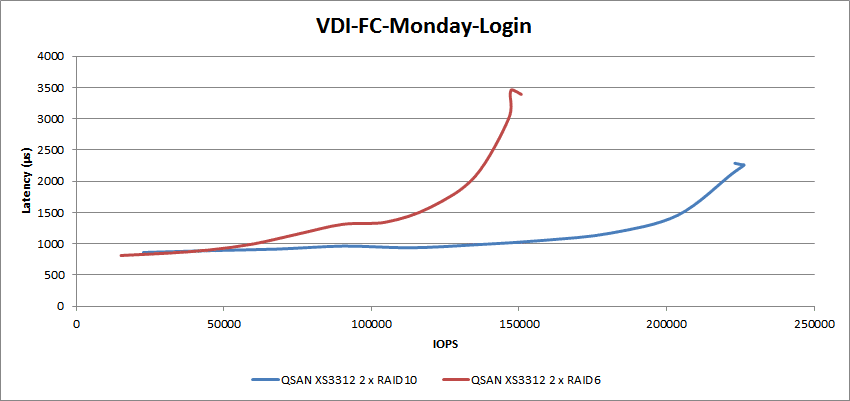
In the final FC test, the Monday Login workload, we pushed RAID10 to 226.2K IOPS at 2.26ms, and RAID6 peaked at 147.5K IOPS at 3.46ms latency.
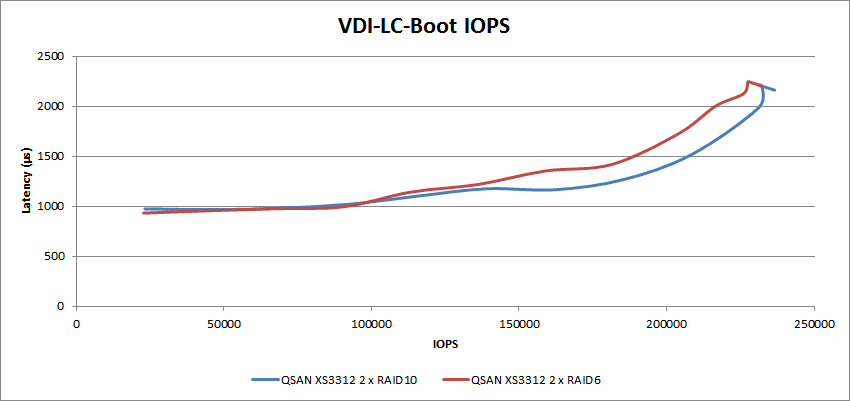
For the Linked Clone boot tests, RAID10 achieved 232K IOPS at 2.2ms latency, and for RAID6, we achieved 223K IOPS at 2.18ms average latency.
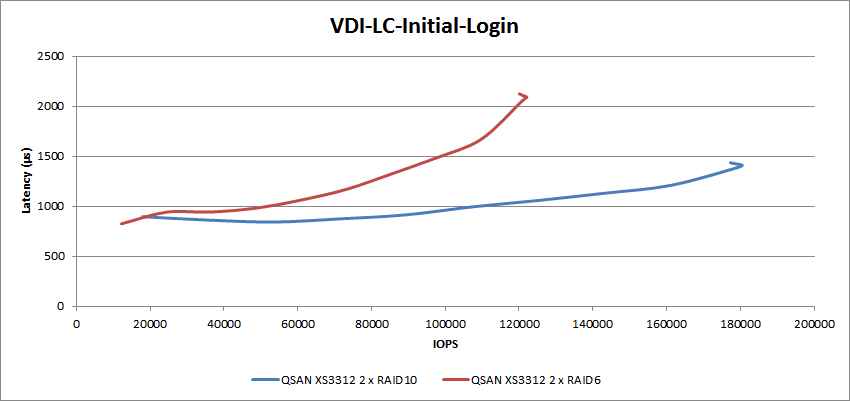
The initial login tests showed RAID10 hitting 180K IOPS with 1.4ms average latency, while RAID6 only achieved 122K IOPS at 2.1ms latency.
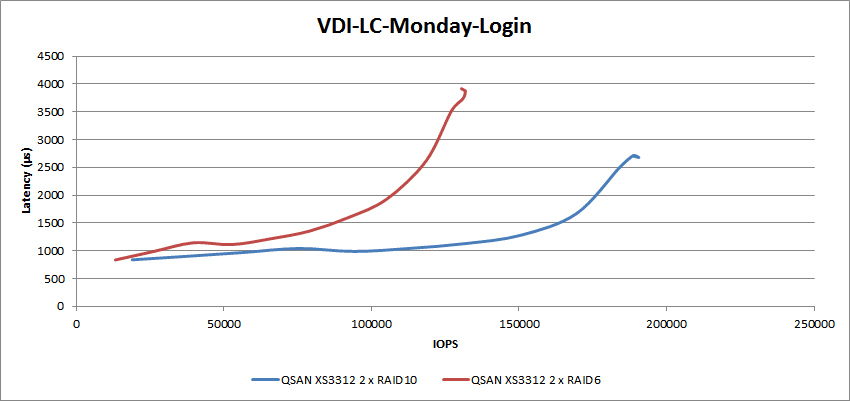
In the final LC test, the Monday login workload, RAID10 achieved 190.1K IOPS with 2.68ms latency, compared to RAID6, which maxed out at 131.8K IOPS with 3.88ms latency.
Conclusion
We’ve had many QSAN units come through our lab over the years, and they’ve always been great when it comes to the ever-important triangle balancing performance, cost, and feature set. This time around, the XS3312 is more of the same, which is great news for small businesses, distributed enterprises, MSPs, and regional cloud service providers.
We tested the XS3312D model, which offers dual controllers, while a single-controller version of the unit is offered as the XS3312S. With dual controllers our testing configuration leveraged twelve SSDs split into two groups of six. These were then configured in two groups of RAID6 or RAID10 pools for their respective tests.
In terms of speeds and feeds, the QSAN XS3312D offered strong performance, topping out at 4.54GB/s in RAID10 in our 64K sequential read transfer test. Small-block I/O in our random 4K transfer test peaked at 338k IOPs in RAID10 as well.
In SQL Server application testing with a load of SQL VMs, the RAID6 configuration had an average aggregate response time of 11ms, while RAID10 had 3ms. Sysbench performance was strong as well, although not a huge difference between the two RAID types. With a load of 16VMs RAID10 measured 12,094 TPS and RAID6 came in at 11,443 TPS.
QSAN continues to deliver great solutions for the entry-storage segment, where there tends to be a lot of competition. This ranges from NAS solutions that need additional software or packages to handle block storage to offerings from the major OEMs that tend to be feature-rich, but expensive. QSAN does well in between, delivering block storage with a deep feature set that’s also not going to blow up budgets.
As much as it seems there should be a lot of solutions that address this specific concern, they really aren’t. Additionally, street pricing on the XS3312D is $7,200 bare, and there’s no lockout on the drives used, so customers or integrators have flexibility in deployment. Overall this is a great way for a small business to start small and have a solution that cost-effectively grows with their data footprint for years to come.
QSAN XCubeSAN XS3312D Product Page
QSAN sponsors this report. All views and opinions expressed in this report are based on our unbiased view of the product(s) under consideration.
Engage with StorageReview
Newsletter | YouTube | Podcast iTunes/Spotify | Instagram | Twitter | TikTok | RSS Feed

