The Samsung 850 EVO mSATA is pretty much identical to the previously reviewed 2.5 inch 850 EVO, which proved to be an impressive SSD by offering bar-setting performance and fantastic endurance coupled with a competitive price point. As such, the mSATA version of Samsung’s newest SSD line features the same 3D V-NAND technology, enabling it to boast twice the endurance of a conventional 2D planar type NAND flash, and is designed to maximize everyday computing with an obvious focus on performance and reliability. The mSATA model is built for small form factor computing, embedded applications, and provides users with upgrading capability for ultra-thin PCs and desktops using an mSATA slot.
Like all of its form factors, the mSATA 850 EVO is equipped with some very useful power-saving features, including its Device Sleep functionality with a highly efficient 2mW. This feature fits particularly well with the mSATA form factor, as it will be predominantly residing in mobile computing systems where battery longevity is very important.
The Samsung 850 EVO mSATA is backed by a 5-year warranty and ships in capacities of 120GB ($80), 250GB ($130), 500GB ($230), and 1TB ($550). We will be looking at the 120GB and 1TB units for this review.
Samsung SSD 850 EVO mSATA Specifications
- Capacities: 120GB, 250GB, 500GB, 1TB(1,000GB)
- Dimensions (LxWxH): (29.85±0.15) x (50.80±0.15) x Max 3.85 (mm)
- Interface: SATA 6Gb/s (compatible with SATA 3Gb/s and SATA 1.5Gb/s)
- Form Factor: mSATA
- Controller
- 120/250/500GB : Samsung MGX controller
- 1TB: Samsung MEX controller
- NAND Flash Memory: Samsung 32 layer 3D V-NAND
- DRAM Cache Memory: 512MB (120GB, 250GB, 500GB) LPDDR3 and 1GB (1TB) LPDDR2
- Performance
- Sequential Read: Max. 540 MB/s
- Sequential Write: Max. 520 MB/s
- 4KB Random Read (QD1): Max. 10,000 IOPS
- 4KB Random Write (QD1): Max. 40,000 IOPS
- 4KB Random Read (QD32):
- Max. 97,000 IOPS (250GB/500GB/1TB)
- Max. 95,000 IOPS (120GB)
- 4KB Random Write (QD32): Max. 88,000 IOPS
- Weight Max: 8.5g (1TB)
- Power Consumption Active Read/Write (Average): Max. 3.5W (1TB)/ Max. 4.3W(1TB)
- Idle: Max. 50mW, Device Sleep: 2Mw
- Warranty:
Design and Build:
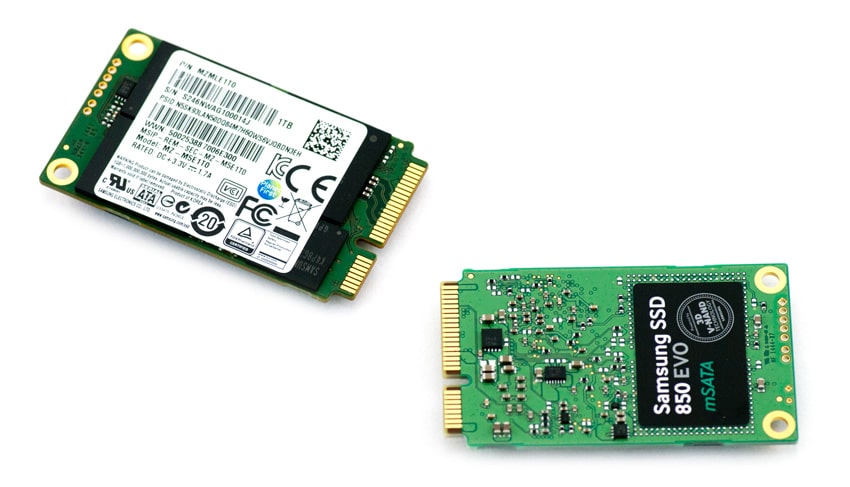
The Samsung 850 EVO mSATA SSD is much smaller and lighter than a 2.5 inch SSD and even smaller than a credit card. Like all mSATA devices, they do not have a casing, and as a result, all components are exposed.
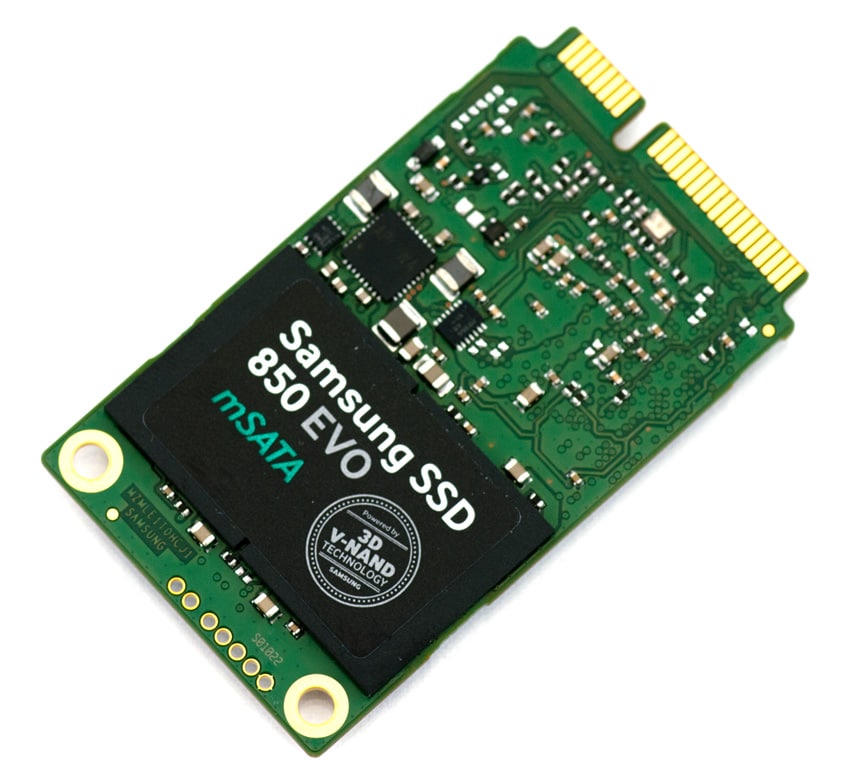
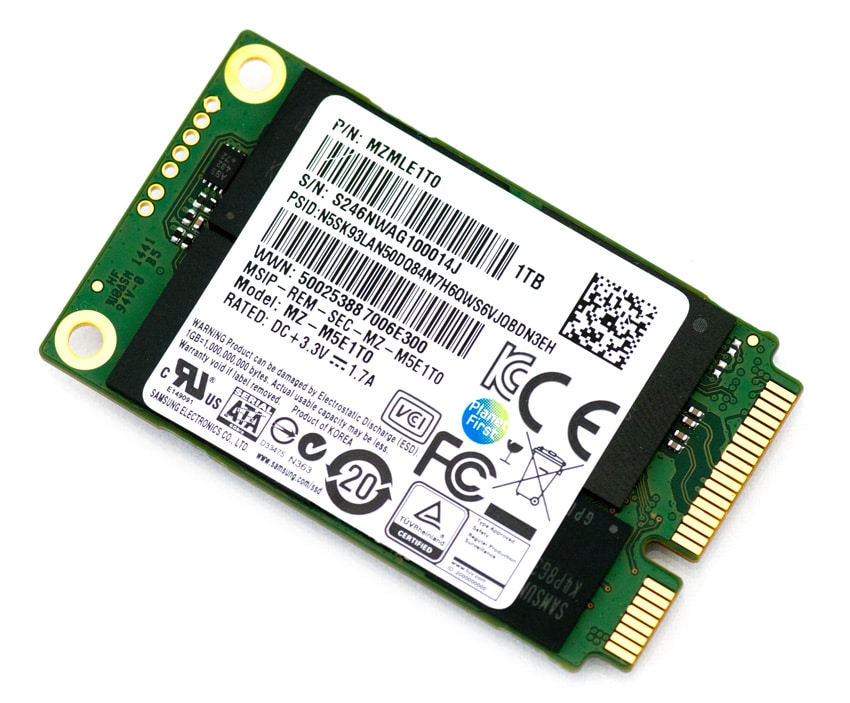
One of the sides has a branded sticker, which covers two of the NAND chips, while other side has a more detailed sticker listing part number and other details about the drive.
When turning over the mSATA device, you can see the other two NAND packages. The 1TB model uses the Samsung MEX controller while the 120GB model uses the Samsung MGX controller.
Consumer Synthetic Benchmarks
All consumer SSD benchmarks are conducted with the StorageReview HP Z620 Consumer Testing Platform. With the Samsung SSD 850 EVO mSATA SSD, we tested the raw drive only and without RAPID turned on.
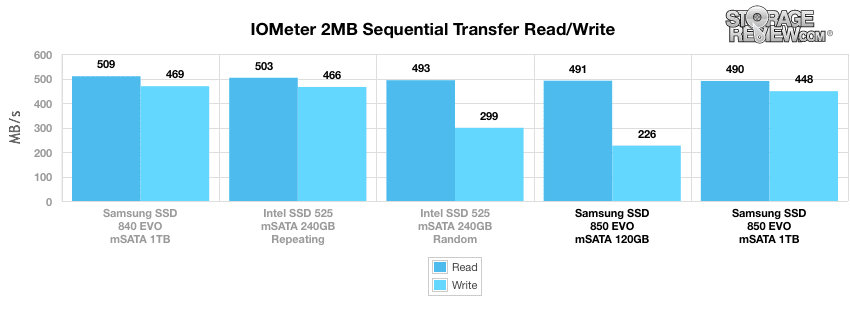
In our first test, which measures 2MB sequential performance, the Samsung 850 EVO mSATA (1TB) posted 490.07MB/s read and 448.34MB/s write. While 120GB model had virtually the same read speed at 491.02MB/s, it had significantly slower write activity at 226.04MB/s write. Its predecessor, the Samsung SSD 840 EVO mSATA 1TB, had better results in both columns.
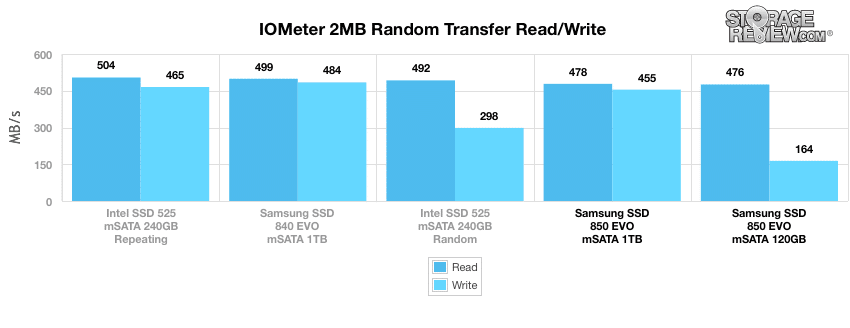
Our next test looks at 2MB random transfer performance. In this benchmark, the Samsung 850 EVO mSATA 1TB posted read and write activity that measured 478.31MB/s and 454.69MB/s, while the 120GB model measured 475.75MB/s read with only 163.81MB/s write. The 840 model again showed noticeably better results while the 850 models placed at the bottom of the pack.
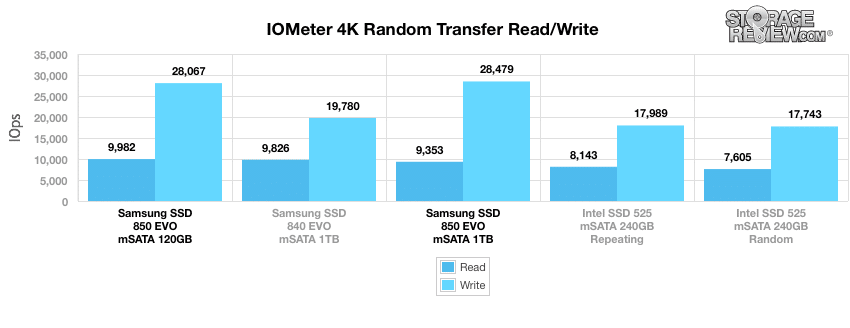
When we switched to smaller 4k random transfers, the Samsung 850 EVO mSATA drives picked up in performance. When looking at throughput, the Samsung 850 EVO 1TB measured 9,352.90 IOPS for read activity and 28,478.72 IOPS for write activity, the latter which was the top performer. The 120GB model measured an impressive read IOPS with 9,981.55, which was the top performing drive in the read category.
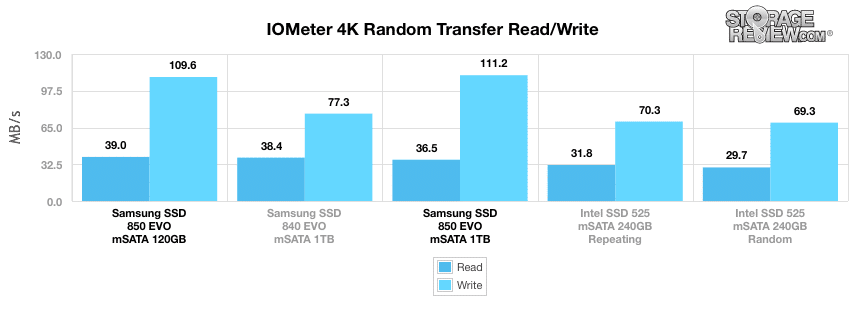
Next, we measured the Samsung mSATA drives in MB/s. Here, the 120GB drive had the best read performance with 38.99MB/s while the 1TB drive recorded the best write activity with 111.25MB/s.
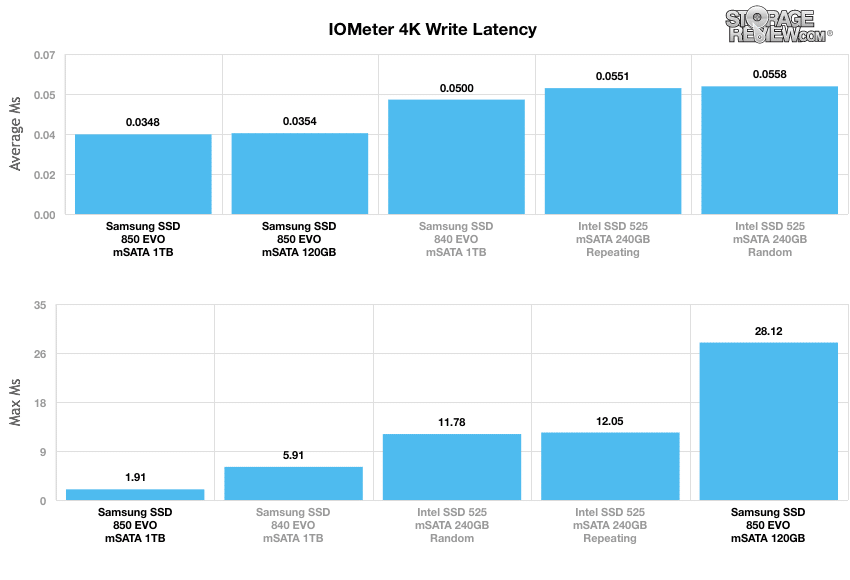
When comparing average write latency between each mainstream consumer SSD, the Samsung 850 Evo mSATA 1TB had a very impressive and top performing average response time and peak latency at 0.0348ms and 1.909ms respectively. The 120GB model posted an average response time of 0.0353ms with a much higher peak latency at 28.12ms, placing last place among the comparables.
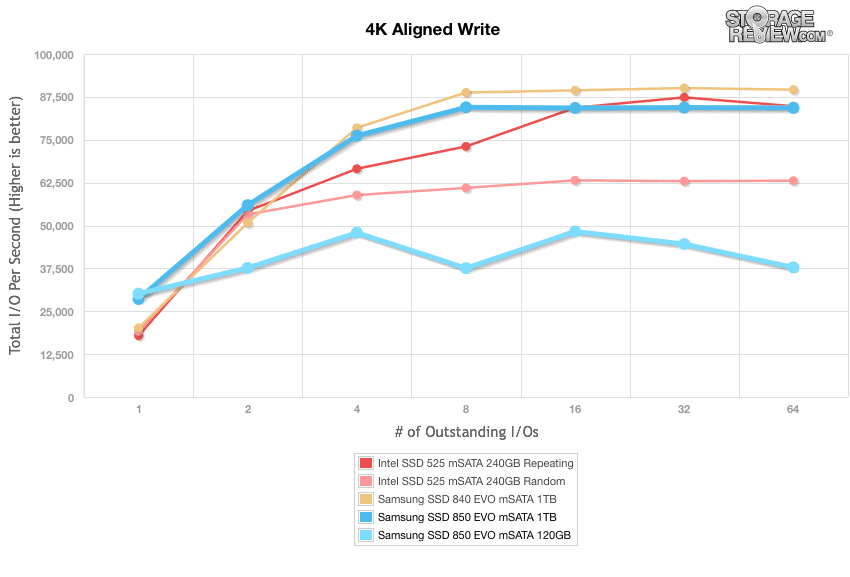
Our next test shifts to a 4k random workload with 100% write activity that scales from 1QD to 64QD.Here, the Samsung 850 Evo mSATA 120GB measured from 30,113.46 IOPS and only reaching 37,776.16 IOPS. The 1TB model, however, had a slower burst speed at 28,568.89 IOPS but ended up with a very respectable 84,301.92 IOPS. The Samsung SSD 840 EVO mSATA 1TB was the top performer here, with a 64QD of 89,589.79 IOPS.
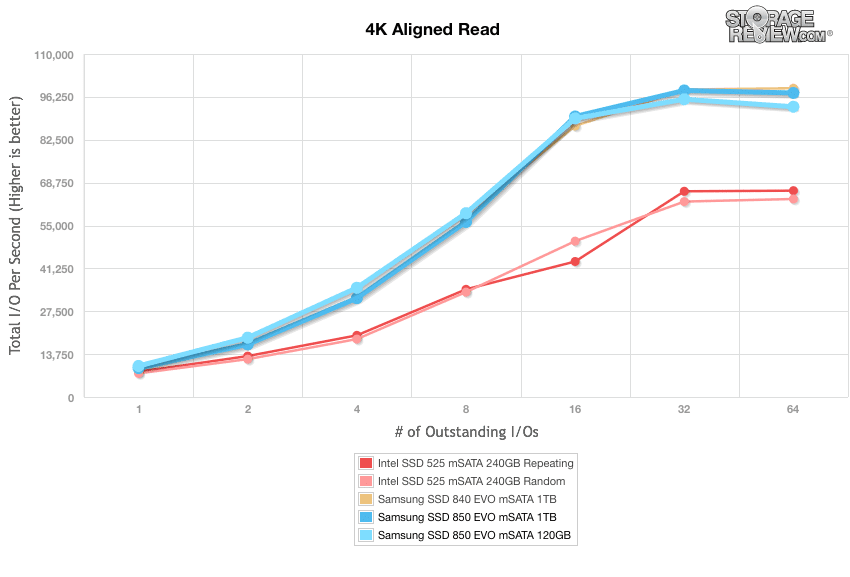
Moving to read activity, the Samsung 850 Evo mSATA picked up where it left off with 9,259.52 IOPS at QD1 while peaking at 97,507.73 IOPS in the terminal queue depths, which placed it among at the top of the leaderboard just behind its 840 brethren. The 120GB model had good performance as well with a burst throughput of 9,946.86 IOPS and 93,083.69 IOPS in the last queue depth.
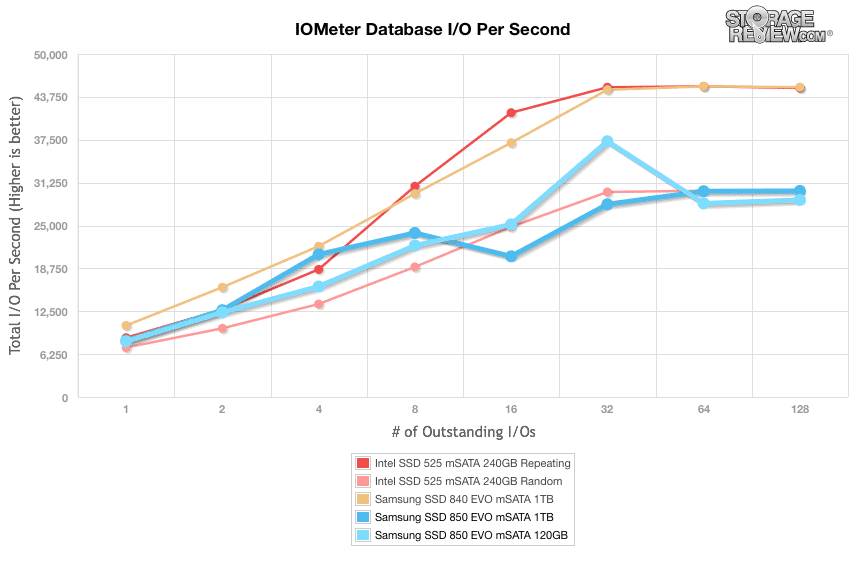
Our last series of synthetic benchmarks compare the hard drives in a series of server mixed-workloads with a queue depth of ranging from 1 to 128. Each of our server profile tests has a strong preference towards read activity, ranging from 67% read with our database profile to 100% read in our web server profile. The Samsung 850 EVO mSATA ranked all across the board during our mixed workloads
The first is our database profile, which consists of a 67% read and 33% write workload mix primarily centered on 8K transfer sizes. Here, the 1TB Samsung 850 EVO mSATA ranged from 8,186.02 IOPS in burst while reaching 30,042.06 IOPS in the terminal queue depths placing it in the middle of the pack. The 120GB model posted 28,731.79 IOPS by 128QD (bottom of the leaderboard).
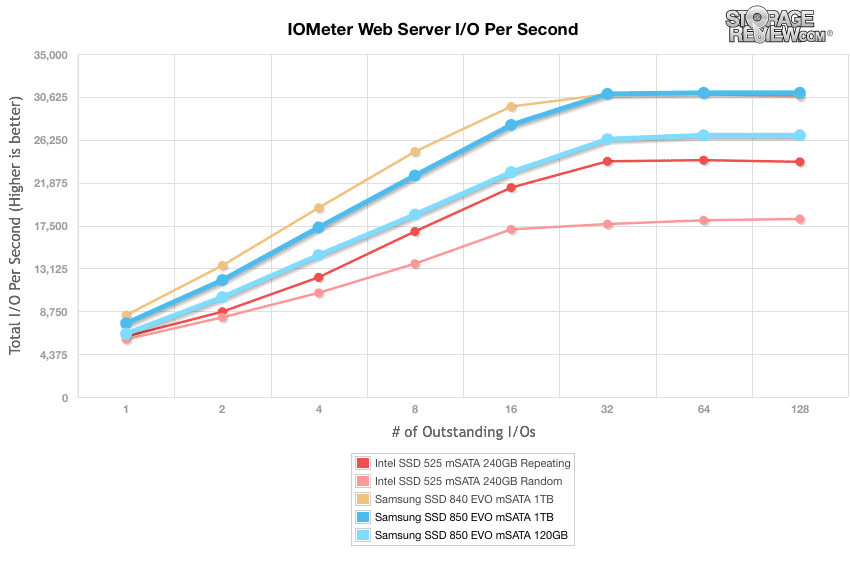
The next profile looks at a webserver, with 80% read and 20% write workload spread out over multiple transfer sizes ranging from 512-byte to 64KB. The Samsung 850 EVO 1TB boasted 7,515.59 IOPS QD1 while hitting 31,034.0398 IOPS in 128QD, taking first place. The 120GB model posted a 128QD throughput of 26,712.13 IOPS, placing in the middle of the pack.
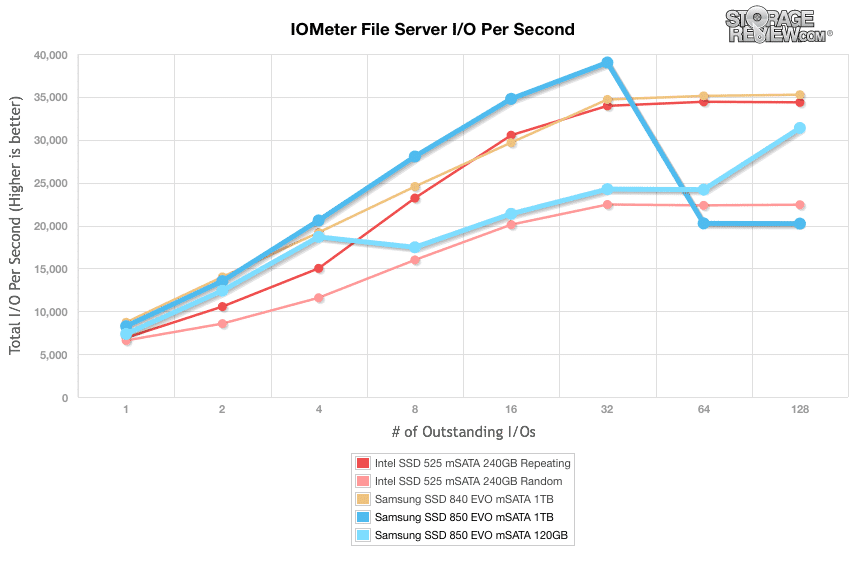
Our file server profile is read-only with a spread of transfer sizes from 512-byte to 512KB. The Samsung 850 EVO 1TB showed a QD1 of 8260.164426 IOPS and a QD128 of 20,219.04 IOPS, ranking last among the tested mSATA drives. The 120GB showed a much better throughput in the terminal queue depths with a final IOPS of 31,373.42.
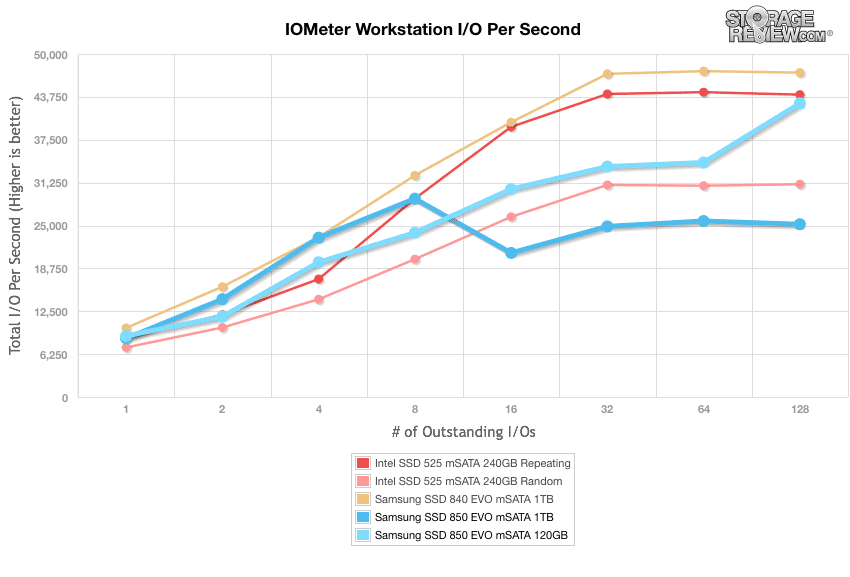
The last profile looks at workstation activity, with a 20% write and 80% read mixture using 8K transfers. The Samsung 850 EVO 120GB posted a range of 8,904.87 IOPS to 42,793.45 IOPS, which placed in the middle of the pack. The 1TB model posted weak results, which ranged from 85,50.80 IOPS to 25,185.75 IOPS.
Consumer Real-World Benchmarks
For the average consumer, trying to translate random 4K write speeds into an everyday situation is pretty difficult. It helps when comparing drives in every setting possible, but it doesn’t exactly work out into faster everyday usage or better game loading times. For this reason we turned to our StorageMark 2010 traces, which include HTPC, Productivity, and Gaming traces to help readers find out how a drive might rank under these conditions.
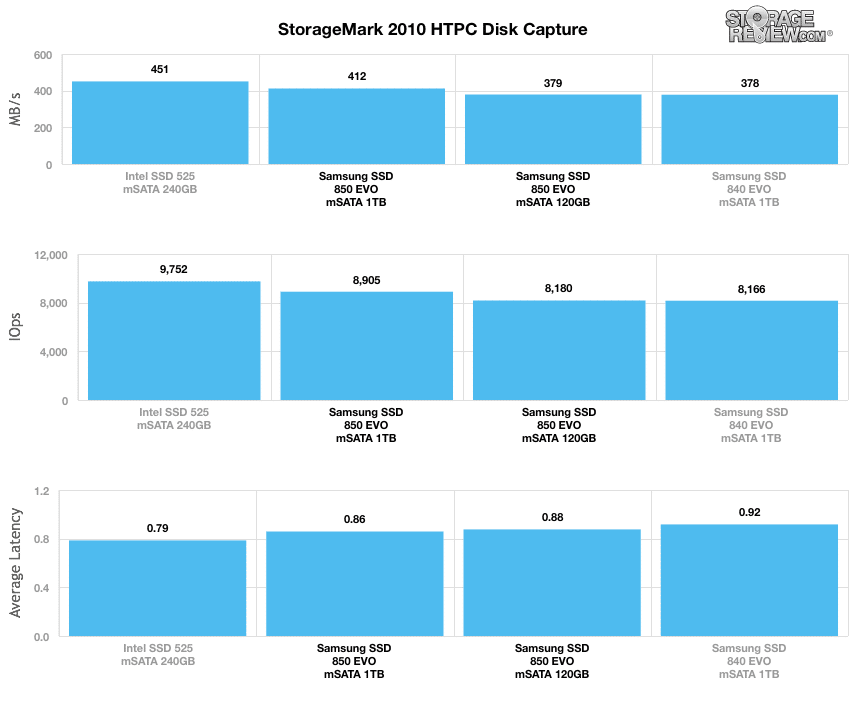
The first real-life test is our HTPC scenario. In this test we include: playing one 720P HD movie in Media Player Classic, one 480P SD movie playing in VLC, three movies downloading simultaneously through iTunes, and one 1080i HDTV stream being recorded through Windows Media Center over a 15 minute period. Higher IOps and MB/s rates with lower latency times are preferred. In this trace we recorded 2,986MB being written to the drive and 1,924MB being read.
In our HTPC profile, the 1TB EVO posted an average speed of 411.96MB/s, 8,905 IOPS and 0.859ms in average latency, while the 120GB boasted 379.02MB/s, 8180.33 IOPS, and 0.876ms in average latency. Though the 1TB performed respectably, it was still well behind the Intel SSD 525 mSATA 240GB.
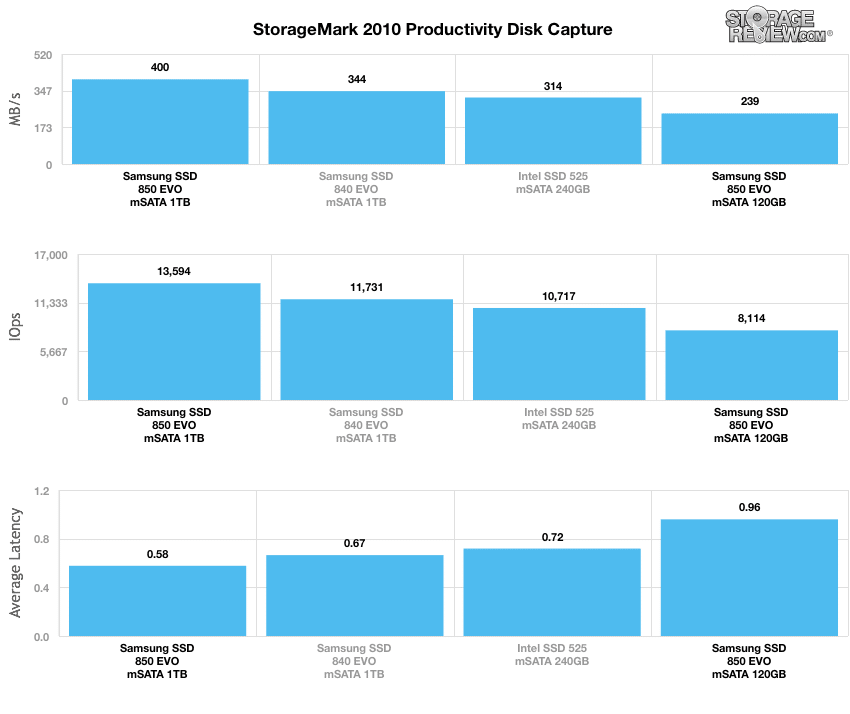
Our second real-life test covers disk activity in a productivity scenario. For all intents and purposes, this test shows drive performance under normal daily activity for most users. This test includes: a three hour period operating in an office productivity environment with 32-bit Vista running Outlook 2007 connected to an Exchange server, web browsing using Chrome and IE8, editing files within Office 2007, viewing PDFs in Adobe Reader, and an hour of local music playback with two hours of additional online music via Pandora. In this trace we recorded 4,830MB being written to the drive and 2,758MB being read.
In our Productivity trace, the 1TB Samsung 850 EVO dominated the tested mSATA drives registering 13,594.17 IOPS, 400.43MB/s, and 0.577ms in average latency placing it at the top of the leaderboard by a large margin. Its 120GB brethren had significantly slower results.
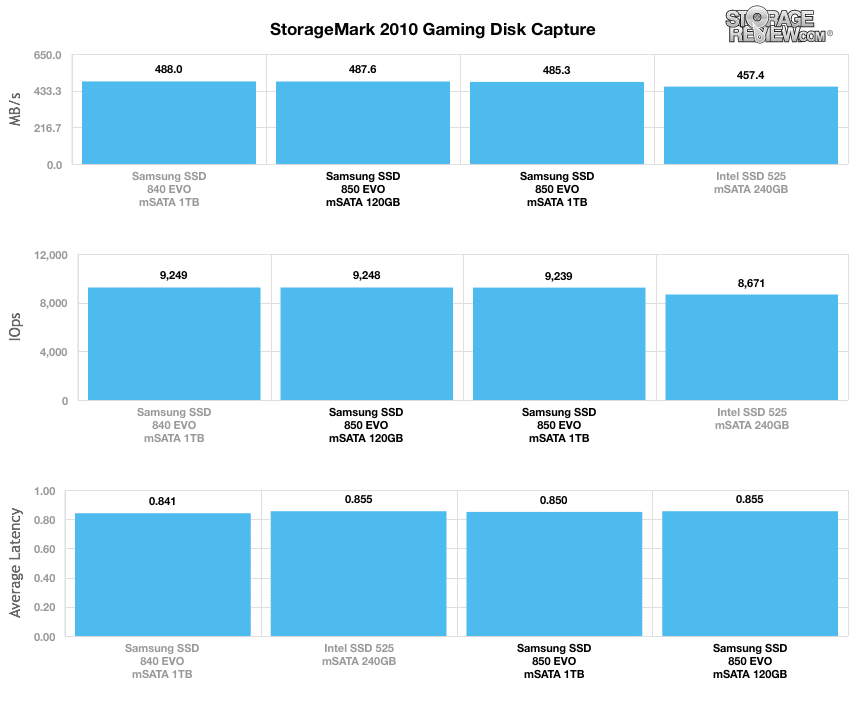
Our third real-life test covers disk activity in a gaming environment. Unlike the HTPC or Productivity trace, this one relies heavily on the read performance of a drive. To give a simple breakdown of read/write percentages, the HTPC test is 64% write, 36% read, the Productivity test is 59% write and 41% read, while the gaming trace is 6% write and 94% read. The test consists of a Windows 7 Ultimate 64-bit system pre-configured with Steam, with Grand Theft Auto 4, Left 4 Dead 2, and Mass Effect 2 already downloaded and installed. The trace captures the heavy read activity of each game loading from the start, as well as textures as the game progresses. In this trace we recorded 426MB being written to the drive and 7,235MB being read.
In our read-intensive Gaming trace, the Samsung 850 EVO drives had very similar results, all of which were impressive. The 840 EVO had nearly identical results as well.
Power
Our power tests showed noticeable lower consumption with the 850 EVO mSATA drives when compared to the 840 model. The 120GB 840 EVO showed an idle reading of only 0.32W, read consumption of 2.34 and a write consumption of 2.15. Our 1TB model was expectedly higher, with 0.33W idle, 3.78W read, and 3.1W write. The 840 EVO 1TB showed an idle reading of 0.44 with a read and write consumption of 4.32W and 3.68W respectively.
Conclusion
Built for small form factor computing, embedded applications, and ultra-thin PCs and desktops, the Samsung 850 EVO mSATA SSD is a supplement to the 2.5″ 850 EVO line, both of which feature Samsung’s innovative 3D V-NAND technology. This technology allows the tiny drive to maximize its computing performance and focus on reliability. In addition, the 850 EVO mSATA features the Device Sleep functionality, enabling it to operate idly with a highly efficient 2mW. This is a very attractive feature, as maximizing battery life in mobile computing devices is always sought after and this is where the Samsung 850 EVO mSATA form factor will be its primary residence.
From a performance perspective, this little guy packs a form punch, which is highlighted by its solid showing in our smaller file consumer synthetic workloads. In our 4k random transfers, the Samsung EVO mSATA posted 9,352.90 IOPS read activity and 28,478.72 IOPS write, the latter score being the top performer. The 850 EVO mSATA also had the top read activity in the 4k random trace among the tested drives, with the 120GB model posting an impressive 9,981.55 IOPS read. Its predecessor (840 EVO), however, outperformed both 850 capacities in the 2MB random and sequential benchmarks by a noticeable margin.
Our Real-World Benchmarks showed inconsistent results overall. For example, during the HTPC and gaming traces, the 1TB model posted results that placed it in the middle of the pack, while the 120GB model registered numbers at the bottom. However, when looking at the Productivity trace, 1TB mSATA dominated is competition, boasting 13,594.17 IOPS, 400.43MB/s, and 0.577ms in average latency. That being said, its 120GB brethren had significantly slower results. Though its performance was a bit uneven at times, its power ratings were very consistent. Here, we recorded noticeably more efficient consumption when compared to the 840 EVO mSATA, which was headlined by the 120GB model best-of-class results.
Ultimately there are very few options when it comes to unique form factors like mSATA. Samsung has largely done well with the 850 EVO though, making it a good choice in a market segment bereft of opportunity. Those with ultra-thin computers will be thrilled to have a modern mSATA SSD option and specialized devices that need embedded storage can now incorporate a 1TB drive that provides excellent large block sequential throughput without the expense associated with the enterprise counterparts. In total, the 850 EVO strengthens Samsung’s grip on this market with good performance and much improved power consumption.
Pros
- Very power efficient
- Overall strong performance
- 1TB of flash in very small form-factor
Cons
- The older EVO 840 EVO mSATA outperformed it in some categories
Bottom Line
The 850 EVO strengthens Samsung’s grip on the mSATA SSD market with good performance and even lower power consumption.
Samsung 850 EVO mSATA SSD at Amazon

