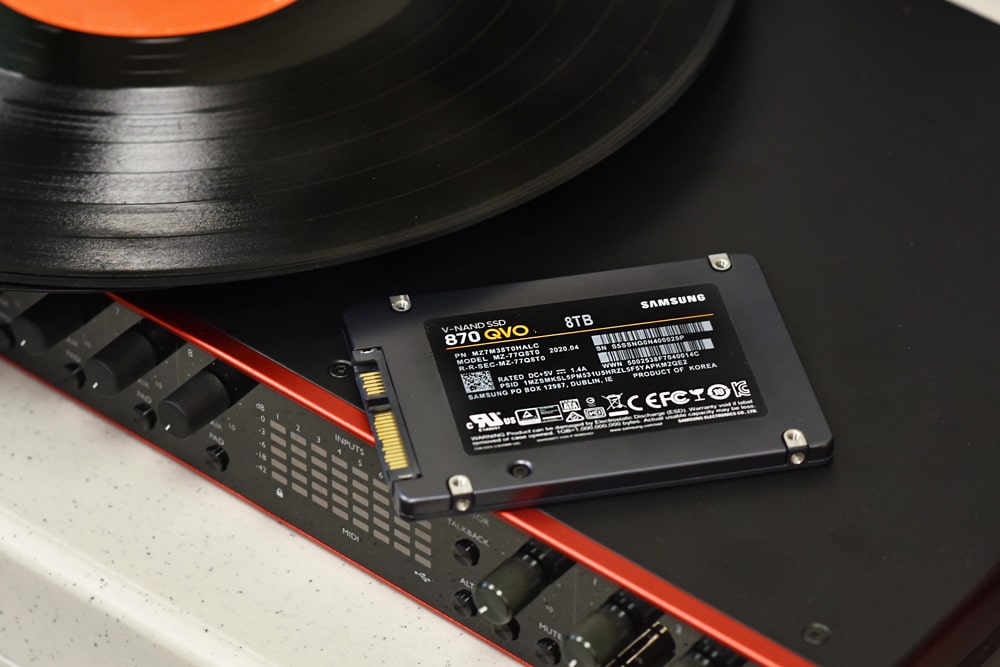
Earlier this year Samsung released its 870 QVO SATA SSD. This SSD is composed of its second- generation quad-level cell (QLC) flash technology. We have already reviewed the 1TB and 4TB models of the drive. One of the big benefits of QLC is that it is less expensive than TLC and you can get higher capacities to replace legacy HDD. That is what we are looking at today in the 8TB.
Earlier this year Samsung released its 870 QVO SATA SSD. This SSD is composed of its second- generation quad-level cell (QLC) flash technology. We have already reviewed the 1TB and 4TB models of the drive. One of the big benefits of QLC is that it is less expensive than TLC and you can get higher capacities to replace legacy HDD. That is what we are looking at today in the 8TB.
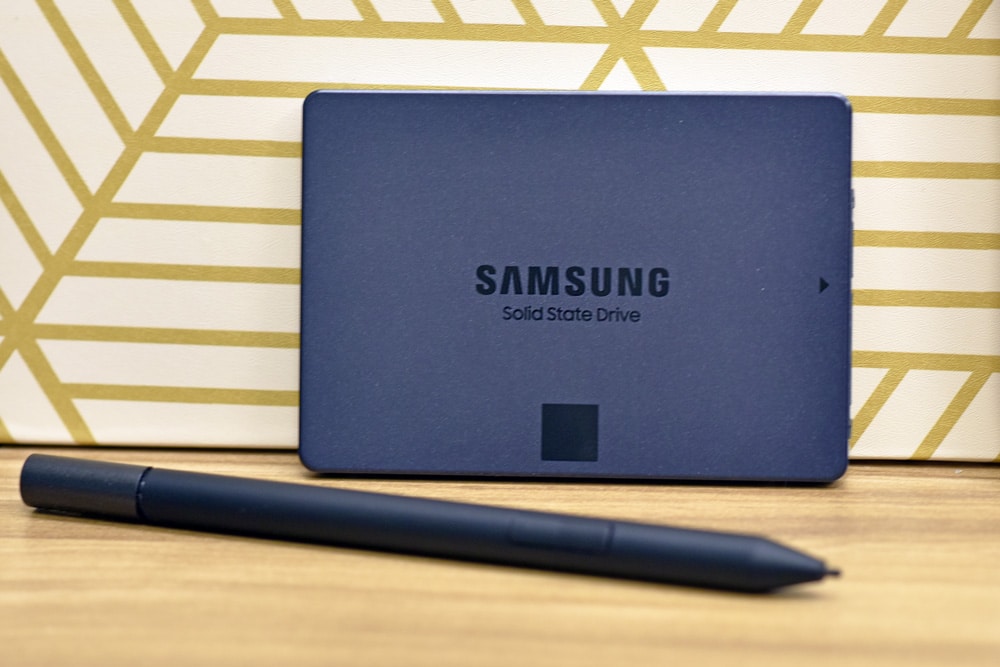
A quick recap of QLC technology, it has been around for roughly two and a half years now (out in the market, anyway). It allows vendors to add roughly 1/3 more density into their flash drives making larger capacity SSDs at a lower cost. We have seen a few performance hiccups along the way, but these drives more than outperform their HDD equivalents. QLC drives are even more attractive to the average portable PC user as they promise a best of both worlds approach with higher capacity in a 2.5″ form factor and better performance than any hard drive.
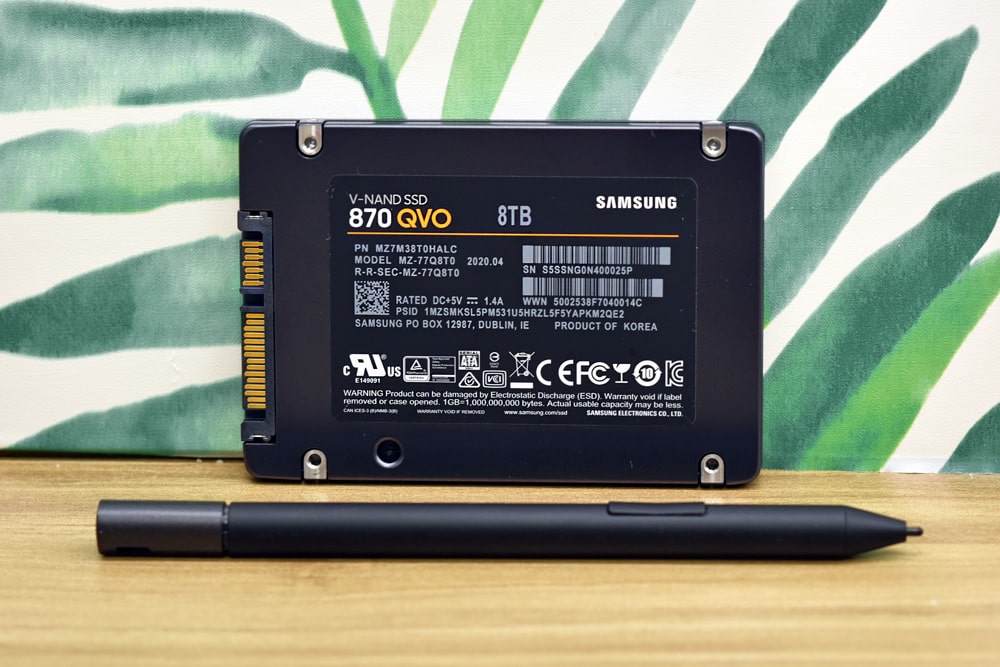
Like all of the Samsung 870 QVO line, the 8TB is said to speeds up to 560MB/s and maintain them through its Intelligent TurboWrite technology that leverages a large variable SLC buffer. In this generation the company increased random reads which is ideal for the given use cases of this type of drive. As a drop-in replacement, users can leverage Samsung Magician 6 while upgraded or optimizing this drive.
The Samsung 870 QVO comes with a 3-year limited warranty, the 8TB version can be picked up for $899.99.
Samsung 870 QVO Specifications
| Interface | SATA 6 Gbps |
| Form Factor | 2.5-inch |
| Storage Memory | Samsung V-NAND 4-bit MLC (QLC) |
| Controller | Samsung MKX Controller |
| DRAM | 8GB LPDDR4 (8TB) 4GB LPDDR4 (4TB) 2GB LPDDR4 (2TB) 1GB LPDDR4 (1TB) |
| Capacity | 8TB, 4TB, 2TB, 1TB |
| Sequential Read/Write Speed | Up to 560/530 MB/s |
| Random Read/Write Speed | Up to 98K/88K IOPS |
| Management Software | Samsung Magician |
| Total Bytes Written | 2,880TB (8TB) 1,440TB (4TB) 720TB (2TB) 360TB (1TB) |
| Warranty | Three-year limited warranty |
Performance
Testbed
The test platform leveraged in these tests is a Dell PowerEdge R740xd server. We measure SAS and SATA performance through a Dell H730P RAID card inside this server, although we set the card in HBA mode only to disable the impact of RAID card cache. NVMe SSDs are tested natively through an M.2 to PCIe adapter card. The methodology used better reflects end-user workflow with the consistency, scalability and flexibility testing within virtualized server offers. A large focus is put on drive latency across the entire load range of the drive, not just at the smallest QD1 (Queue-Depth 1) levels. We do this because many of the common consumer benchmarks don’t adequately capture end-user workload profiles.
To more appropriately test the QLC-based SSDs we modified our consumer testing methodology to better reflect how these drives are designed to work out in the field. Compared to MLC or even TLC products, QLC-based SSDs have a very small continuous write ability. QLC SSDs mitigate this through adaptive SLC caching, but the short version of the story is after writing 10-15GB of data to the SSD at once, write speeds will drop from 500MB/s down to 100MB/s. Manufacturers see this drive instead working in burst activity, where users mostly read data from the drive, or write in chunks, allowing the drive to stay in the faster performance zone. To accommodate this workload, we modified our testing process to partition 1% of the drive surface, instead of 5% that we would traditionally test for a consumer product. In the case of the 8TB Samsung 870 QVO, this gives us a testing footprint of 80GB. We also don’t do a 100% prefill of the SSD before starting our workloads for QLC SSDs.
For comparison, we are comparing the new drives we have to the previous generation of Samsung QVO, the Samsung QVO 860 and the previous Samsung QVO 870 drive. This makes a better comparison, versus running it up against the other QLC drives we have in stock that leverage the NVMe interface.
VDBench Workload Analysis
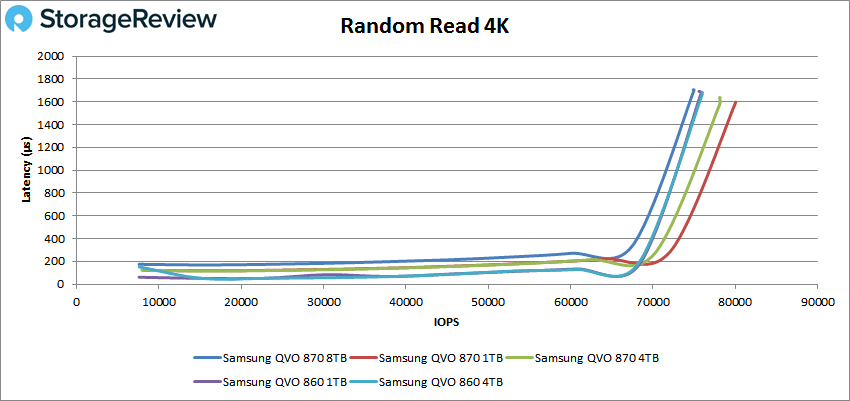
In our first VDBench Workload Analysis, we looked at random 4K read performance. The Samsung QVO 870 8TB came in last with a peak performance of 75,599 IOPS at a latency of 1.7ms.
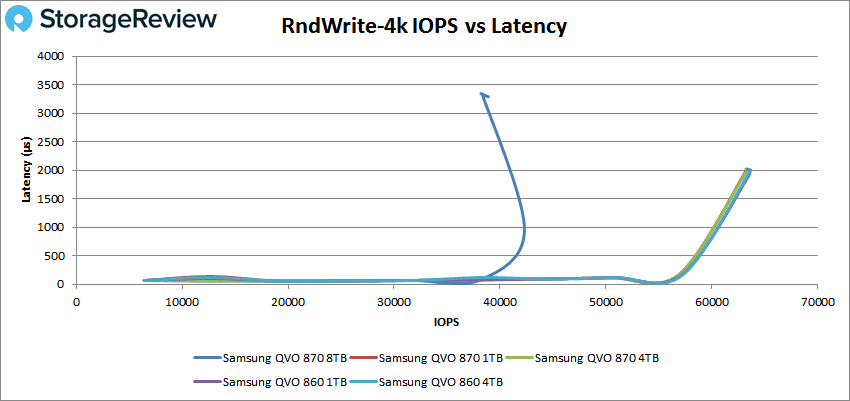
 In 4K write the 8TB was much farther in the back with a peak of roughly 42K at 1ms before dropping off some.
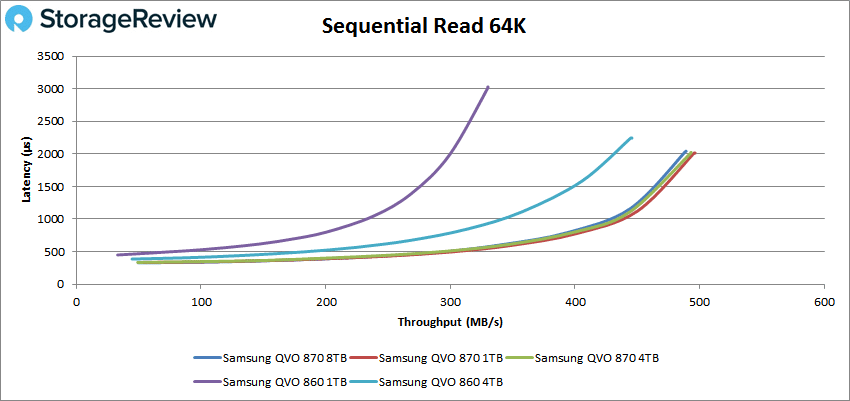
 Switching over to sequential workloads, we first look at 64K read. Here the 8TB performed much better coming in third behind the other 870 drives with a peak of 7,819 IOPS or 493MB/s with a latency of 2ms.
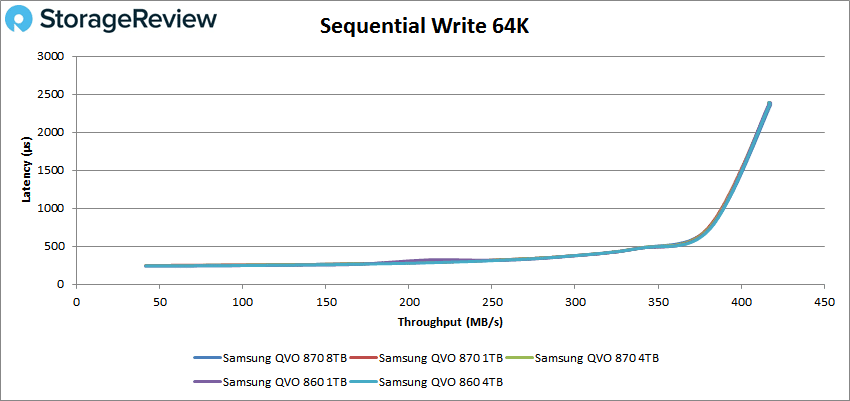
 64K write saw all of the drives run together at peak. The 8TB had a peak of 6,683 IOPS or 417MB/s at a latency of 2.4ms.
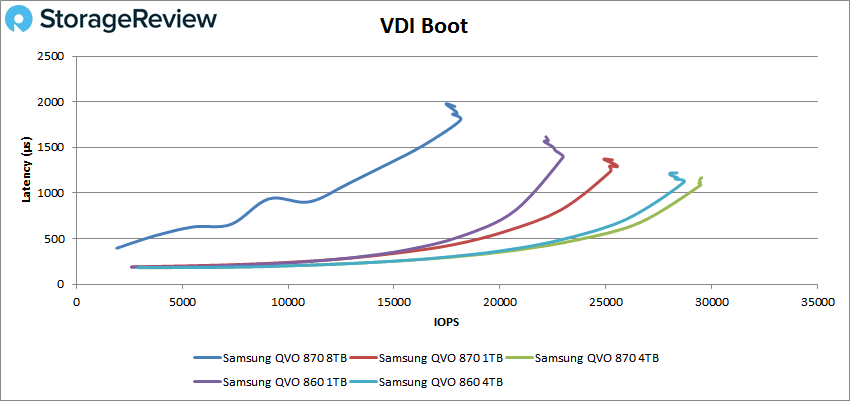
 Next, we looked at our VDI benchmarks, which are designed to tax the drives even further. These tests include Boot, Initial Login, and Monday Login. Looking at the Boot test, 8TB dropped to the bottom again with a peak of 18,130 IOPS with a latency of 1.8ms before dropping off some.
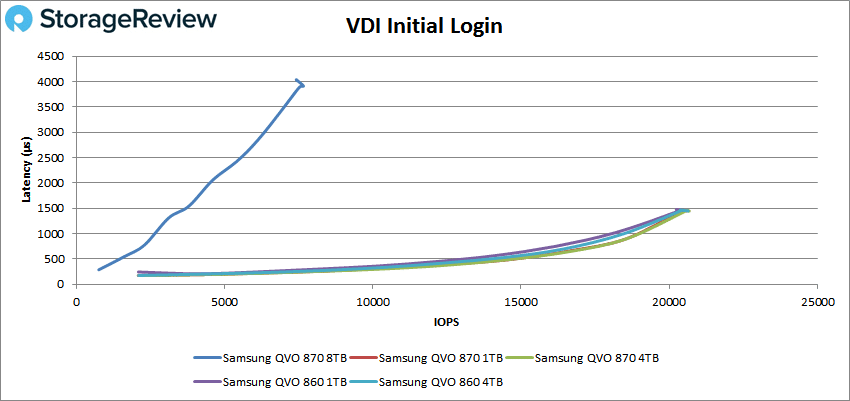
 VDI Initial Login probably showed the worst performance for the 8TB model seeing it trail the rest of the pack with much higher latency throughout. It peaked at 7,659 IOPS with a latency of 3.9ms.
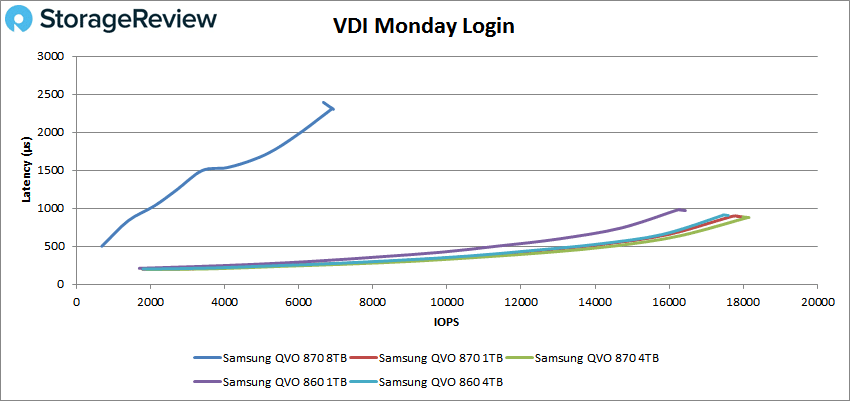
 VDI Monday Login had once more at the bottom with a peak of 6,935 IOPS with a latency of 2.3ms.
 Conclusion
The second-generation of QLC gives Samsung a way to pack more density in the same footprint. This is best highlighted by the Samsung 870 QVO 8TB SSD. Using the SATA interface, the drive can hit up to 560MB/s read and up to 530MB/s write. Users can use this massive capacity to replace aging HDD’s for a good performance boost without sacrificing capacity.
For performance we ran our VDBench tests. The 8TB SSD didn’t do so great comparatively. The smaller capacities in the 870 line give better performance. But one must keep in mind that this drive is an HDD replacement, and in that case the performance is much better than HDDs. Highlights include 76K IOPS in 4K read, 42K IOPS in 4K write, 493MB/s in 64K read, and 417MB/s in 64K write. In our VDI benchmarks we saw 18K IOPS in boot, 7,600 IOPS in Initial Login, and 6,900 IOPS in Monday Login.
While the Samsung 870 QVO 8TB SSD won’t set any records for performance (nor will any QLC drive though), it does bring a lot of capacity at significant boost in performance compared to HDDs. There is still a price premium of nearly 6x, so it will have to fall into specific needs on whether to get an 8TB HDD or this 8TB SSD.
Samsung 870 QVO 8TB SSD on Amazon
Engage with StorageReview
Newsletter | YouTube | Podcast iTunes/Spotify | Instagram | Twitter | Facebook | RSS Feed

