
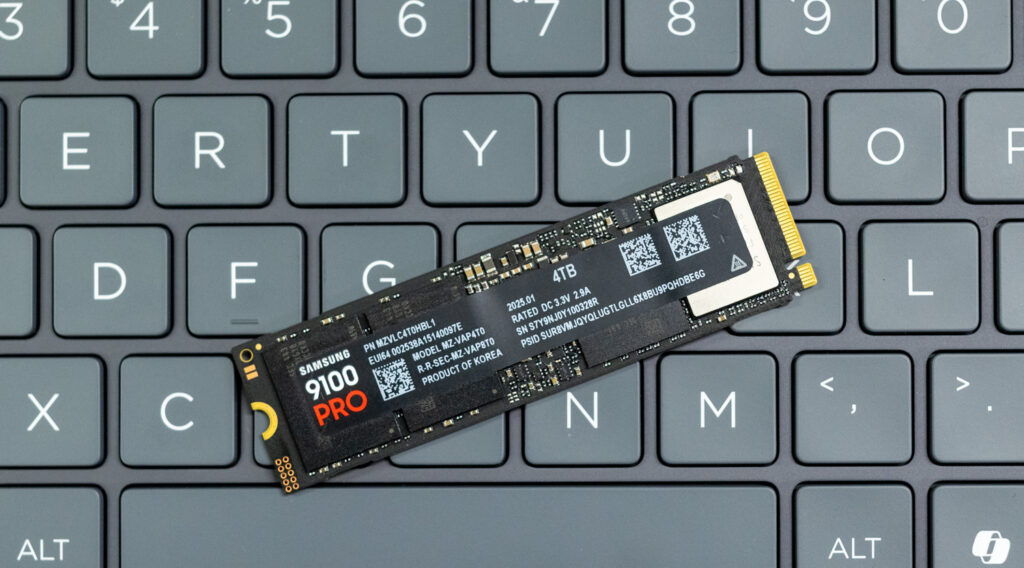
Samsung 9100 Pro SSD review: Gen5 speed, massive 8TB capacity, powerful Presto controller—ideal for prosumers, gamers, and creators.
Samsung’s 9100 Pro is the company’s first Gen5 x4 SSD, and they’re aiming high with this one. This drive is built for power users — whether dealing with AI models, editing massive 8K video files, or trying to shave every possible second off game load time. Samsung says it’s designed to set a new standard for both speed and capacity. With AI workloads and demanding apps becoming the norm, the 9100 Pro looks ready to handle it all. It’s also built to be future-proof, offering high-performance storage that will stay relevant for years.
While that sounds impressive, we’re excited to test the 9100 Pro and see how it performs in our benchmarks below.
Samsung 9100 Pro Build
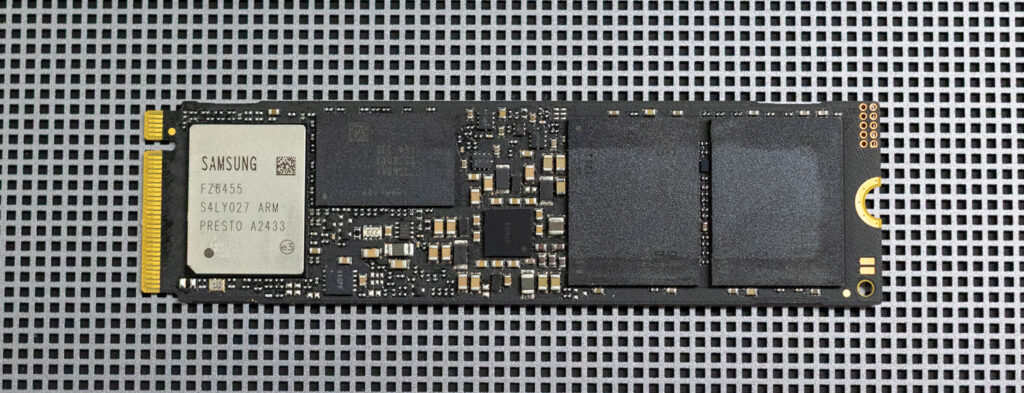
At the heart of the SSD is Samsung’s Presto controller, a 5nm in-house design that pushes the limits of PCIe Gen5, delivering sequential read speeds of up to 14,800MB/s and write speeds of up to 13,400MB/s. That’s nearly double the performance of its predecessor, the 990 Pro. It also boasts significantly improved random read and write speeds—up to 2,200K and 2,600K IOPS — crucial for workloads requiring rapid access to small files, like AI inference, video editing, and game asset streaming.
The drive is designed to load large AI models almost instantly, reducing LLM loading times by half compared to PCIe Gen4 SSDs. While real-world performance will depend on system compatibility and workload, the numbers indicate this SSD will be a top performer across a wide range of use cases.
Samsung has equipped the 9100 Pro with its latest eighth-generation V-NAND (TLC), ensuring high endurance and reliability, while Intelligent TurboWrite 2.0 dynamically allocates an SLC buffer for faster write speeds. Capacities range from 1TB to a massive 8TB, a first for Samsung’s consumer SSDs, catering to professionals who need high-capacity, high-speed storage. Gamers will appreciate the ability to store a massive library of titles on this speedy drive — though some of you will still find a way to fill up all 8TB with that ever-growing backlog.
Samsung 9100 Pro vs. 990 Pro and 990 EVO
Samsung’s shift from the 990 series to the 9100 Pro marks a significant performance and positioning upgrade. The 9100 Pro is the first consumer SSD from Samsung to support PCIe Gen5, doubling the available bandwidth over the PCIe Gen4-based Samsung 990 Pro and the mixed PCIe Gen4/5 x2 interface of the Samsung 990 EVO. This gives the 9100 Pro a massive edge in sequential and random performance, especially for AI and high-throughput workloads.
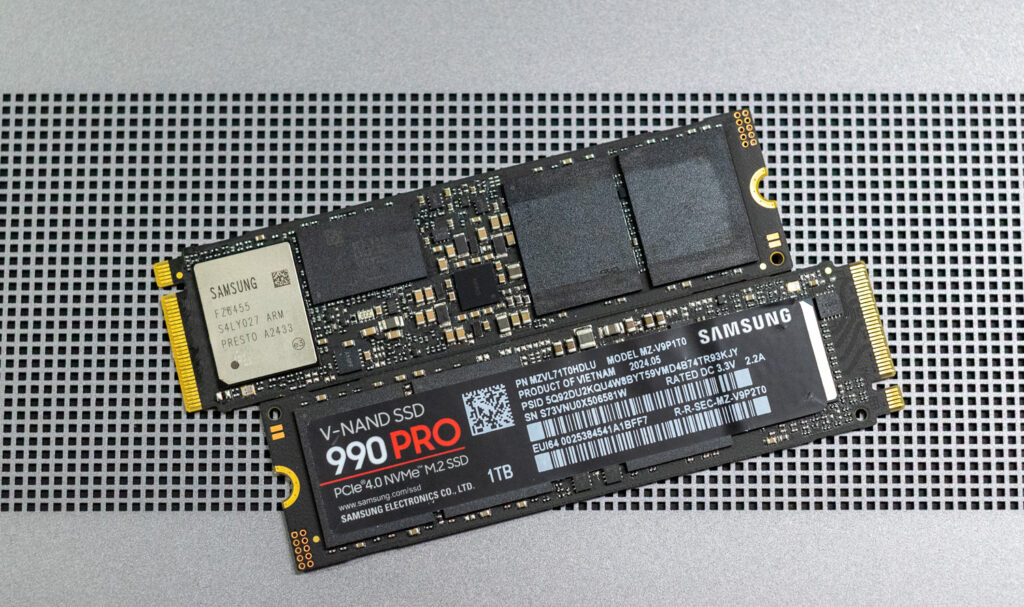
Another major distinction is storage capacity. The 9100 Pro supports up to 8TB, surpassing other competing high-performance SSDs. 8TB doubles the maximum offered by the 990 Pro (which tops out at 4TB) and quadruples the capacity of the 990 EVO (which maxes out at 2TB). This makes the 9100 Pro more suited for large-scale data handling, AI model processing, and high-resolution media editing.
The Presto controller used in the 9100 Pro is an upgrade from the Pascal-based controllers in the 990 Pro and EVO. It’s built on a more efficient 5nm process (compared to the 990 Pro’s 8nm), which improves heat management and power efficiency — Samsung claims a 49% improvement over the 990 Pro. The 9100 Pro also features enhanced thermal control, with an optional heatsink version available for better-sustained performance under heavy loads.
The Samsung 990 EVO uses TLC NAND and features a more cost-effective design with HMB (Host Memory Buffer) instead of dedicated DRAM, allowing it to hit competitive performance levels for mainstream use. While it’s not in the same league as the high-performance 990 Pro or the next-gen 9100 Pro, it’s still an excellent choice for casual users and lighter workloads.
Here’s a detailed rundown of how these Samsung drives compare.
| Feature | 9100 Pro | 990 Pro | 990 EVO |
| Launch Year | 2025 | 2022 | 2023 |
| Interface | PCIe Gen5 x4 | PCIe Gen4 x4 | PCIe Gen4 x4 / Gen5 x2 |
| NAND Type | 8th Gen V-NAND TLC | 7th Gen V-NAND TLC | 7th Gen V-NAND TLC |
| Controller | Presto (5nm) | Pascal (8nm) | In-house (Pascal-Lite) |
| Max Capacity | Up to 8TB | Up to 4TB | Up to 2TB |
| Sequential Read/Write | Up to 14,800 MB/s / 13,400 MB/s | Up to 7,450 MB/s / 6,900 MB/s | Up to 5,000 MB/s / 4,200 MB/s |
| Random Read/Write | Up to 2,200K / 2,600K IOPS | Up to 1,600K / 1,550K IOPS | Up to 700K / 800K IOPS |
| Power Efficiency | 49% higher vs. 990 Pro | Improved vs. 980 Pro | Up to 70% better than 970 EVO Plus |
| Endurance (TBW) | Up to 4,800 TB | Up to 2,400 TB | Up to 1,200 TB |
| Heatsink Option | Yes | Yes | No |
| Target Audience | High-end prosumers, AI, 8K video, content creation | High-performance gaming, professional workloads | Mainstream users, casual gaming, general use |
Samsung 9100 Pro: Power Efficiency and Thermal Management
Samsung claims a 49% improvement in power efficiency over the 990 Pro. This is especially important for laptops and AI-optimized PCs, where balancing power and performance is critical.
Heat management is also well handled—while the standard model features firmware-based thermal control, the heatsink version is designed to keep performance steady under prolonged loads. The slim design (8.8mm for lower capacities and 11.25mm for the 8TB variant) ensures compatibility with desktops, laptops, and PlayStation 5 consoles.
Samsung 9100 Pro: Security and Software Support
The Samsung 9100 Pro security features cover all the essentials for keeping your data safe. AES 256-bit encryption protects your data by converting it into an unreadable format without the proper key. TCG Opal 2.0 compliance provides hardware-based encryption, which is beneficial for enterprise use. Microsoft eDrive support integrates with Windows BitLocker for easy setup and secure drive management.
Samsung’s Magician software continues to be one of the most comprehensive SSD management tools available. It allows users to update firmware, monitor drive health, and adjust settings for optimal performance.
Backed by a 5-year warranty, we’ll test the 4TB model for this review, as the 8TB version isn’t set to launch until the third quarter of 2025.
Samsung 9100 Pro Specifications
| Feature | 1TB | 2TB | 4TB | 8TB | |
| Interface | PCIe Gen5 x4, NVMe 2.0 | ||||
| Form Factor | M.2 (2280) / M.2 (2280 with Heatsink) | ||||
| Hardware | NAND | Samsung V-NAND TLC (V8) | |||
| Controller | Samsung Presto (5nm) | ||||
| Cache Memory | 1GB LPDDR4X | 2GB LPDDR4X | 4GB LPDDR4X | 8GB LPDDR4X | |
| Performance | Sequential Read/Write (MB/s) | 14,700 / 13,300 | 14,700 / 13,400 | 14,800 / 13,400 | 14,800 / 13,400 |
| Random Read/Write (IOPS, QD32) | 1,850K / 2,600K | 1,850K / 2,600K | 2,200K / 2,600K | 2,200K / 2,600K | |
| Power | Active (Read/Write) | 7.6W / 7.2W | 8.1W / 7.9W | 9.0W / 8.2W | TBD |
| Device Sleep (L1.2) | 4.0mW / 3.3mW | 4.8mW / 4.0mW | 6.5mW / 5.7mW | TBD | |
| Intelligent TurboWrite 2.0 | 114GB | 226GB | 442GB | TBD | |
| Data Encryption | AES 256-bit, TCG/Opal 2.0, Microsoft eDrive | ||||
| Total Bytes Written (TBW) | 600 TB | 1,200 TB | 2,400 TB | 4,800 TB | |
| Warranty | 5-Year Limited Warranty | ||||
| Compatibility | Operating Systems | Windows 10, Windows 11, Linux, macOS | |||
| Gaming Consoles | Compatible with PlayStation 5 | ||||
| Heatsink Thickness | 8.8mm | 11.25mm | |||
| Price (Standard) | $199.99 | $299.99 | $549.99 | TBD | |
| Price (Heatsink) | $219.99 | $319.99 | $569.99 | TBD | |
Samsung 9100 Pro Performance
Before diving into the benchmarks, here’s a list of comparable drives tested alongside the Samsung 9100 Pro and their respective PCIe generation:
- Crucial T705 (PCIe Gen5)
- Crucial P310 (PCIe Gen3)
- Samsung 990 Pro (PCIe Gen4)
- WD SN850X (PCIe Gen4)
We’ll put these drives through various tests to evaluate real-world and synthetic performance. This includes LLM load times to measure how quickly they handle large AI models, DirectStorage tests to see how fast they load game assets and process in-game data, and Blackmagicdesign to assess read and write speeds for high-resolution video editing. We’ll also run PCMark 10 to gauge overall system responsiveness, 3DMark Storage to test gaming performance, and FIO tests to measure peak sequential and random read/write speeds under heavy workloads.
Here’s the high-performance test rig we used for benchmarking:
- CPU: AMD Ryzen 7 9800X3D
- Motherboard: Asus ROG Crosshair X870E Hero
- RAM: G.SKILL Trident Z5 Royal Series DDR5-6000 (2x16GB)
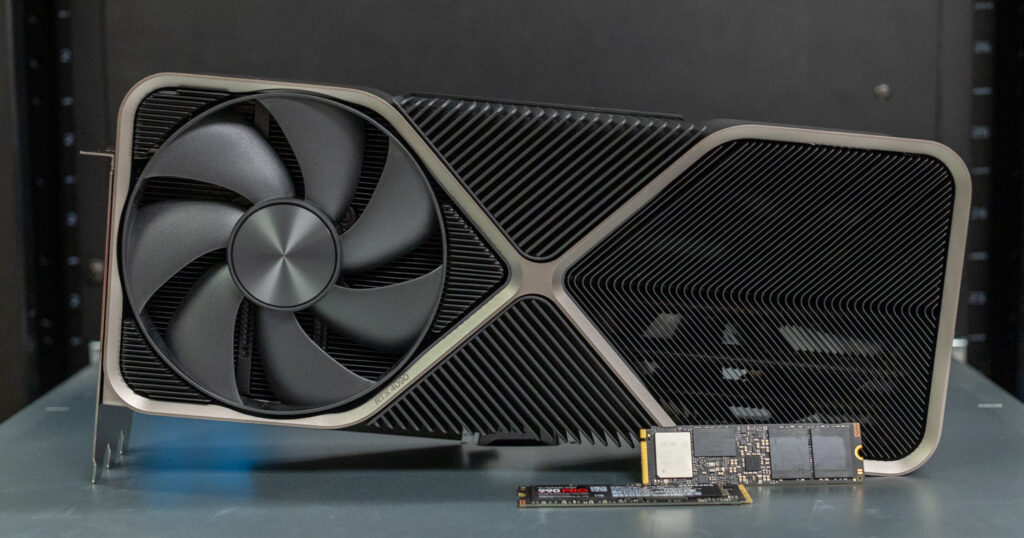
- GPU: NVIDIA GeForce RTX 4090
- OS: Windows 11 Pro, Ubuntu 24.10 Desktop
Peak Synthetic Performance
The FIO test is a flexible and powerful benchmarking tool used to measure the performance of storage devices, including SSDs and HDDs. It evaluates metrics such as bandwidth, IOPS (Input/Output Operations Per Second), and latency under different workloads, like sequential and random read/write operations. This test helps to assess the peak performance of storage systems, making it useful for comparing different devices or configurations. We measured the peak burst performance for this test, limiting the workload to a 10GB footprint on both SSDs.
Here, the Samsung 9100 Pro showed its Gen5 sequential read performance, posting an impressive 14,600 MB/s—edging out even the Crucial T705 by 200 MB/s. However, its higher average latency of 1.92ms suggests that the controller prioritizes throughput over responsiveness, which could slightly affect real-world performance in mixed workloads. In comparison, the Crucial T705 maintained lower latency, which explains why it still leads in some responsiveness-focused tasks. Despite this, the 9100 Pro’s raw speed is exceptional, especially for handling large file transfers, 8K video files, and game loading.
| FIO Test (higher MB/s/IOPS Is better) | Crucial P3 Plus 2TB | Crucial T705 2TB | Samsung 990 Pro 2TB | Samsung 9100 Pro 4TB | WD sn850x 2TB |
|---|---|---|---|---|---|
| Sequential 128K Read (2T/64Q) | 7,197 MB/s (1.16ms avg latency) | 14,400 MB/s (0.58ms avg latency) | 7,483 MB/s (1.12ms avg latency) | 14,600 MB/s (1.92ms avg latency) | 6,632 MB/s (0.76ms avg latency) |
| Sequential 128K Write (2T/64Q) | 6,376 MB/s (1.31ms avg latency) | 12,300 MB/s (0.68ms avg latency) | 7,197 MB/s (1.16ms avg latency) | 13,300 MB/s (2.15ms avg latency) | 7,235 MB/s (0.92ms avg latency) |
| Random 4K Read (16T/32Q) | 1.163M IOPS (0.44ms avg latency) | 1.585M IOPS (0.32ms avg latency) | 1.400M IOPS (0.36ms avg latency) | 2.734M IOPS (0.18ms avg latency) | 1.2M IOPS (0.43ms avg latency) |
| Random 4K Write (16T/32Q) | 1.196M IOPS (0.43ms avg latency) | 2.703M IOPS (0.19ms avg latency) | 1.403M IOPS (0.36ms avg latency) | 2.734M IOPS (0.19ms avg latency) | 825K IOPS (0.62ms avg latency) |
Average LLM Load Time
The Average LLM Load Time test evaluated the load times of three different LLMs: DeepSeek R1 7B, Meta Llama 3.2 11B, and DeepSeek R1 32B. Each model was tested 10 times, and then calculated the average load time. This test measures how quickly the drive can load large language models (LLMs) into memory. LLM load times are critical for AI-related tasks, especially for real-time inference and large dataset processing. Faster loading means the model is ready to process data more quickly, improving AI responsiveness and reducing waiting time.
The Samsung 9100 Pro performed exceptionally well, trailing only the Crucial T705. In the DeepSeek R1 7B test, the 9100 Pro loaded the model in 2.9726 seconds, a noticeable improvement over the 990 Pro and the PCIe 4.0-based WD SN850X. When working with larger models like Meta Llama 3.2 11B and DeepSeek R1 32B, the 9100 Pro consistently outperformed the 990 Pro by around 10% and outpaced the SN850X by an even more significant margin.
While the Crucial T705 holds a slight edge, the 9100 Pro’s consistency across different model sizes highlights its strong balance of speed and efficiency.
| Average LLM Load Time (lower is better) | Crucial P310 2TB | Crucial T705 2TB | Samsung 990 Pro 2TB | Samsung 9100 Pro 4TB | WD SN850X 2TB |
| DeepSeek R1 7B | 3.7451s | 2.7884s | 3.2962s | 2.9726s | 3.5196s |
| Meta Llama 3.2 11B Vision | 5.5611s | 4.3654s | 4.9916s | 4.5429s | 5.2433s |
| DeepSeek R1 32B | 5.8027s | 4.4755s | 5.3801s | 4.6311s | 5.5226s |
3DMark Direct Storage
The 3DMark DirectStorage Feature Test evaluates how Microsoft’s DirectStorage optimizes game asset loading on PCIe SSDs. By reducing CPU overhead and improving data transfer speeds, DirectStorage enhances loading times, especially when paired with GDeflate compression and Windows 11’s BypassIO. This test isolates storage performance to highlight the potential bandwidth improvements when DirectStorage is enabled.
The Samsung 9100 Pro performed strongly in DirectStorage tests. In the GDeflate Compression test, the 9100 Pro hit 23.77 GB/s, nearly matching the Crucial T705 and far exceeding the 990 Pro and WD SN850X. This indicates the 9100 Pro can handle large, compressed game assets with minimal delay—critical for open-world games and real-time asset streaming.
When DirectStorage was turned off, the 9100 Pro maintained solid scores, outperforming the 990 Pro and SN850X by around 1%–5%. In the storage to RAM test, the 9100 Pro hit 11.62 GB/s with DirectStorage on—almost double the performance of PCIe 4.0 drives—proving it’s well-optimized for large-scale memory transfers.
| 3DMark Direct Storage (higher is better) | Crucial P310 2TB | Crucial T705 2TB | Samsung 990 Pro 2TB | Samsung 9100 Pro 4TB | WD SN850X 2TB |
| Storage to VRAM (GDeflate Compression) | 14.81 GB/s | 25.75 GB/s | 14.18 GB/s | 23.77 GB/s | 15.28 GB/s |
| Storage to VRAM (DirectStorage on, Uncompressed) | 10.75 GB/s | 10.71 GB/s | 11.28 GB/s | 11.26 GB/s | 11.11 GB/s |
| Storage to VRAM (DirectStorage off, Uncompressed) | 8.56 GB/s | 8.79 GB/s | 8.84 GB/s | 8.92 GB/s | 8.93 GB/s |
| Storage to RAM (DirectStorage on, Uncompressed) | 6.46 GB/s | 12.03 GB/s | 6.57 GB/s | 11.62 GB/s | 6.78 GB/s |
| Storage to RAM (DirectStorage off, Uncompressed) | 5.87 GB/s | 8.83 GB/s | 6.20 GB/s | 9.48 GB/s | 6.27 GB/s |
| GDeflate Decompression Bandwidth | 65.43 GB/s | 66.36 GB/s | 65.71 GB/s | 66.61 GB/s | 64.96 GB/s |
Blackmagic Disk Speed Test
The Blackmagic Disk Speed Test benchmarks a drive’s read and write speeds, estimating its performance, especially for video editing tasks. It helps users ensure their storage is fast enough for high-resolution content, like 4K or 8K video.
The 9100 Pro delivered impressive results in the Blackmagicdesign benchmark, with a read speed of 9,542.3 MB/s and a write speed of 9,907.9 MB/s—nearly double the performance of the 990 Pro and WD SN850X. While the Crucial T705 holds the lead in read performance, the 9100 Pro’s write speed is nearly 1GB/s faster, and its read speed isn’t far behind. This level of performance will translate into faster render times, smoother playback, and a more efficient workflow for professional video editors handling 4K and 8K content.
| Blackmagicdesign (higher is better) | Crucial P310 2TB | Crucial T705 2TB | Samsung 990 Pro 2TB | Samsung 9100 Pro 4TB | WD SN850X 2TB |
| Read MB/s | 5,282.4 MB/s | 8,464.2 MB/s | 5,769.5 MB/s | 9,542.3 MB/s | 5,862.6 MB/s |
| Write MB/s | 5,458.9 MB/s | 10,256.4 MB/s | 5,842.9 MB/s | 9,907.9 MB/s | 5,894.8 MB/s |
PCMark10 Storage
PCMark 10 Storage Benchmarks evaluate real-world storage performance using application-based traces. They test system and data drives, measuring bandwidth, access times, and consistency under load. These benchmarks provide practical insights beyond synthetic tests, helping users compare modern storage solutions effectively.
Here, the 9100 Pro posted a strong score of 7,552, outperforming the 990 Pro and WD SN850X by around 5%–10%. While the T705 leads—likely due to firmware optimizations and more responsive tuning—the 9100 Pro’s balanced performance proves it can handle demanding multitasking and heavy workloads without bottlenecks.
| PCMark 10 Data Drive (higher is better) | Crucial P310 2TB | Crucial T705 2TB | Samsung 990 Pro 2TB | Samsung 9100 Pro 4TB | WD SN850X 2TB |
| Overall Score | 6,436 | 8,783 | 7,173 | 7,552 | 4,988 |
3DMark Storage
The 3DMark Storage Benchmark tests your SSD’s gaming performance by measuring tasks like loading games, saving progress, installing game files, and recording gameplay. It evaluates how well your storage handles real-world gaming activities and supports the latest storage technologies for accurate performance insights.
In this test, the 9100 Pro put up a solid score of 4,779, comfortably beating the 990 Pro by around 16% and the WD SN850X by nearly 20%. It failed to catch the Crucial T705, which leads with a score of 5,100, but the gap isn’t huge. What’s impressive here is how close the 9100 Pro gets despite slightly higher latency in other tests. This could mean that Samsung has tuned the drive very well for gaming workloads, which can translate into faster load times, smoother asset streaming in open-world games, and quick transitions between game environments.
| 3DMark Storage benchmark (higher is better) | Crucial P310 2TB | Crucial T705 2TB | Samsung 990 Pro 2TB | Samsung 9100 Pro 4TB | WD SN850X 2TB |
| Overall Score | 3,848 | 5,100 | 4,128 | 4,779 | 3,962 |
GPU Direct Storage
One of the tests we conducted on this testbench was the Magnum IO GPU Direct Storage (GDS) test. GDS is a feature developed by NVIDIA that allows GPUs to bypass the CPU when accessing data stored on NVMe drives or other high-speed storage devices. Instead of routing data through the CPU and system memory, GDS enables direct communication between the GPU and the storage device, significantly reducing latency and improving data throughput.
How GPU Direct Storage Works
Traditionally, when a GPU processes data stored on an NVMe drive, the data must first travel through the CPU and system memory before reaching the GPU. This process introduces bottlenecks, as the CPU becomes a middleman, adding latency and consuming valuable system resources. GPU Direct Storage eliminates this inefficiency by enabling the GPU to access data directly from the storage device via the PCIe bus. This direct path reduces the overhead associated with data movement, allowing faster and more efficient data transfers.
AI workloads, especially those involving deep learning, are highly data-intensive. Training large neural networks requires processing terabytes of data, and any delay in data transfer can lead to underutilized GPUs and longer training times. GPU Direct Storage addresses this challenge by ensuring that data is delivered to the GPU as quickly as possible, minimizing idle time and maximizing computational efficiency.
In addition, GDS is particularly beneficial for workloads that involve streaming large datasets, such as video processing, natural language processing, or real-time inference. By reducing the reliance on the CPU, GDS accelerates data movement and frees up CPU resources for other tasks, further enhancing overall system performance.
Testing Configuration Matrix
We systematically tested every combination of the following parameters:
- Block Sizes: 1M, 128K, 16K
- IODepth: 128, 64, 32, 16, 8, 4, 1
For the first part of the GDSIO analysis, we will compare the Samsung 990 Pro 2TB against the Samsung 9100 Pro 4TB, starting with the throughput differentials. We performed each GDSIO workload at its given block size and thread count across multiple job and batch sizes. The reported figures are the averages of each job and batch count combination.
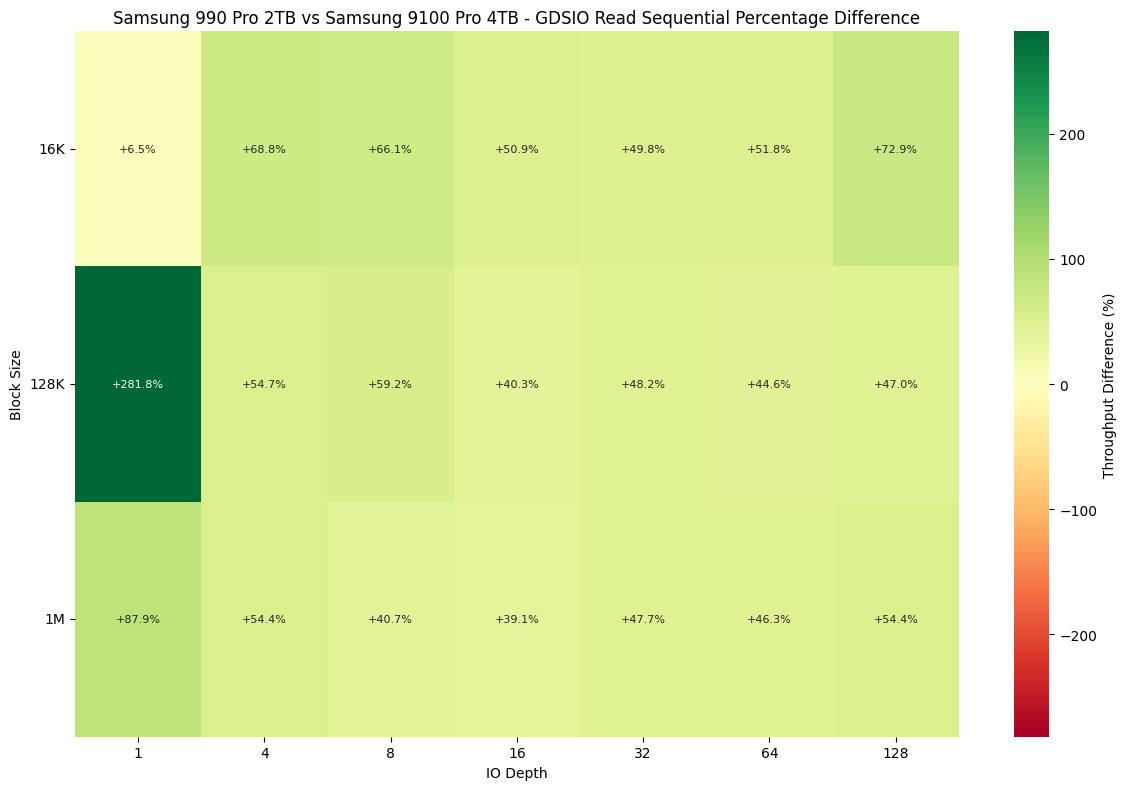
The first chart demonstrates that the Samsung 9100 Pro 4TB consistently outperforms the Samsung 990 Pro 2TB in sequential read throughput across different block sizes and IO depths. The performance gap is most noticeable at a 128K block size with an IO depth of 1, where the 9100 Pro delivers 281.8% higher throughput, emphasizing its efficiency in low-depth sequential read tasks. Even with smaller 16K block sizes, the 9100 Pro maintains a significant performance lead, with throughput advantages ranging from 6.5% to 72.9%. The heatmap further highlights that the 9100 Pro sustains a 40-60% performance advantage at mid-to-high IO depths, making it the better option for workloads requiring fast sequential reads, such as gaming, content streaming, and large-file transfers.
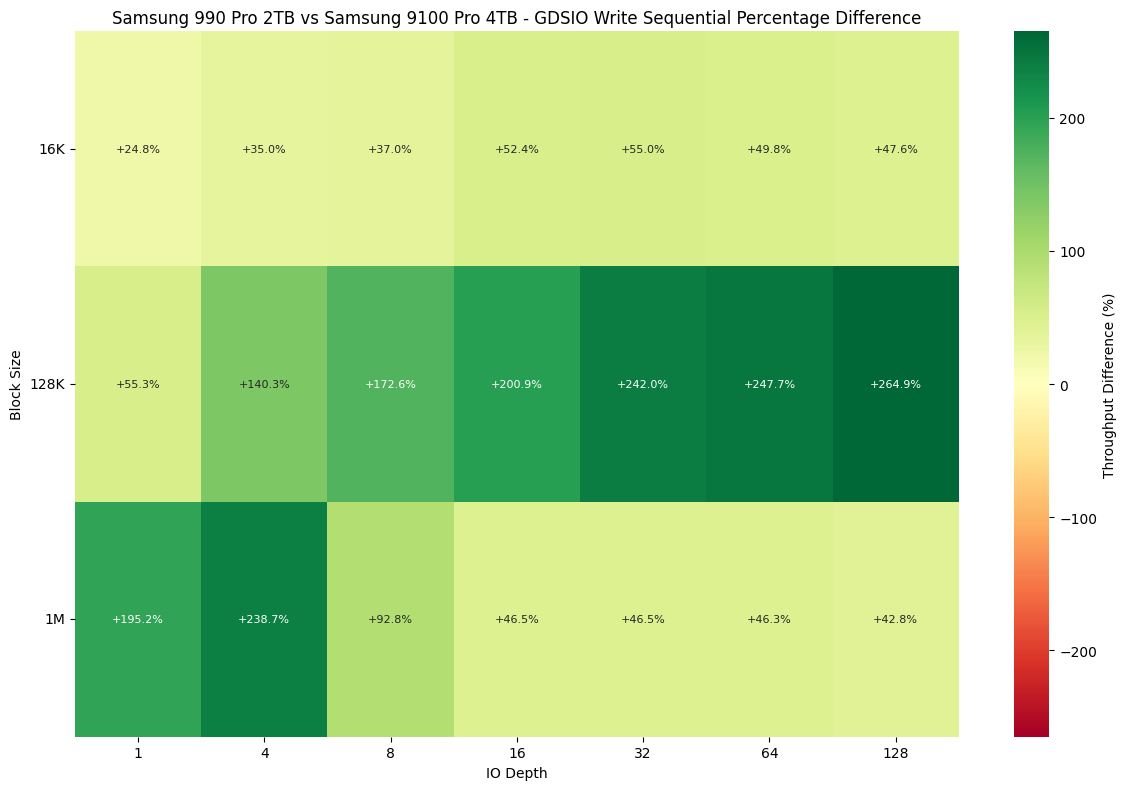
The Samsung 9100 Pro 4TB also excels in sequential write performance, especially at larger block sizes. At a 128K block size and IO depths ranging from 8 to 128, the 9100 Pro outperforms the 990 Pro by over 172%, with the performance gap peaking at 264.9% at an IO depth of 128. The most significant disparity is observed at a 1M block size with an IO depth of 4, where the 9100 Pro achieves 238.7% greater throughput, highlighting its superior write efficiency. Even at 16K block sizes, the performance gains remain substantial, ranging from 24.8% to 55%. This reinforces the 9100 Pro’s suitability for write-heavy workloads such as video rendering, high-speed data logging, and other demanding tasks. The heatmap demonstrates that the 9100 Pro scales significantly better with increasing IO depth, making it an excellent choice for performance-critical applications.
This table below provides a simple breakdown comparison of the GDSIO performance metrics we collected for five different SSDs used in testing—the Crucial P3 Plus 2TB, Crucial T705 2TB, Samsung 990 Pro 2TB, Samsung 9100 Pro 4TB, and WD SN850X 2TB—across three block sizes: 16K, 128K, and 1M, each with an IO depth of 128. It includes the average read and write speeds (in GiB/s), latency (in milliseconds), and IOPS (Input/Output Operations Per Second) for each drive. The data shows how each SSD performs under different workload conditions, with the Samsung 9100 Pro 4TB emerging as the top performer in multiple categories. It leads in both read and write speeds at the 16K and 128K block sizes, delivering the highest throughput and lowest latency among the drives tested. It excels at the 1M block size, demonstrating consistently high transfer rates.
| GDSIO Chart (16K,128K,1M Block Size Averages) | Crucial P310 2TB | Crucial T705 2TB | Samsung 990 Pro 2TB | Samsung 9100 Pro 4TB | WD SN850X 2TB |
|---|---|---|---|---|---|
| (16K Block Size 128 IO Depth) Average Read | 3.0 GiB/s (0.653ms) IOPS: 194.9K | 2.9 GiB/s (0.659ms) IOPS: 193.1K | 2.0 GiB/s (0.974ms) IOPS: 130.9K | 3.5 GiB/s (0.562ms) IOPS: 226.4K | 2.3 GiB/s (0.857ms) IOPS: 148.7K |
| (16K Block Size 128 IO Depth) Average Write | 2.3 GiB/s (0.854ms) IOPS: 149.3K | 2.4 GiB/s (0.826ms) IOPS: 154.4K | 1.7 GiB/s (1.165ms) IOPS: 109.5K | 2.5 GiB/s (0.789ms) IOPS: 161.7K | 1.0 GiB/s (1.940ms) IOPS: 65.9K |
| (128K Block Size 128 IO Depth) Average Read | 4.0 GiB/s (3.884ms) IOPS: 32.9K | 5.2 GiB/s (3.020ms) IOPS: 42.3K | 3.7 GiB/s (4.186ms) IOPS: 30.6K | 5.5 GiB/s (2.847ms) IOPS: 44.9K | 4.1 GiB/s (3.836ms) IOPS: 33.3K |
| (128K Block Size 128 IO Depth) Average Write | 3.9 GiB/s (4.038ms) IOPS: 31.7K | 2.9 GiB/s (5.410ms) IOPS: 23.6K | 1.6 GiB/s (9.879ms) IOPS: 13.0K | 5.8 GiB/s (2.705ms) IOPS: 47.3K | 3.9 GiB/s (3.958ms) IOPS: 32.3K |
| (1M Block Size 128 IO Depth) Average Read | 4.4 GiB/s (28.634ms) IOPS: 4.5K | 6.0 GiB/s (20.699ms) IOPS: 6.2K | 4.0 GiB/s (30.960ms) IOPS: 4.1K | 6.2 GiB/s (20.045ms) IOPS: 6.4K | 4.3 GiB/s (28.775ms) IOPS: 4.4K |
| (1M Block Size 128 IO Depth) Average Write | 4.0 GiB/s (30.964ms) IOPS: 4.1K | 5.9 GiB/s (21.335ms) IOPS: 6.0K | 4.2 GiB/s (29.564ms) IOPS: 4.3K | 6.0 GiB/s (20.703ms) IOPS: 6.2K | 4.1 GiB/s (30.782ms) IOPS: 4.2K |
Conclusion
The Samsung 9100 Pro represents significant progress in their consumer SSD lineup, pushing the boundaries of PCIe Gen5 performance with high capacity options, although the 8TB model has yet to be released. Combining the Presto controller and 8th-gen V-NAND makes it one of the fastest and most capable consumer SSDs available, with features like Intelligent TurboWrite 2.0 and advanced thermal control ensuring it can easily handle the most demanding workloads.
In our tests, the 9100 PRO posted impressive results across various benchmarks. It came close to matching the Crucial T705 in peak sequential read/write speeds, hitting 14,800 MB/s and 13,400 MB/s, respectively. Its random read/write speeds were also excellent, with up to 2,200K and 2,600K IOPS—making it one of the fastest drives for mixed workloads and real-time AI model processing. In gaming-focused benchmarks like 3DMark DirectStorage and PCMark 10, the 9100 PRO performed just shy of the T705 but comfortably outpaced the Samsung 990 PRO and WD SN850X, proving that it’s already well-tuned for high-throughput gaming and creative applications alike.
Pricing is competitive for a high-end Gen5 drive. The 4TB version costs around $549.99 ($0.137 per GB), which is reasonable considering the performance and capacity. When the 8TB model becomes available, it will likely carry a premium price tag, but it’s a worthy investment for users needing maximum storage and speed. For high-end prosumers, AI researchers, content creators, and serious gamers, the 9100 PRO represents one of the most capable SSDs on the market today.
Samsung 9100 Pro at Amazon (affiliate link)
Engage with StorageReview
Newsletter | YouTube | Podcast iTunes/Spotify | Instagram | Twitter | TikTok | RSS Feed