|

The SpinPoint P80 is the latest in Samsung’s performance-oriented 7200 RPM drive line. Like other contemporary drives, the P80 incorporates 80 gigabytes per platter. Samsung joins Seagate in topping out with a two-platter, 160 GB design rather than setting its sights against the three-disk flagships offered by Hitachi, Maxtor, and WD. An 8.9 millisecond seek time and an eight-megabyte buffer round out the drive’s vitals.
Samsung, like most other firms, ships the P80 exclusively with fluid dynamic bearing (FDB) motors. When contrasted with traditional ball bearing offerings, FDB motors deliver quieter idle operation as well as purportedly increasing shock resistance.

With the P80, Samsung targets mid- to high-end desktop machines as well as light-duty servers that require moderate capacity combined with performance and quiet operation. In the following tests, the Samsung SpinPoint P80 will be compared against the following drives for the following reasons:
Western Digital Caviar WD2500JB | Same-generation competing unit |
Maxtor MaXLine Plus II ATA-133 | Same-generation competing unit |
Seagate Barracuda 7200.7 (PATA) | Same-generation / same interface. The SATA ‘Cuda features substantially better performance but has not been retested with current controller driver/bios and is thus invalid |
Hitachi Deskstar 7K250 (SATA) | Same-generation competing unit; we have not tested the parallel ATA version |
Low-Level ResultsFor diagnostic purposes only, StorageReview measures the following low-level parameters: Average Read Access Time– An average of 25,000 random accesses of a single sector each conducted through IPEAK SPT’s AnalyzeDisk suite. The high sample size permits a much more accurate reading than most typical benchmarks deliver and provides an excellent figure with which one may contrast the claimed access time (claimed seek time + the drive spindle speed’s average rotational latency) provided by manufacturers. WB99 Disk/Read Transfer Rate – Begin– The sequential transfer rate attained by the outermost zones in the hard disk. The figure typically represents the highest sustained transfer rate a drive delivers. WB99 Disk/Read Transfer Rate – End– The sequential transfer rate attained by the innermost zones in the hard disk. The figure typically represents the lowest sustained transfer rate a drive delivers. |
For more information, please click here.
|
Note: Scores on top are better. |
|
|||||||||||||||||
|
SP1614N Average Read Service Time
|
||||||||||||||||
|---|---|---|---|---|---|---|---|---|---|---|---|---|---|---|---|---|---|
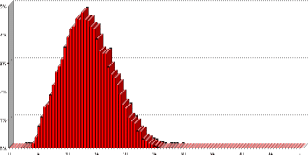
AnalyzeDisk places the SpinPoint P80’s measured access time at 13.4 milliseconds. Subtracting 4.2 milliseconds to account for the average rotational latency of a 7200 RPM drive reveals a measured seek time of 9.2 milliseconds. Though such a score doesn’t meet Samsung’s claimed spec, we have witnessed far more egregious violations from most competitors.
|
Note: Scores on top are better. |
|
|||||||||||||||||||||||||||||||||
|
|
||||||||||||||||||||||||||||||||
SP1614N Transfer Rate
|
|||||||||||||||||||||||||||||||||
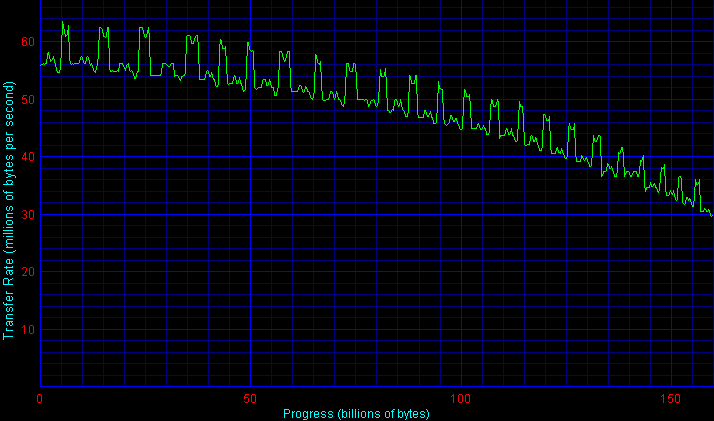
Outer-zone transfer rates weigh in at about 57.2 MB/sec, typical for today’s 80 GB/platter ATA units. Rates decay to an inner track rate of 33.4 MB/sec. The STR graph presented above is, to put it mildly, rather ugly. The regular depression evidenced in transfer rates is almost reminiscent of a background process accessing the drive at regular intervals. SR’s testbed environment, however, aggressively eliminates such variation. These depressions have been corroborated by transfer rate graphs posted by other review sites- whatever causes this phenomenon is thus internal to the disk/firmware and (as far as we can tell) beyond the ability of the user to correct. That said, though they may appear disconcerting, the depressions are likely not something to fret over. It is unlikely that they significantly affect performance.
Single-User PerformanceStorageReview uses the following tests to assess non-server use: StorageReview.com Office DriveMark 2002– A capture of 30 minutes of actual computer productivity use that exactingly recreates a typical office-style multitasking environment. The applications include: Outlook XP, Word XP, Excel XP, PowerPoint XP, Calypso (a freeware e-mail client), SecureCRT v3.3 (a telnet/SSH client), CuteFTP Pro v1.0 (an FTP/SSH client), ICQ 2000b), Palm Hotsync 4.0, Gravity 2.3 (a Usenet/newsgroups client), PaintShop Pro v7.0, Media Player v8 for the occasional MP3, and Internet Explorer 6.0. StorageReview.com High-End DriveMark 2002– A capture of VeriTest’s Content Creation Winstone 2001 suite. Applications include Adobe Photoshop v5.5, Adobe Premiere v5.1, Macromedia Director v8.0, Macromedia Dreamweaver v3.0, Netscape Navigator v4.73, and Sonic Foundry Sound Forge v4.5. Unlike typical productivity applications, high-end audio- and video- editing programs are run in a more serial and less multitasked manner. The High-End DriveMark includes significantly more sequential transfers and write (as opposed to read) operations. |
StorageReview.com Bootup DriveMark 2002– A capture of the rather unusual Windows XP bootup process. Windows XP’s boot procedure involves significantly different access patterns and queue depths than those found in other disk accesses. This test recreates Windows XP’s bootup from the initial bootstrap load all the way to initialization and loading of the following memory-resident utilities: Dimension4 (a time synchronizer), Norton Antivirus 2002 AutoProtect, Palm Hotsync v4.0, and ICQ 2000b.
StorageReview.com Gaming DriveMark 2002– A weighted average of the disk accesses featured in five popular PC games: Lionhead’s Black & White v1.1, Valve’s Half-Life: Counterstrike v1.3, Blizzard’s Diablo 2: Lord of Destruction v1.09b, Maxis’s The Sims: House Party v1.0, and Epic’s Unreal Tournament v4.36. Games, of course, are not multitasked- all five titles were run in a serial fashion featuring approximately half an hour of play time per game.
For more information, please click here.
|
Note: Scores on top are better. |
The SpinPoint P80 manages to top 400 I/Os per second in the StorageReview Office DriveMark 2002, placing it right in the thick of things with competitors. Samsung’s contender compares well against the Maxtor MaXLine Plus II, trailing only Western Digital’s Caviar WD2500JB and Hitachi’s Deskstar 7K250.
Samsung chokes a bit, however, when it comes to the High-End DriveMark. While the P80 maintains a considerable lead over the anemic Barracuda 7200.7, Maxtor’s drive joins Hitachi and WD in outpacing Samsung’s offering.
The P80 climbs back into the thick of things in the Bootup DriveMark, a test that recreates the Windows XP bootup process and as a result generates higher-than-normal queue depths.
Finally, in the Gaming DriveMark, the Samsung again handily bests Seagate’s drive while trailing the drives from Hitachi, WD, and Maxtor.
Multi-User PerformanceStorageReview uses the following tests to assess server performance: StorageReview.com File Server DriveMark 2002– A mix of synthetically-created reads and writes through IOMeter that attempts to model the heavily random access that a dedicated file server experiences. Individual tests are run under loads with 1 I/O, 4 I/Os, 16 I/Os, and 64 I/Os outstanding. The Server DriveMark is a convenient at-a-glance figure derived from the weighted average of results obtained from the four different loads. StorageReview.com Web Server DriveMark 2002– A mix of synthetically-created reads through IOMeter that attempts to model the heavily random access that a dedicated web server experiences. Individual tests are run under loads with 1 I/O, 4 I/Os, 16 I/Os, and 64 I/Os outstanding. The Server DriveMark is a convenient at-a-glance figure derived from the weighted average of results obtained from the four different loads. For more information click here. |
|
Note: Scores on top are better. |
|
|||||||||||||||||||||||||||||||||
|
|
||||||||||||||||||||||||||||||||
For use in a light-duty file server, the SpinPoint P80 performs just as well as Hitachi’s Deskstar 7K250 and Western Digital’s Caviar WD2500JB. However, though the P80 keeps up with the WD in the read-dominated Web Server DriveMark, it can’t match the top-level performance delivered by the Hitachi.
Legacy PerformanceeTesting Lab’s WinBench 99 Disk WinMark tests are benchmarks that attempt to measure desktop performance through a rather dated recording of high-level applications. Despite their age, the Disk WinMarks are somewhat of an industry standard. The following results serve only as a reference; SR does not factor them into final judgments and recommends that readers do the same. |
|
Note: Scores on top are better. |
|
|||||||||||||||||||||||||||||||||
|
|
||||||||||||||||||||||||||||||||
When idle, the SpinPoint P80 operates at 42.3 dB/A from a distance of 18 millimeters. Technically speaking, it produces more sound pressure than all the competition save the non-FDB Caviar WD2500JB. Subjectively, however, most drives that fall below the 45 dB/A floor are virtually inaudible when installed in a system that features a power-supply and CPU fan. Seeks are quiet- its safe to say that the P80 will not significantly contribute to a system’s noise profile. With just two platters, the flagship P80 operates at a cool 18.9 degrees Celsius over ambient temperature. It should integrate well into virtually any system.
According to filtered and analyzed data collected from participating StorageReview.com readers, a predecessor of the Note that the percentages in bold above may change as more information continues to be collected and analyzed. For more information, to input your experience with these and/or other drives, and to view comprehensive results, please visit the SR Drive Reliability Survey.
Previous post: Western Digital Raptor WD740GD Preview Next post: Western Digital Raptor WD740GD | ||||||||||||||||||||||||||||||||||||||||||


 Amazon