The Solidigm P41 Plus SSD is an entry-level consumer M.2. SSD that won’t break the bank. It is an inexpensive SSD for light tasks, addressing the need of most common computing workloads. This SSD family comes in sizes from 512GB to 2TB. We reviewed the 1TB version earlier this year. This time we’re taking a look at the larger 2TB capacity in this review.
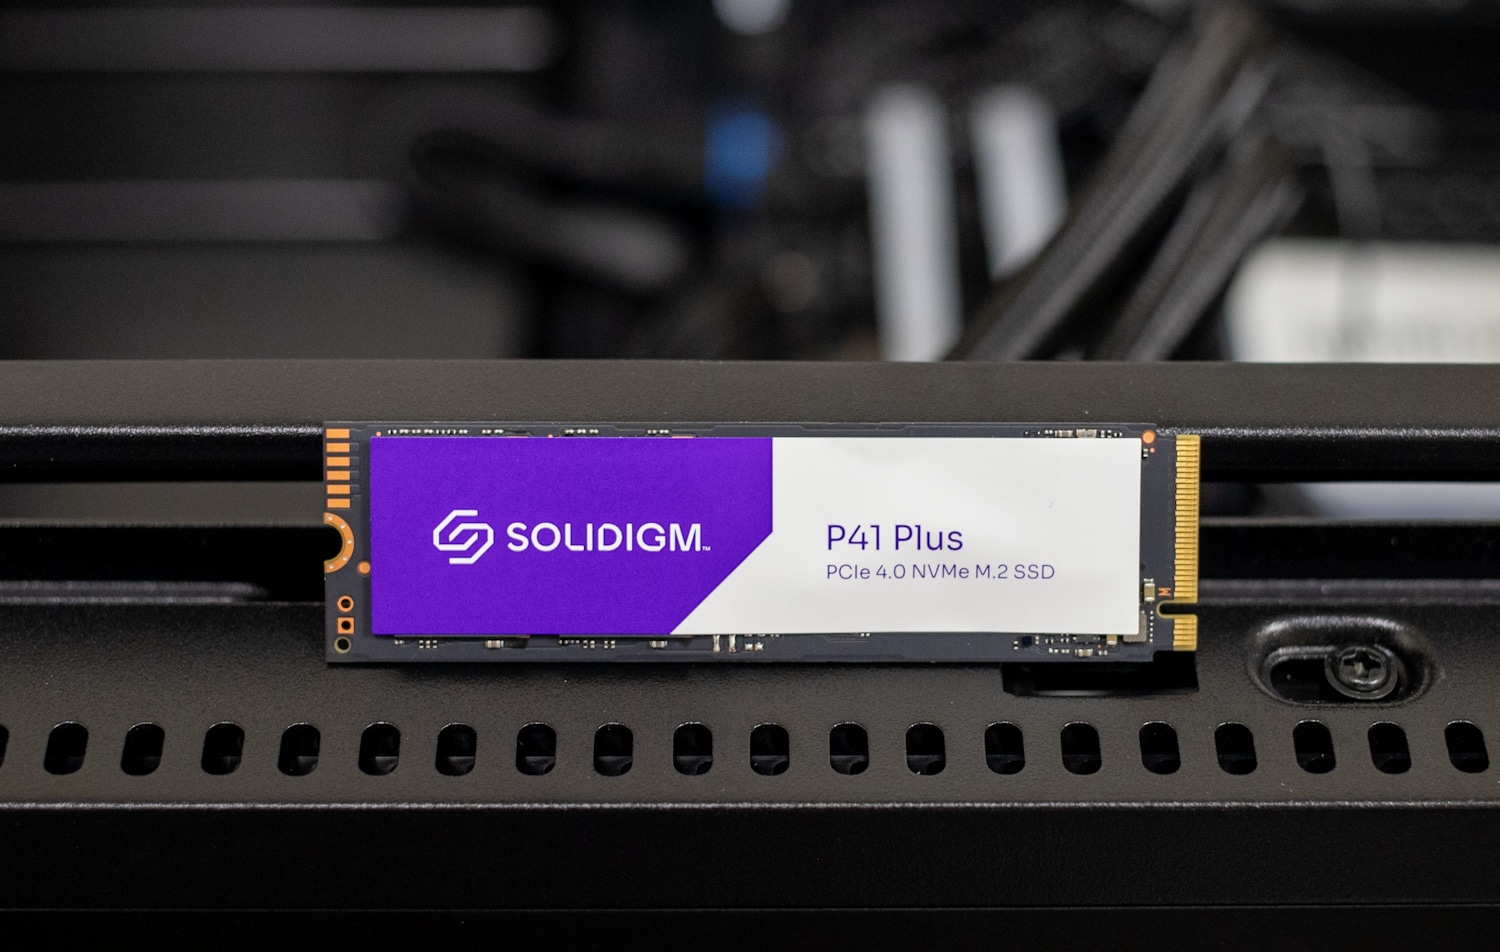
Solidigm P41 Plus 2TB Features
The P41 Plus has middle-of-the-road performance rates for an SSD. This is to be expected though, as the target is mainstream value customers. The drive sports a modest SiliconMotion SM2269XT controller with no DRAM cache.
According to the spec sheet, the sequential read on the P41 Plus 1TB and 2TB reaches up to 4,125 MB/s and the write reaches up to 3,325MB/s for the 2TB model. The 512GB P41 Plus reaches up to 3,500 MB/s read and 1,625MB/s write. This makes sense when you see how the drives are on the more wallet-friendly side of the market. It also has hardware encryption and end-to-end data protection.
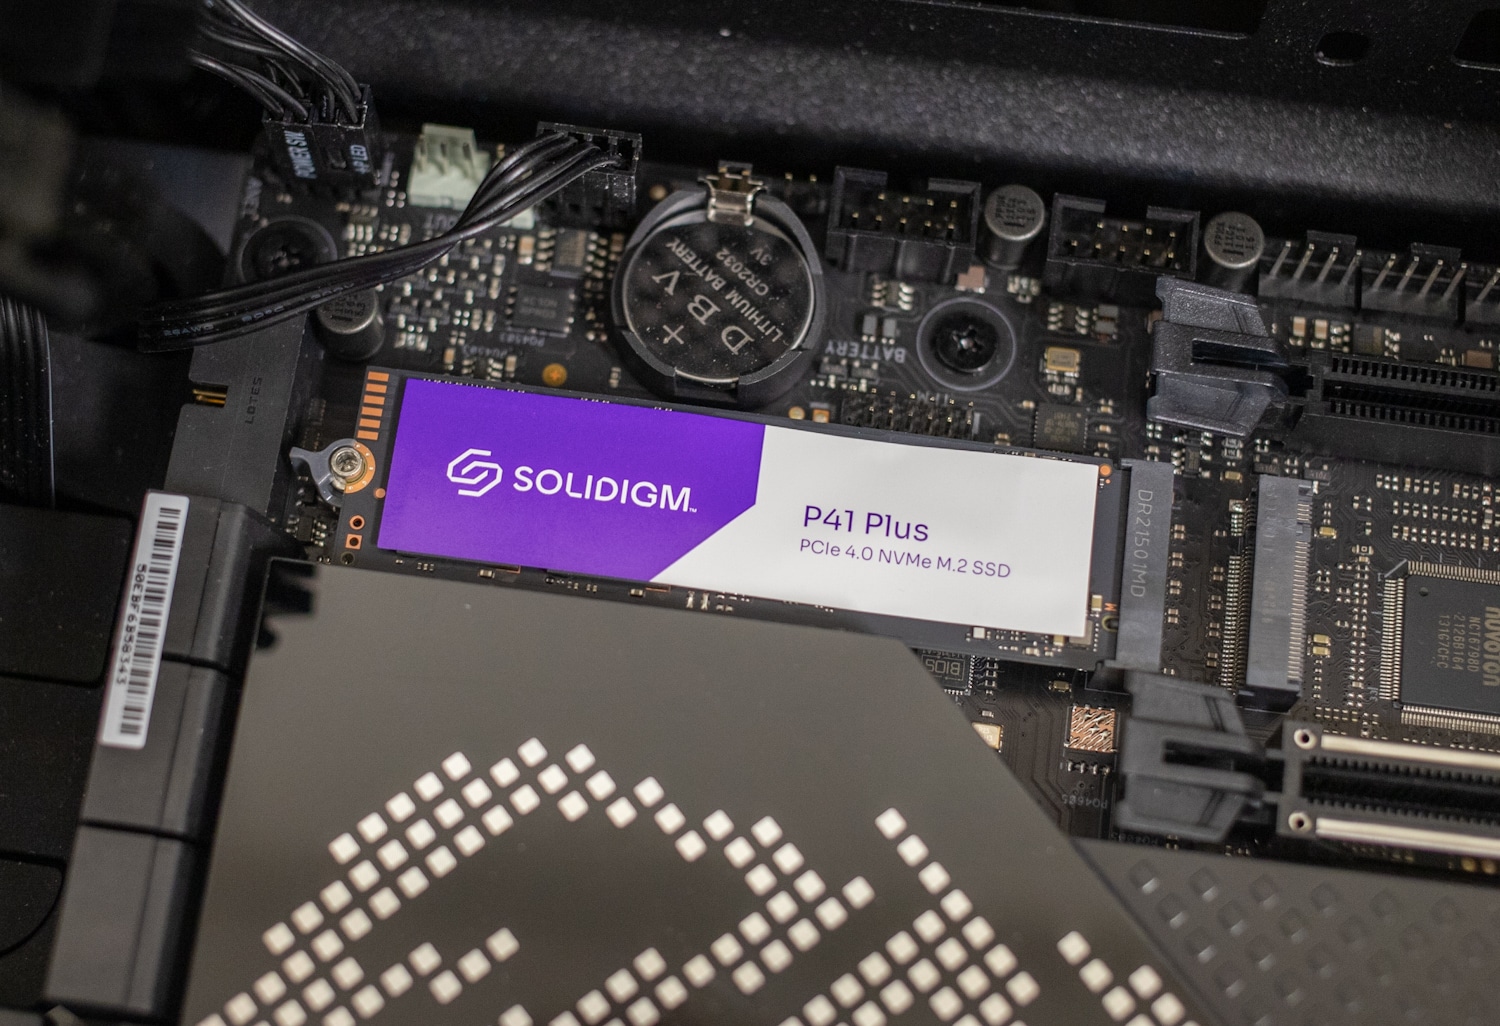
The Solidigm P41 Plus has a five-year warranty. The drives are very budget-friendly starting going for $153 for the 2TB model.
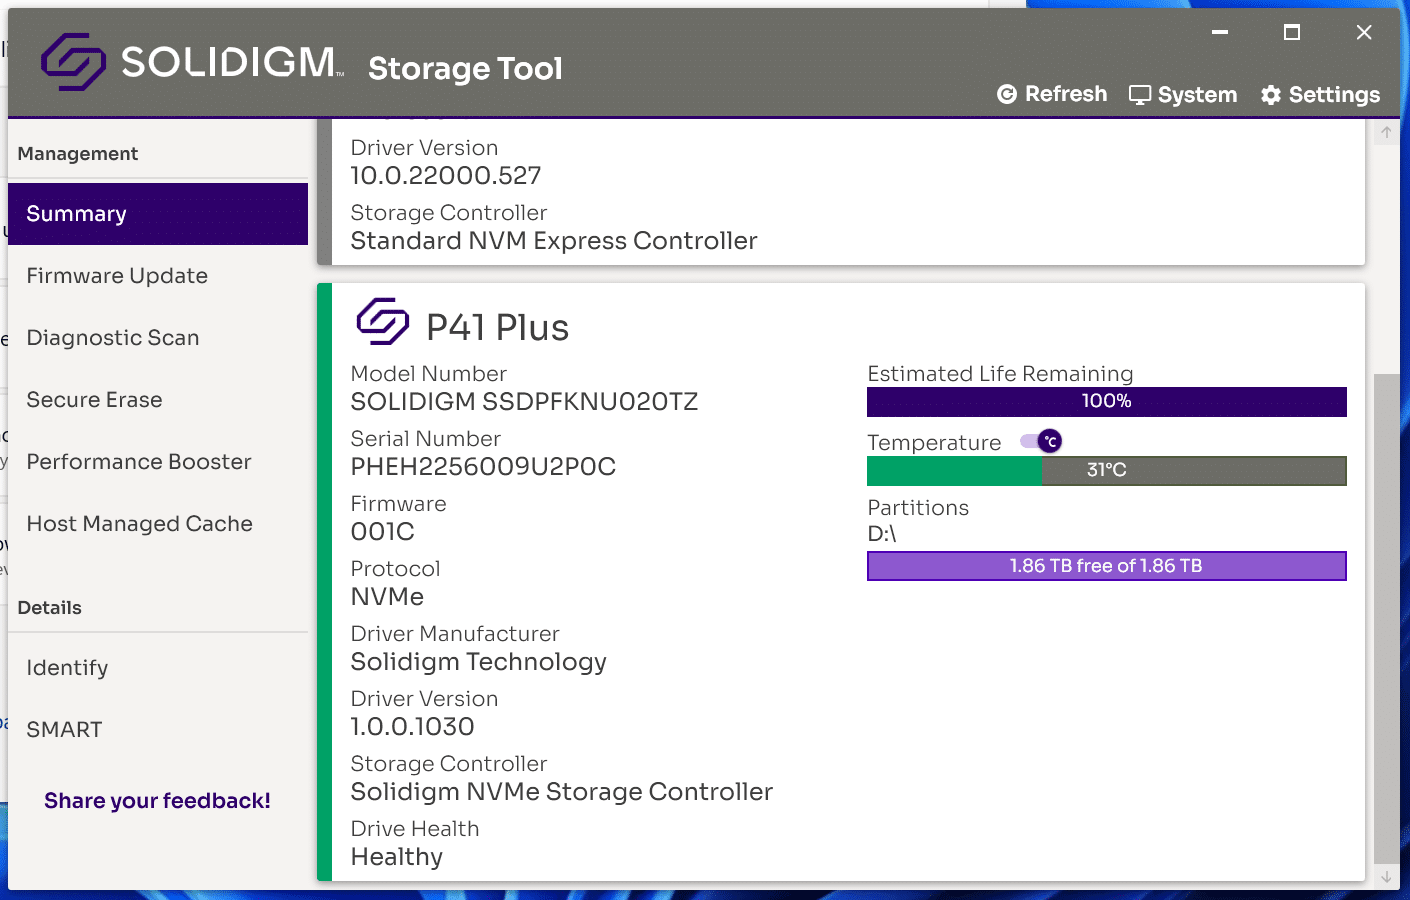
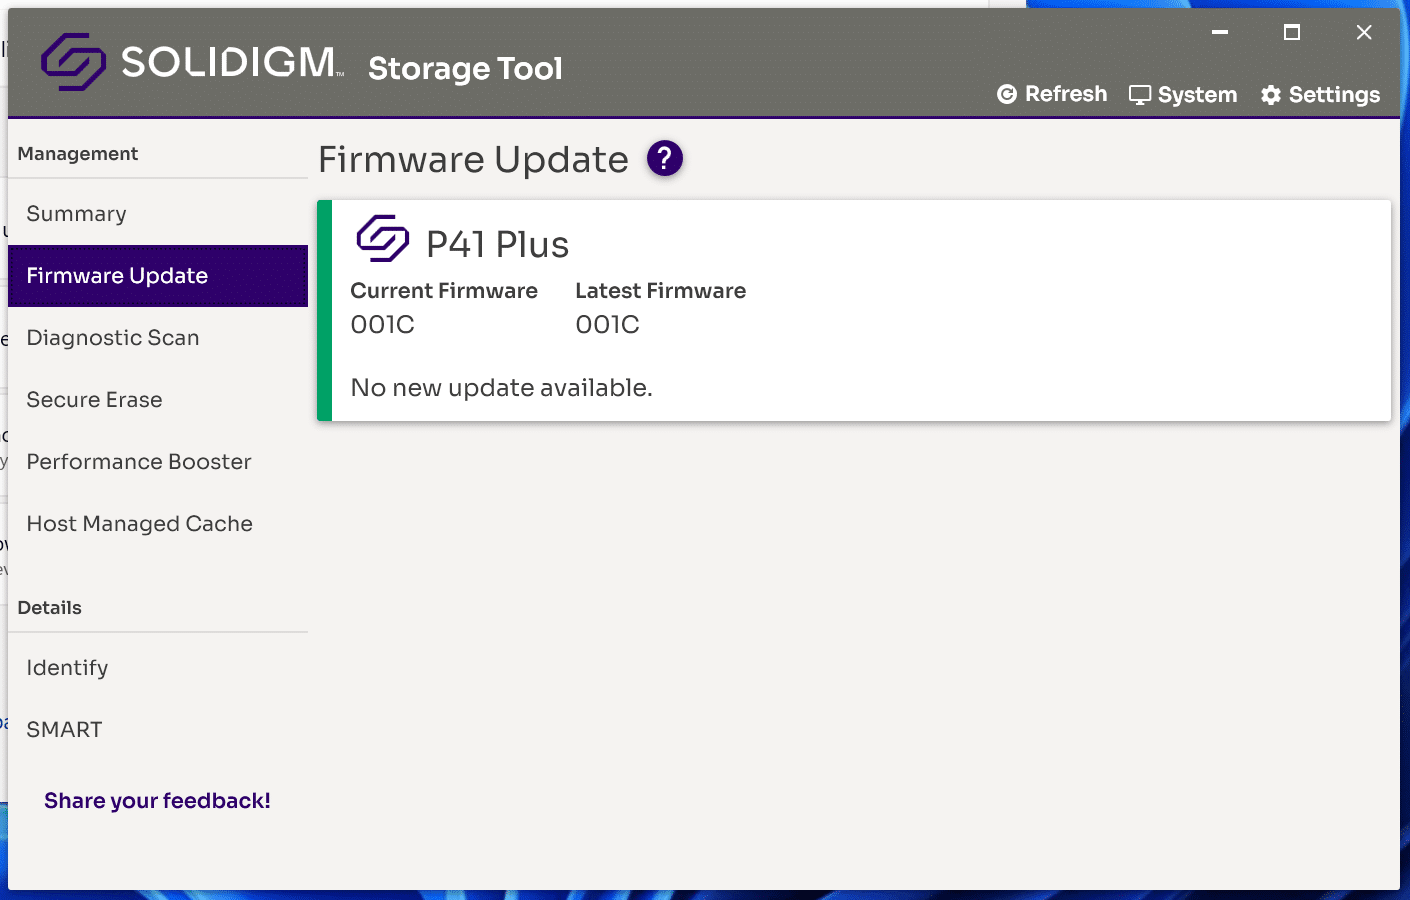
Solidigm Storage Tool
Solidigm SSDs come with a program called the Solidigm Storage Tool. This tool allows you to see the specifications of your SSD. The tool also has features allowing the user to update the firmware, run a diagnostic scan, secure erase the drive, boost performance through supported options, and handle host-managed cache.
Solidigm P41 Plus specifications
| Capacity | 512GB | 1TB | 2TB |
| Performance Specifications | |||
| Sequential Bandwidth – 100% Read (up to) |
3,500MB/s |
4,125MB/s |
4,125MB/s |
| Sequential Bandwidth – 100% Write (up to) |
1,625MB/s |
2,950 MB/s |
3,325 MB/s |
| Power – Active | 80mW | ||
| Power – Idle | 25mW | ||
| Reliability | |||
| Vibration – Operating | 2.17 CRMS (5-700Hz) | ||
| Vibration – Non-Operating | 3.13 CRMS (5-700Hz) | ||
| Shock (Operating and Non-Operating) |
1,000 C (Max) at 0.5 msec 1,500 C (Max) at 0.5 msec |
||
| Operating Temperature Range | 0°C to 70°C | ||
|
Operating Temperature (Maximum) |
70 °C |
||
|
Operating Temperature (Minimum) |
0 °C |
||
|
Endurance Rating (Įifetime Writes) |
200 TBW |
400 TBW |
800 TBW |
|
Mean Time Between Failures (MTBF) |
1.6 million hours |
||
|
Uncorrectable Bit Error Rate (UBER) |
< 1 sector per 1015 bits read |
||
| Warranty Period | 5 years | ||
| Package Specifications | |||
| Form Factors | M.2 22 x 80mm | ||
| Interface | PCIe 4.0 x4 | NVMe | ||
| Advanced Specifications | |||
| Hardware Encryption | No | ||
| End-to-End Data Protection | Yes | ||
| NSIT Secure Erase | No | ||
Testbed
For database and synthetic testing, we leverage the Lenovo ThinkSystem SR635 server, equipped with an AMD 7742 CPU and 512GB of 3200Mhz DDR4 memory. NVMe is tested natively through an M.2 to PCIe adapter card in the edge-card slot. A large focus is put on drive latency across the entire load range of the drive, not just at the smallest QD1 (Queue-Depth 1) levels. We do this because many of the common consumer benchmarks don’t adequately capture end-user workload profiles. For our added BlackMagic Disk Speed Test performed in Windows, we use our self-built StorageReview desktop.
We are reviewing the 2TB version of the Solidigm P41 Plus drive and will be comparing it to the following NVMe QLC SSDs:
SQL Server Performance
Each SQL Server VM is configured with two vDisks: 100GB volume for boot and a 500GB volume for the database and log files. From a system resource perspective, we configured each VM with 16 vCPUs, 64GB of DRAM and leveraged the LSI Logic SAS SCSI controller. While our Sysbench workloads tested previously saturated the platform in both storage I/O and capacity, the SQL test is looking for latency performance.
This test uses SQL Server 2014 running on Windows Server 2012 R2 guest VMs and is stressed by Quest’s Benchmark Factory for Databases. StorageReview’s Microsoft SQL Server OLTP testing protocol employs the current draft of the Transaction Processing Performance Council’s Benchmark C (TPC-C), an online transaction-processing benchmark that simulates the activities found in complex application environments.
The TPC-C benchmark comes closer than synthetic performance benchmarks to gauging the performance strengths and bottlenecks of storage infrastructure in database environments. Each instance of our SQL Server VM for this review uses a 333GB (1,500 scale) SQL Server database and measures the transactional performance and latency under a load of 15,000 virtual users.
SQL Server Testing Configuration (per VM)
- Windows Server 2012 R2
- Storage Footprint: 600GB allocated, 500GB used
- SQL Server 2014
-
- Database Size: 1,500 scale
- Virtual Client Load: 15,000
- RAM Buffer: 48GB
- Test Length: 3 hours
- 2.5 hours preconditioning
- 30 minutes sample period
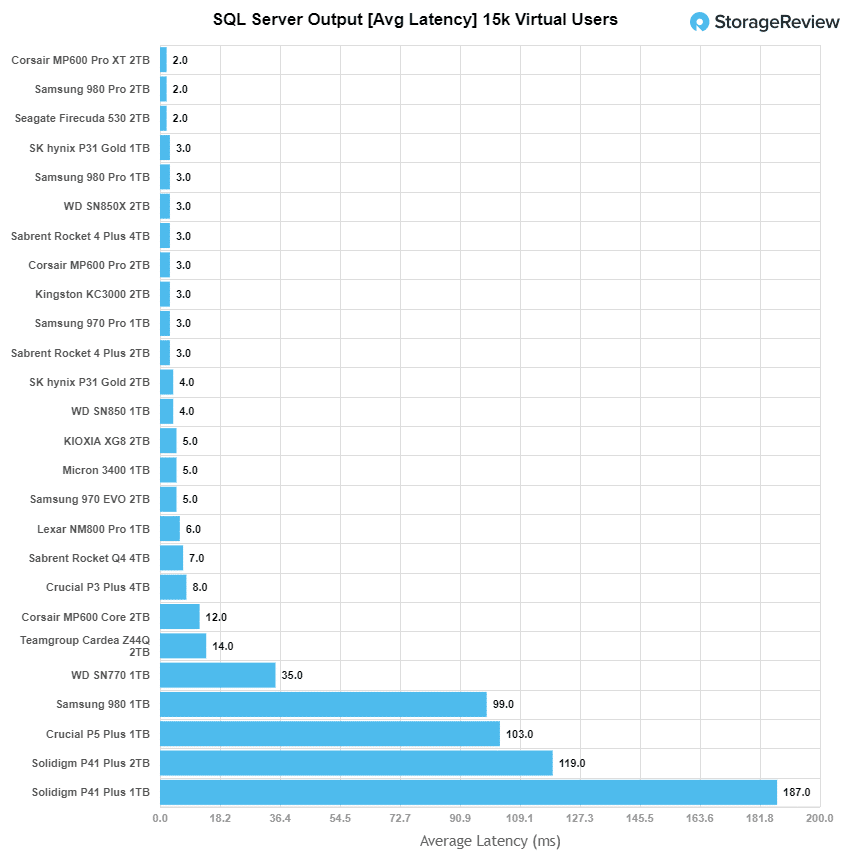
The 2TB P41 Plus seemed to have some of the highest latency out of all the storage devices in the tests. The only storage device that was slower in the SQL server test was the 1TB model. The 2TB Solidigm P41 Plus had a latency of 119 ms. So the larger drive was a huge step up from the 1TB model, but still towards the bottom of the pack.
VDBench Workbench Analysis
When it comes to benchmarking storage devices, application testing is best, and synthetic testing comes in second place. While not a perfect representation of actual workloads, synthetic tests do help to baseline storage devices with a repeatability factor that makes it easy to do an apples-to-apples comparison between competing solutions. These workloads offer a range of different testing profiles ranging from “four corners” tests, common database transfer size tests, to trace captures from different VDI environments.
All of these tests leverage the common vdBench workload generator, with a scripting engine to automate and capture results over a large compute testing cluster. This allows us to repeat the same workloads across a wide range of storage devices, including flash arrays and individual storage devices. Our testing process for these benchmarks fills the entire drive surface with data, then partitions a drive section equal to 1% of the drive capacity to simulate how the drive might respond to application workloads. This is different from full entropy tests which use 100% of the drive and take them into a steady state. As a result, these figures will reflect higher-sustained write speeds.
Profiles:
- 4K Random Read: 100% Read, 128 threads, 0-120% iorate
- 4K Random Write: 100% Write, 64 threads, 0-120% iorate
- 64K Sequential Read: 100% Read, 16 threads, 0-120% iorate
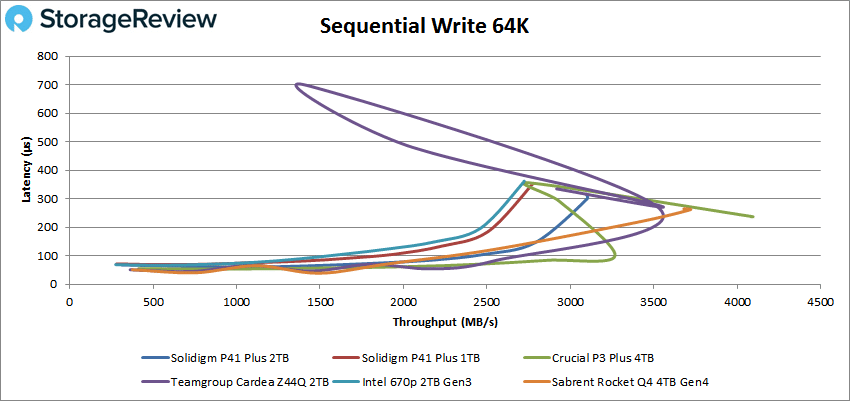
- 64K Sequential Write: 100% Write, 8 threads, 0-120% iorate
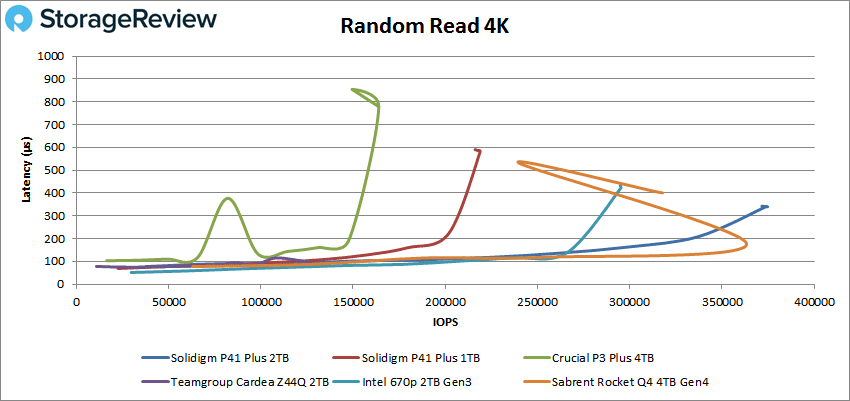
In Random Read 4k, the Solidigm P41 Plus 2TB measured 374,808 IOPS at a latency of 339.9 µs.
Disk Speed Test Performance
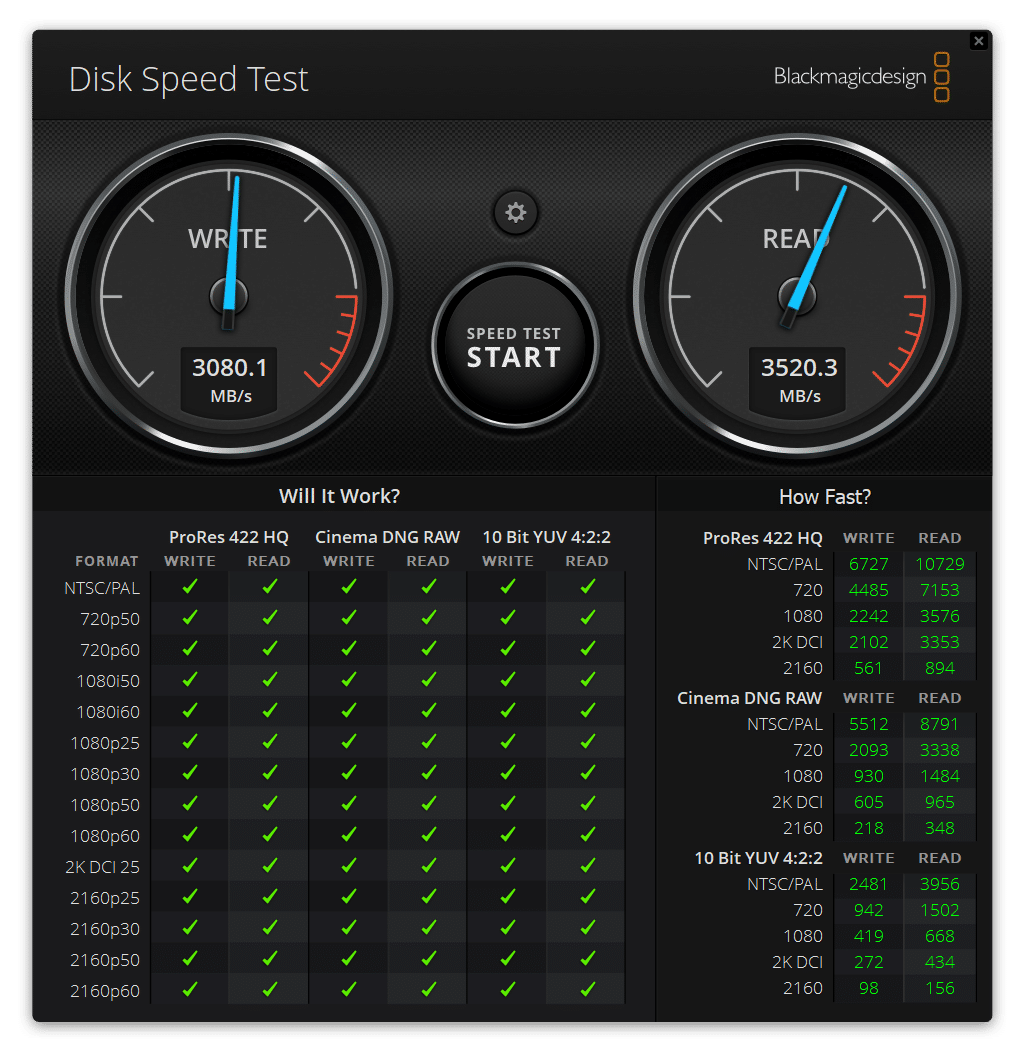
We measured performance inside a Windows 11 environment on our consumer test platform. Read speeds measured came in under the 4,125MB/s listed on the spec sheet, although write speeds were closer. Host-managed cache didn’t really change this benchmark much, although with it off the P41 Plus slightly edged out the figure with it enabled.
Enabling the cache, the Solidigm P41 Plus 2TB reached write speeds of 3012.9 MB/s and read speeds of 3450.3 MB/s.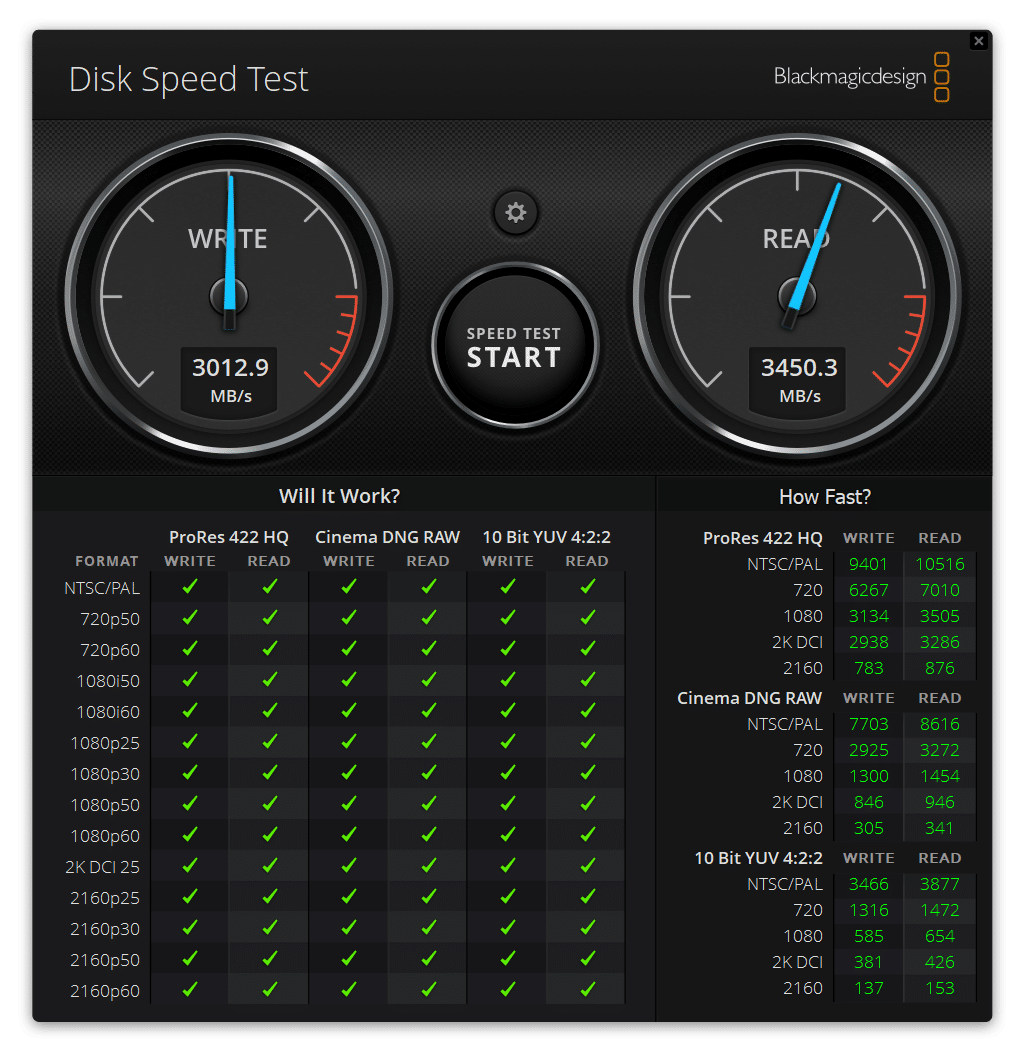
 Conclusion
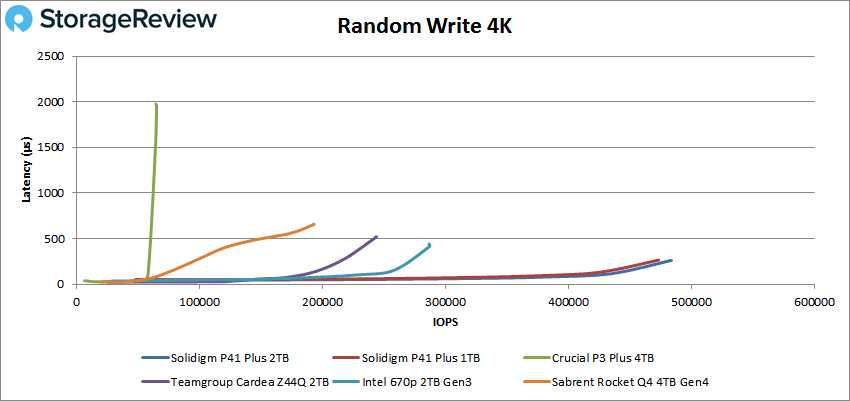
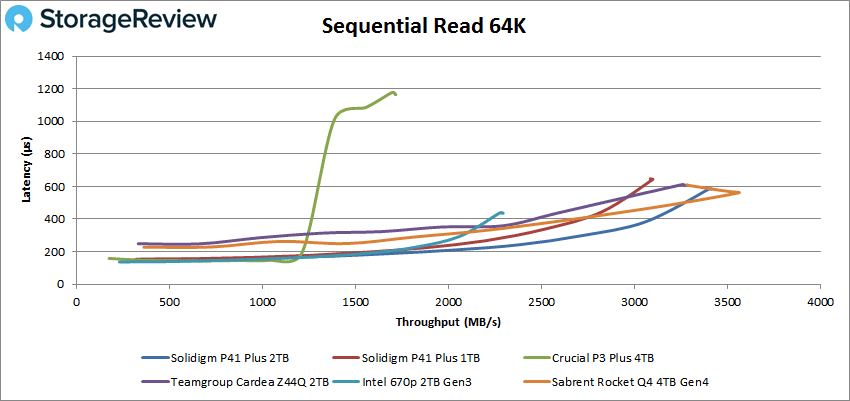
The 2TB Solidigm P41 Plus is not going to win any awards for its performance. The 2TB is slower than other SSDs on the market because of its architecture. It often scored below average or middle of the road on tests. It posted 374,808 IOPS in random read 4k, 483,964 IOPS during random write 4k, and measured 3,396 MB/s in the sequential write.
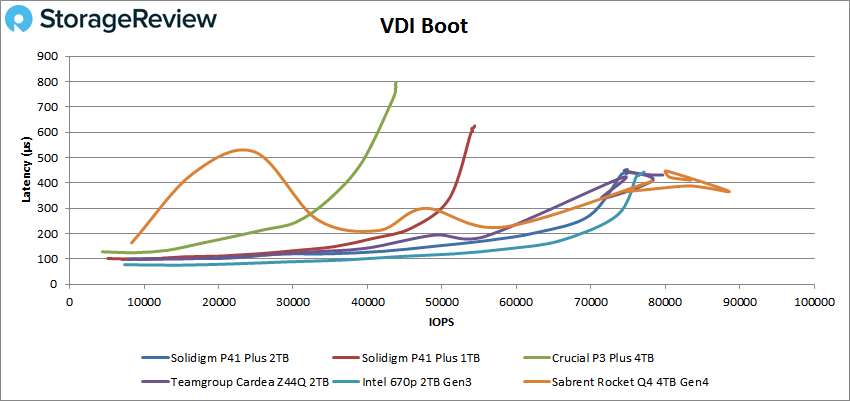
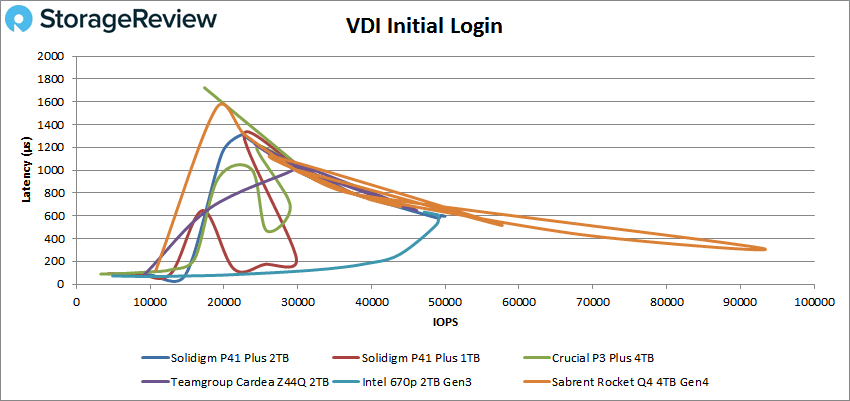
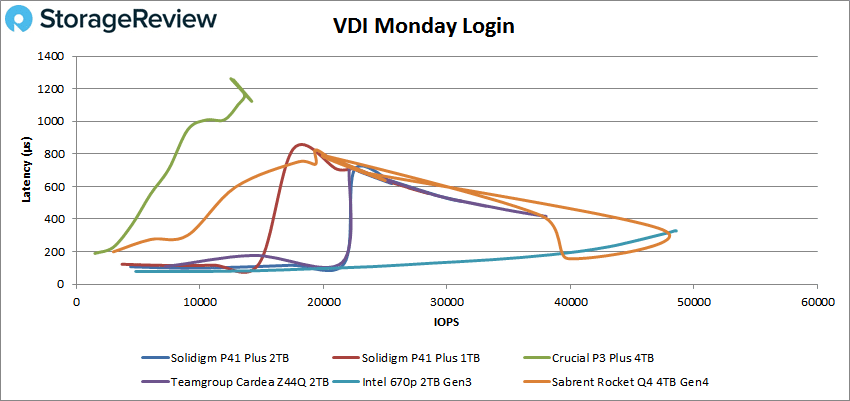
Latency was the main drawback of the 2TB P41 Plus when it started trying to punch above its weight class. When it was tested on the SQL benchmark, it scored almost at the bottom, only beating the 1TB model P41 Plus. During the VDI benchmarks, it showed similar latency issues.
That said, the drive is purely a budget play, and it delivers 2TB of flash for about $150. For those with pedestrian workloads, the 2TB Solidigm P41 Plus is a bargain and is worth it as a boot drive on systems that won’t see much past email and web browsing, or in scenarios where the user has a faster drive for applications and games.


 Conclusion

 Amazon