
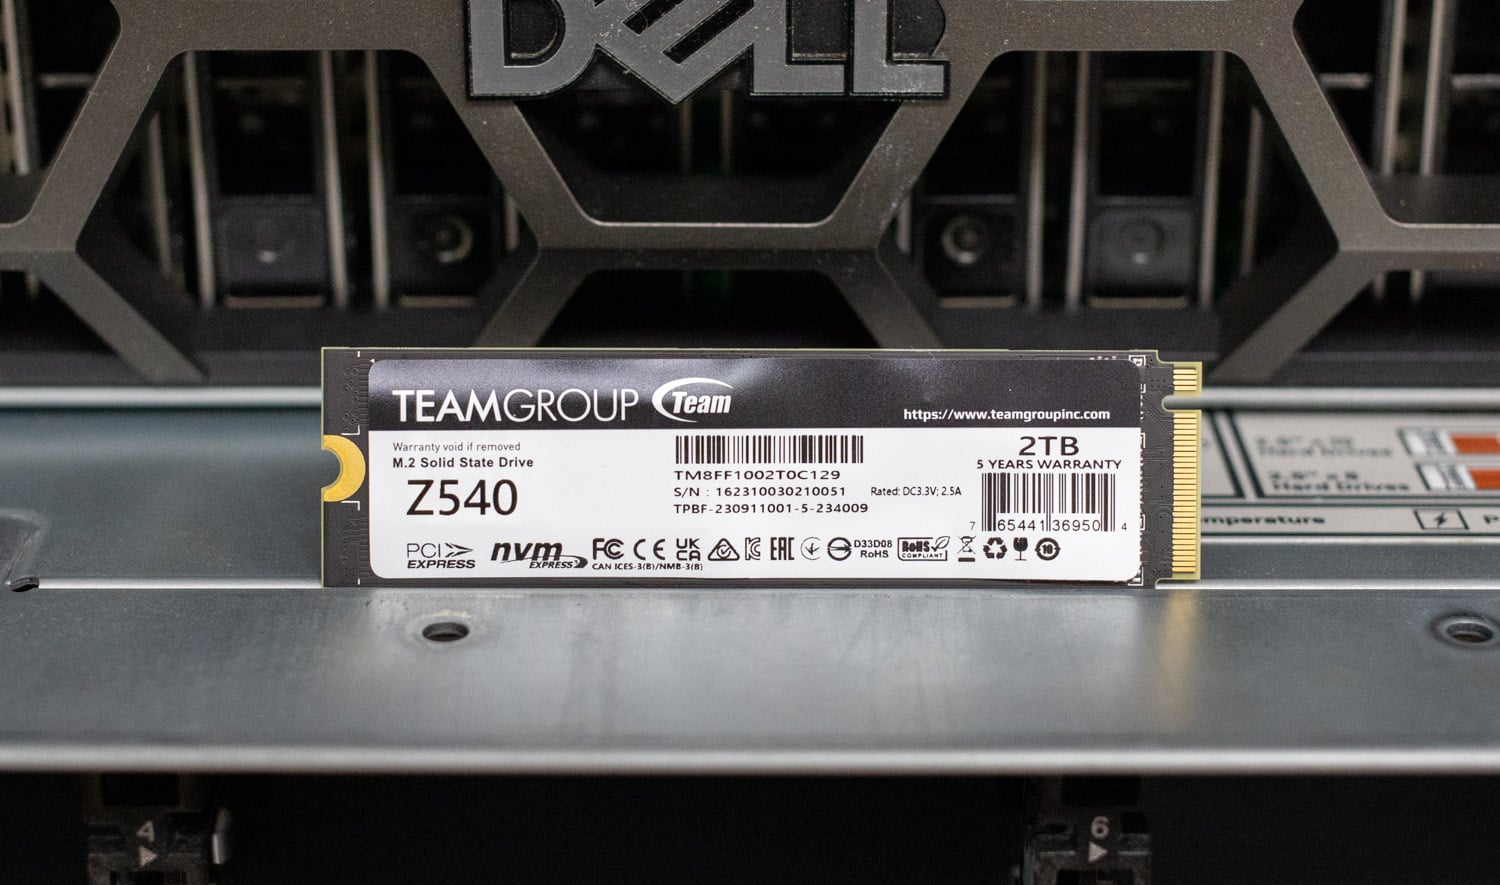
The Teamgroup T-Force Z540 Gen5 M.2 boasts impressive performance due to the blend of Phison PS5026-E26-52, SK Hynix DRAM, and Micron NAND.
We have seen a few Teamgroup SSDs, but the T-Force Z540 is the first Gen5 drive to pass through our lab. This Gen5 M.2 is available in three capacities: 1TB, 2TB, and 4TB.
Most Gen5 SSDs we have seen utilize the Phison PS5026-E26 controller but may differ in their NAND and DRAM usage. The other significant variable for performance is the firmware these manufacturers use on the drives. With these variables at play, it is interesting to see how the drives perform against each other, with identical hardware but using different firmware. That seems to be the case with this drive since the configuration appears to be the same on the Z540 as on the Corsair MP700 Pro SE.
T-Force Z540 Features
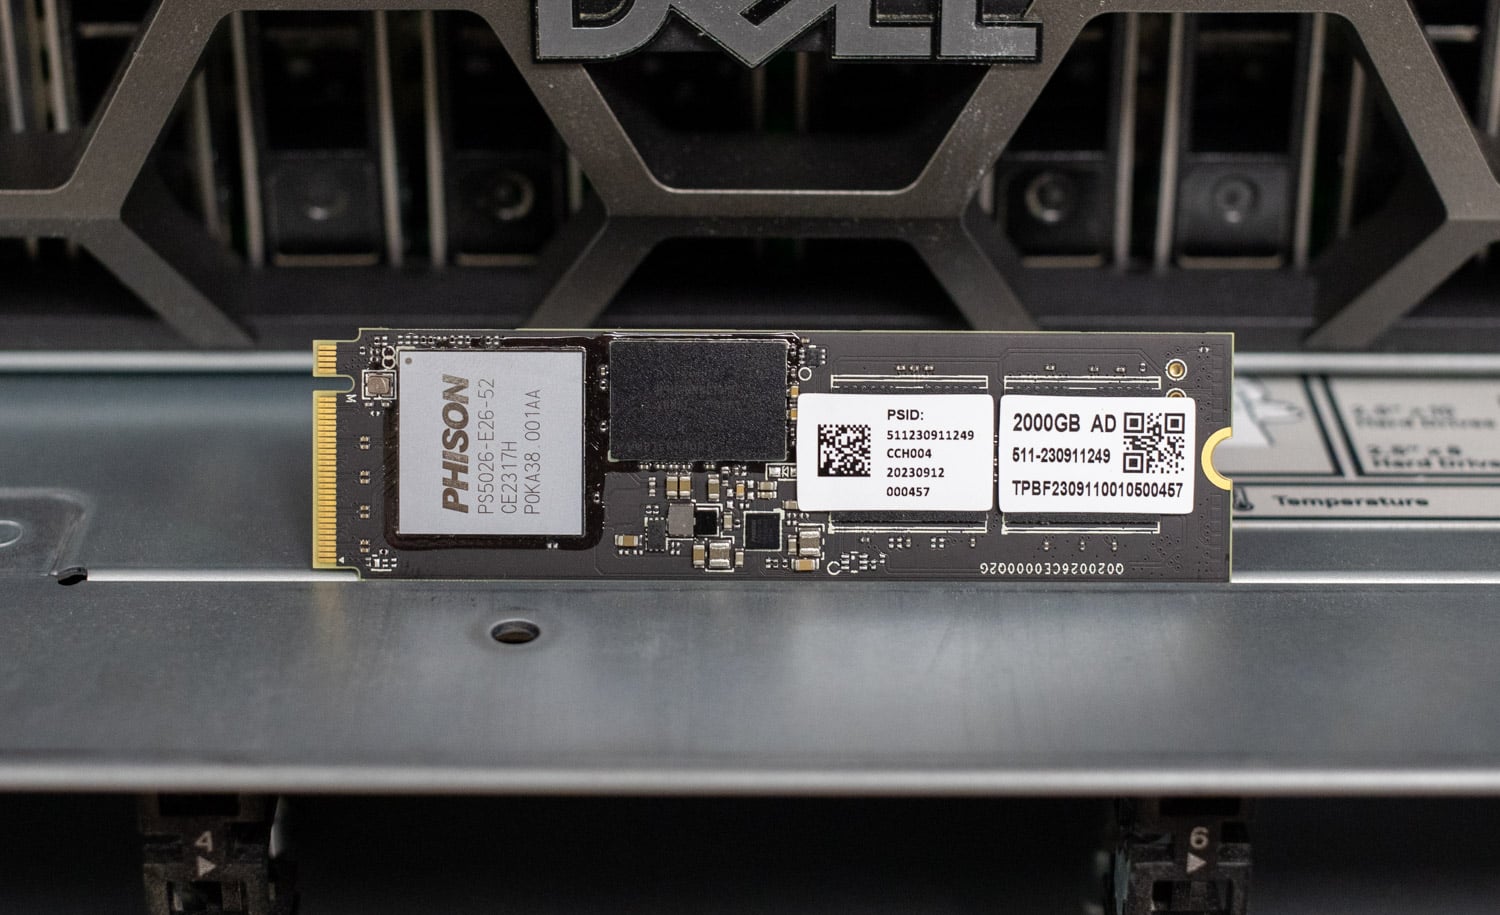
Looking at the top side of the Z540, we can see the Phison PS5026-E26-52 controller beside the SK Hynix DRAM. Next to the DRAM is the Micron NAND used here, mirrored on the drive’s rear. This Gen5 SSD is marketed with its graphene heat dissipation solution, which is not applied from the factory. The Graphene sticker is meant to be placed over the top of the drive to help direct heat into a motherboard heatsink better, though we didn’t take the time to test the sticker.
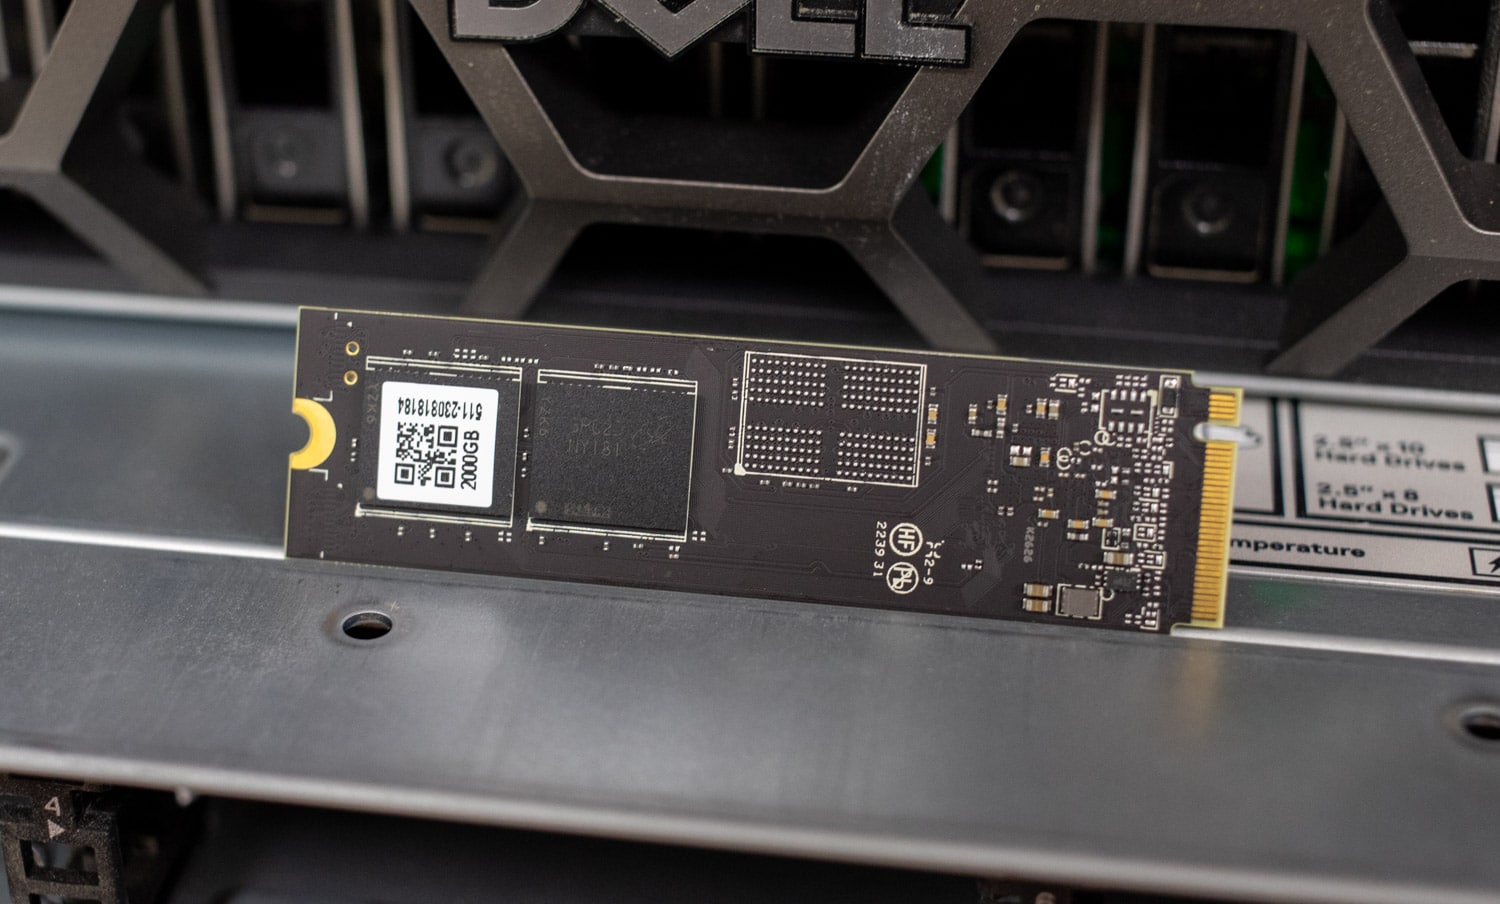
Viewing the bottom of the drive gives us a better look at the uncovered Micron NAND and the traces where the extra DRAM would go on the 4TB model. These NAND traces would likely be unused on the 1 TB variant.
T-Force Z540 Options and Pricing
The pricing for the Z540 on Amazon (affiliate link) is shown below. All Z540 capacity models come with a 5-year limited warranty.
| Model | Price |
|---|---|
| TM8FF1001T0C129 (1TB) | $142.99 |
| TM8FF1002T0C129 (2TB) | $246.99 |
| TM8FF1004T0C129 (4TB) | $469.99 |
T-Force Z540 Specifications
Regarding the speeds of the different models, there is a slight difference between the 1TB and 2TB models, but the only difference documented between the 2TB and 4TB variants is doubling the TBW.
| Model | TM8FF1001T0C129 | TM8FF1002T0C129 | TM8FF1004T0C129 |
|---|---|---|---|
| Capacity | 1TB | 2TB | 4TB |
| Form Factor | M.2 2280 | ||
| Interface | PCIe Gen5x4 | ||
| Sequential Read | Up to 11,700 MB/s | Up to 12,400 MB/s | Up to 12,400 MB/s |
| Sequential Write | Up to 9,500 MB/s | Up to 11,800 MB/s | Up to 11,800 MB/s |
| TBW | 600TBW | 1200TBW | 2400TBW |
| Vibration | 80Hz~2000Hz/20G | ||
| Shock | 1500G/0.5ms | ||
| MTBF | 1,700,000 Hours | ||
| Warranty | 5-year limited warranty | ||
Performance
We will set up the Z540 against a few comparable SSDs for our performance benchmarks. We also threw a few Gen4 SSDs into the mix to show some improvements brought by Gen5 and how Gen4 holds up against them.
- Corsair MP700 Pro SE
- Gigabyte Aorus 1200
- Samsung 990 Pro (Gen 4)
- Seagate Firecuda 540
- Crucial T705
- Solidigm P44 Pro (Gen 4)
VDBench Workload Analysis
The VDBench Workload Analysis tests are a set of synthetic workloads that help provide baseline, repeatable conditions across multiple drives. These tests fill the drive surface with data and then partition a drive section equal to one percent of the drive capacity to simulate how the drive may respond to application workloads. This differs from full entropy tests, which utilize 100% of the drive and take it to a steady state.
We will look at seven different tests, including:
- 4K Random Read: 100% Read, 128 threads, 0-120% iorate
- 4K Random Write: 100% Write, 64 threads, 0-120% iorate
- 64K Sequential Read: 100% Read, 16 threads, 0-120% iorate
- 64K Sequential Write: 100% Write, 8 threads, 0-120% iorate
- VDI Boot
- VDI Initial Login
- VDI Monday Login
Starting with the Random Read 4K test, all drives are pretty close except the Aorus 1200, with latency spikes and falling back at about 79.5k IOPS. The MP700 Pro SE leads the pack with 1.12 Million IOPS and 113μs of latency. The Z540 falls right in the middle of these drives with 1,009,664 IOPS and 126μs of latency.

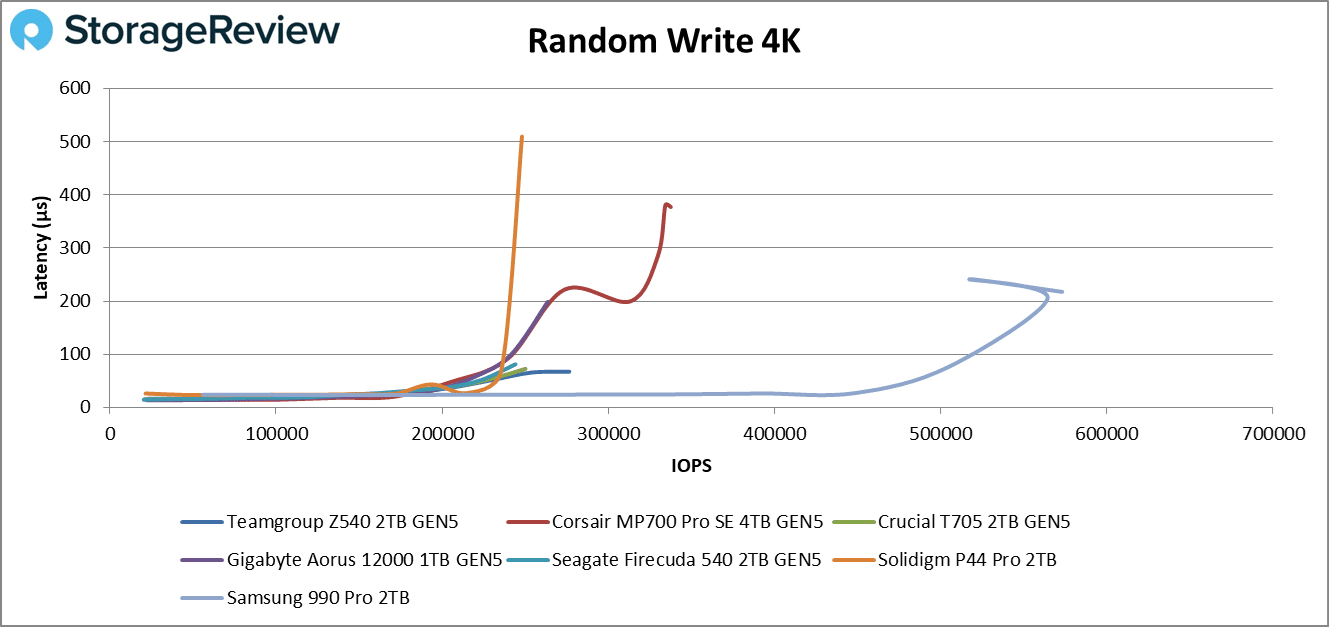
For the Random Write 4K test, we saw some erratic activity from our Gen4 drives. The blue line on the right is the 990 Pro with an impressive 571k IOPS and latency maxing at 241.3μs. The yellow line is the P44 Pro at 248k IOPS and 510μs of latency, and the red line is the MP700 Pro SE at 337.5k IOPS and 377μs. The Z540 is the blue line sticking out under the MP700 Pro SE, with 276.5k IOPS at 67.3μs of latency.
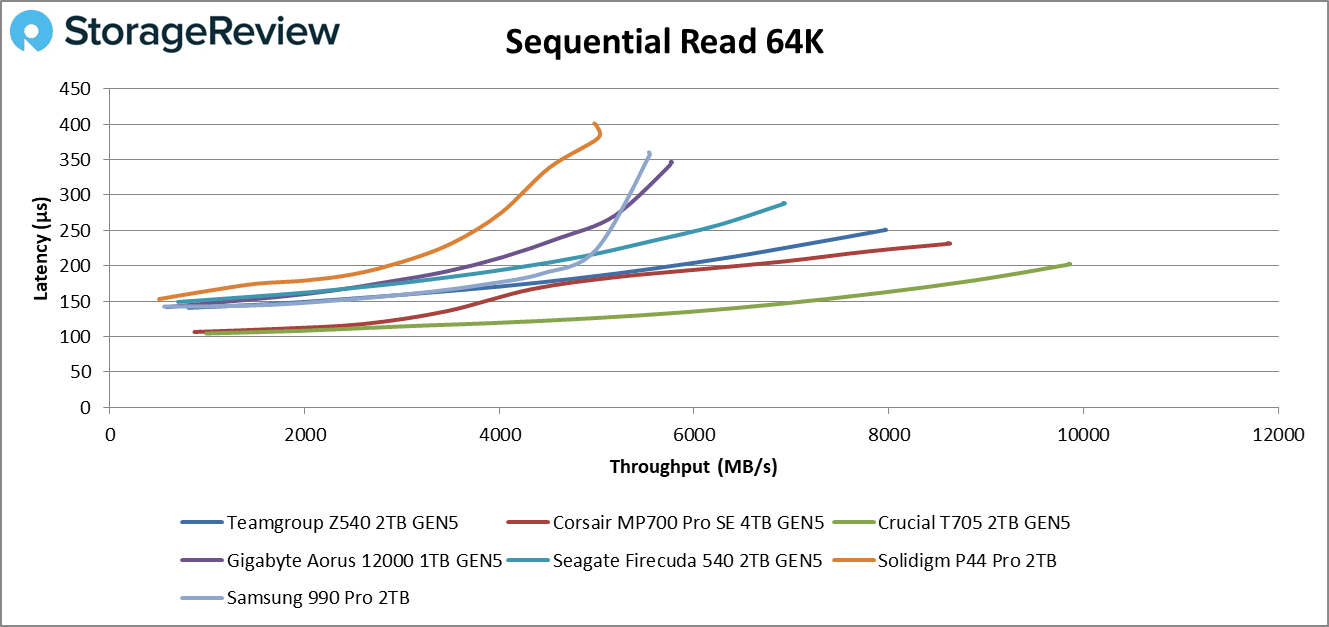
In the Sequential Read 64K test, there wasn’t much consistency between the drives, but the Z540 didn’t fare too badly. It came in third with 7,956MB/s at 250.7μs. Noting the other results, the P44 Pro came in last here, with 4,989MB/s at 399.8μs, with the T705 coming in first at 9,845MB/s and 202.5μs.
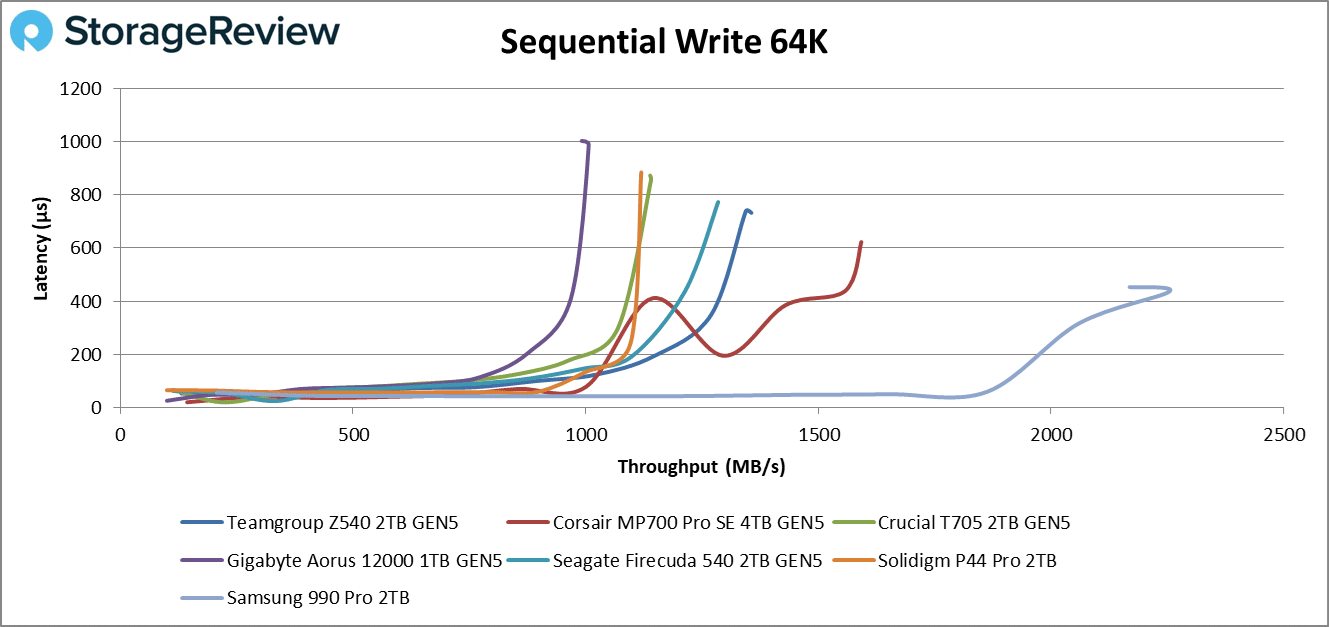
For Sequential Write 64K, we again see the results taper off with lower latency and higher throughput on each drive, though some have switched places. On this test, the Aorus 12000 was on the tail end with 991MB/s and 1,003.7μs, and the 990 Pro was in the lead again with 2,254 MB/s and 436μs. The Z540 is in third again with 1,344MB/s and 732.7μs
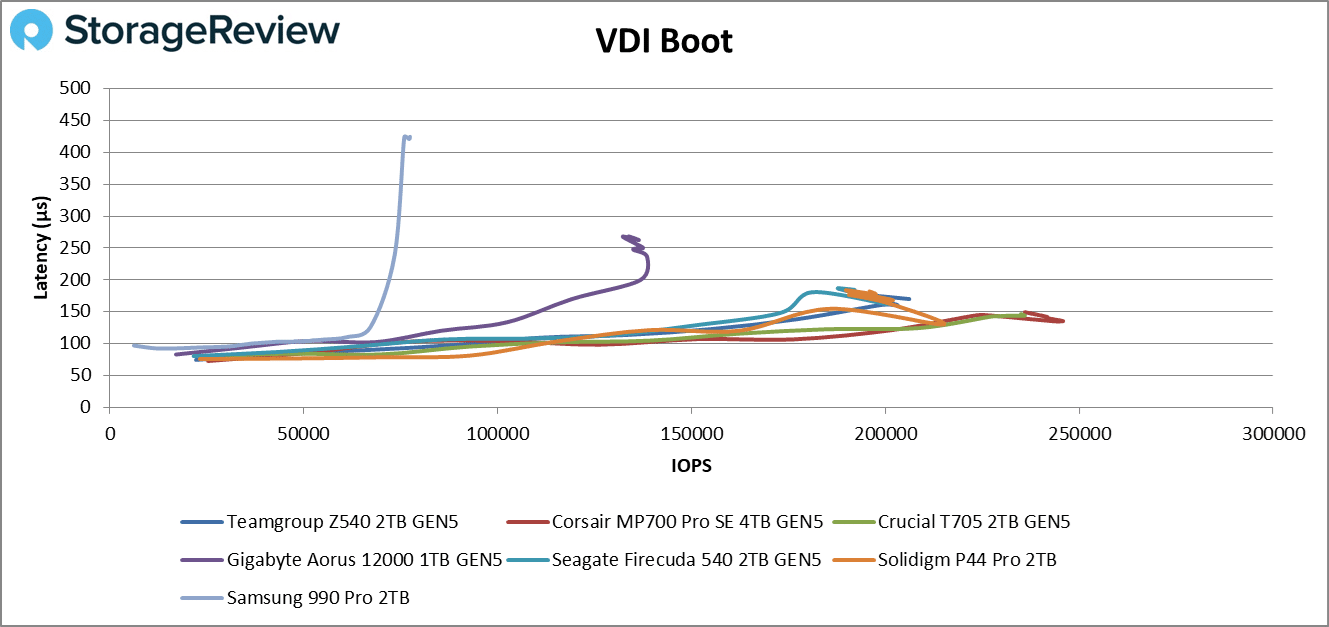
For the VDI Boot Portion, the Z540 led the group but was not on top with 206,189 IOPS at 170μs. These numbers put the Z540 in roughly fourth place, followed by the P44 Pro, T705, and MP700 Pro SE.
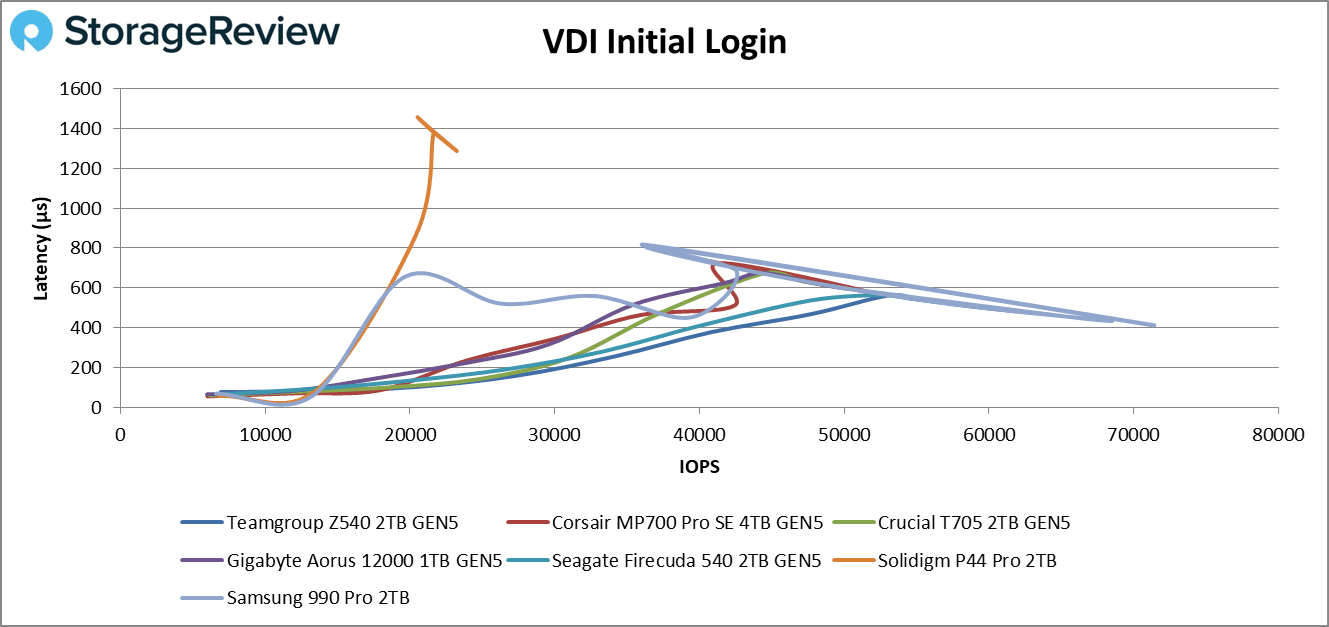
For VDI Initial Login, we see a lot more erratic activity from the Gen4 drives, with the Gen5 drives staying rock solid. The Z540 takes the lead in this test with 61,903 IOPS at 482μs. The second-place drive is the Firecuda 540, with 59,361 IOPS at 503μs.
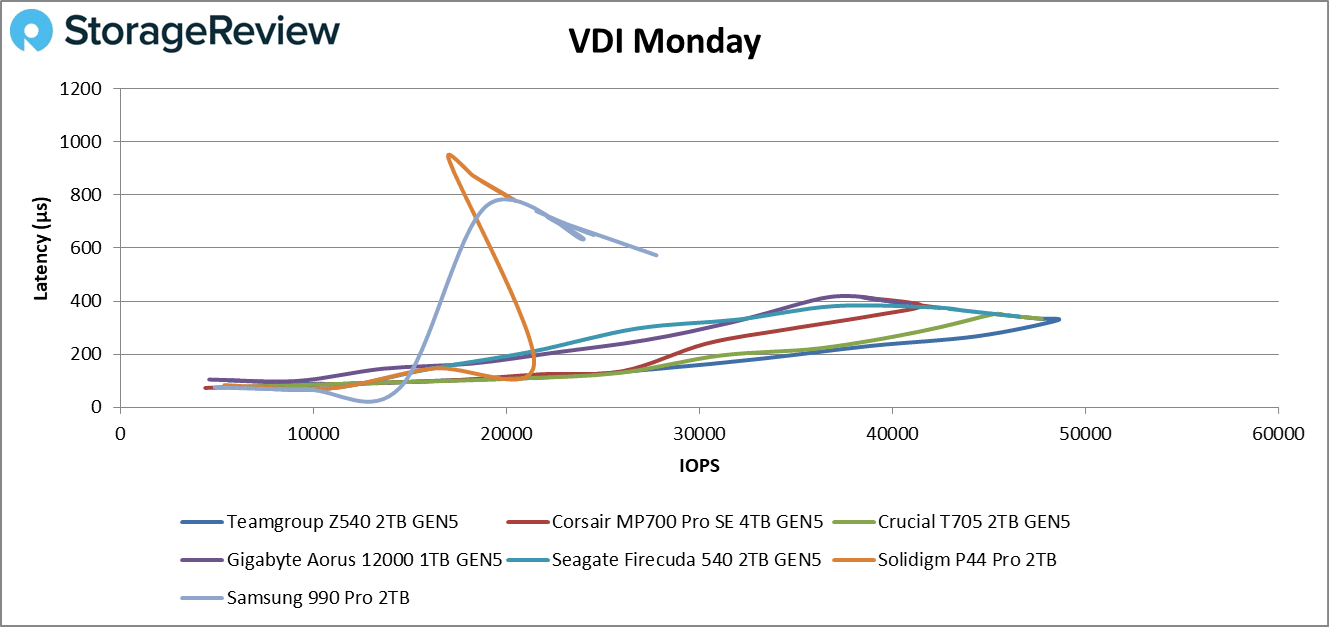
Finally, we have the VDI Monday login portion. We see the two Gen4 drives in the rear, with the Z540 retaking the lead with 48,457 IOPS at 327.9μs, followed by the T705 with 47,743 IOPS at 333.6μs.
BootBench
BOOT-BENCH-1 is a workload profile adopted by OCP to profile SSDs designed for server boot duty. While this is intuitively a job for enterprise SSDs, client SSDs are often selected for their performance, capacity, and cost combination. The boot drive issue is germane to hyperscalers and server and storage system providers, as they face similar challenges.
This boot workload executes a relatively intense test plan that fills the entire drive with writes before testing a read-heavy workload sequence. For each test, it performs a 32K random read async operation alongside a 15MiB/s synchronous 128k random write and a 5MiB/s synchronous 128k random write/trim background workload. The script starts with the random-read activity at a 4-job level and scales up to 256 jobs at its peak. The final result is read operations performed during its peak run.
The Z540 did very well on the BootBench test, only falling behind the T705 by roughly 10k IOPS and pulling ahead of the MP700 Pro SE by roughly 20k IOPS.
| BootBench | Read IOPS |
|---|---|
| T-Force Z540 | 290,490 IOPS |
| Corsair MP700 Pro SE | 269,752 IOPS |
| Gigabyte Aorus 12000 | DNF |
| Samsung 990 Pro (Gen4) | 188,544 IOPS |
| Crucial T705 | 302,496 IOPS |
| Solidigm P44 Pro (Gen4) | 211,999 IOPS |
CrystalDiskMark Speed Test
CrystalDiskMark is a popular drive benchmark. We tested the Z540 using five passes with a 32GB sample file. The Z540 did well here, showing 12.39GB/s on read and 11.8GB/s on write.
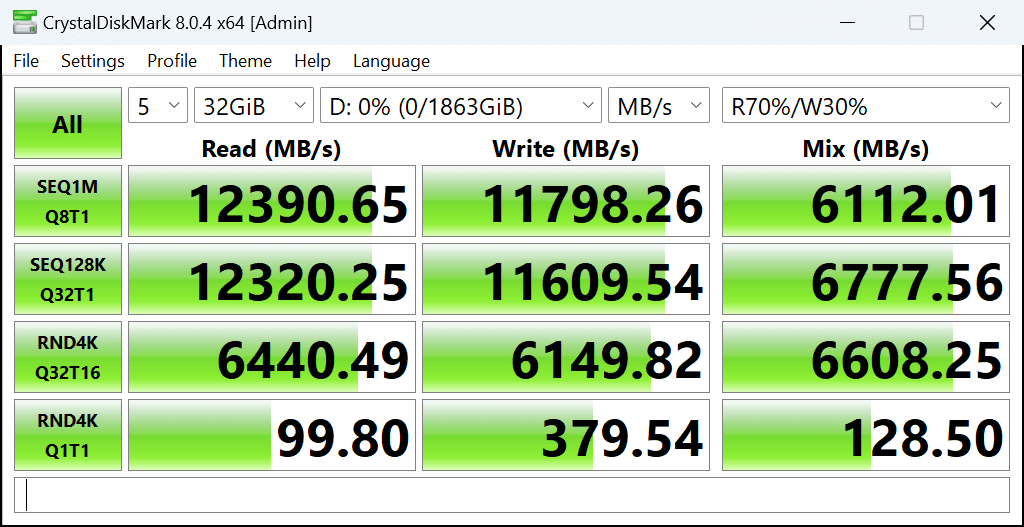
Compared to the others, the Z540 came in second for write speeds, just behind the MP700 Pro SE, but it was slightly more contested regarding read speeds. For read, the Z540 was behind the MP700 Pro SE and the T705 but was still ahead of the other two by a good margin. We had no data on the Gen4 drives in this test, so they were left out for this round.
| Crystal Disk Mark | T-Force Z540 | Corsair MP700 Pro SE | Gigabyte Aorus 12000 | Seagate Firecuda 540 | Crucial T705 |
|---|---|---|---|---|---|
| Write | 11.8 GB/s | 12.21 GB/s | 9.5 GB/s | 10.09 GB/s | 4.02 GB/s |
| Read | 12.39 GB/s | 14.12 GB/s | 11.7 GB/s | 10.17 GB/s | 14.05 GB/s |
Blackmagic Disk Speed Test
Our final test for the Z540 is the Blackmagic Disk Speed Test. This is a single-threaded test, so we will see lower performance than other tests. Other tests like CrystalDiskMark are multithreaded, allowing drives to show their full potential. Here, we saw 9,633.9 MB/s write and 7,451.3 MB/s read from the Z540.
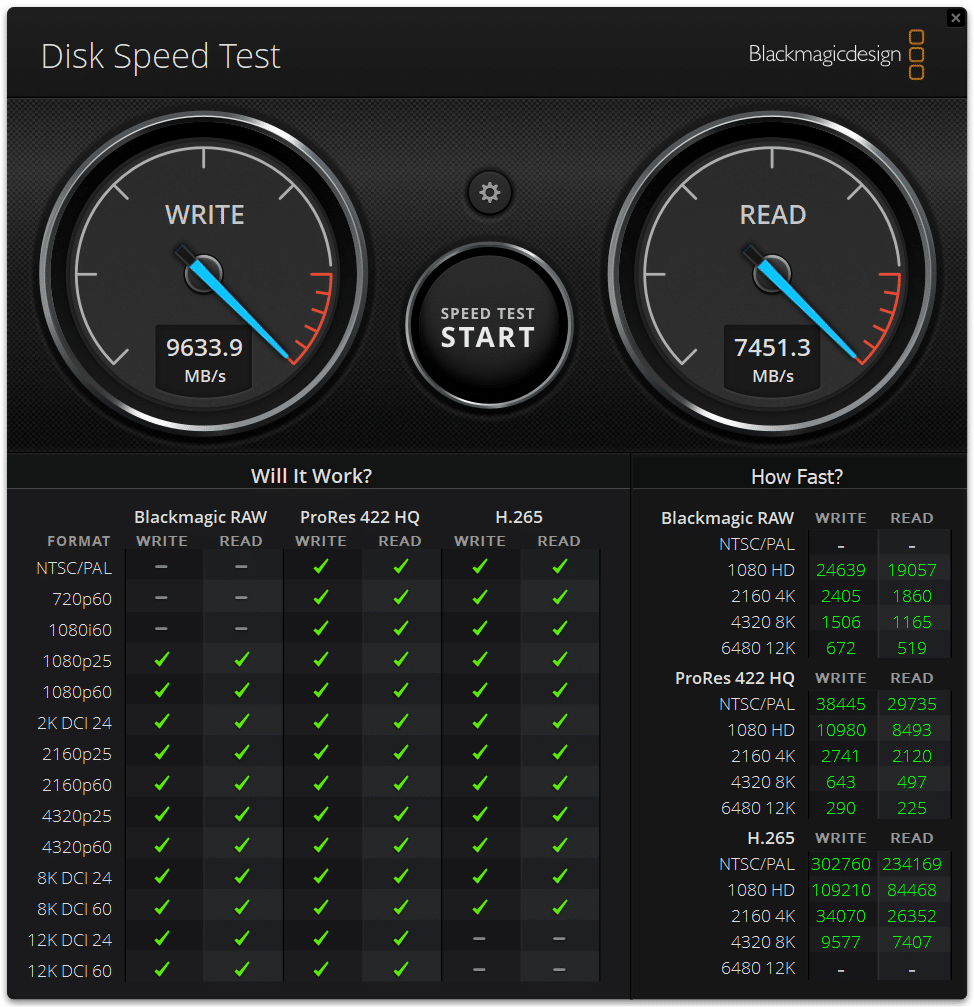
Compared to the other drives, the Z540 held up pretty well on write, which wasn’t quite at the top but sat about in the middle. The MP700 Pro SE took the lead, with the T705 next and the Z540 following behind, but only about 250 MB/s behind the lead. On read speeds, the Z540 was almost the slowest of the Gen5 drives but was just ahead of the Firecuda 540.
| Disk Speed Test | T-Force Z540 | Corsair MP700 Pro SE | Gigabyte Aorus 12000 | Samsung 990 Pro (Gen4) | Seagate Firecuda 540 | Crucial T705 | Solidigm P44 Pro (Gen4) |
|---|---|---|---|---|---|---|---|
| Write | 9,633.9 MB/s | 9,881.2 MB/s | 9,113.3 MB/s | 5,917.3 MB/s | 9,575.6 MB/s | 9,823.2 MB/s | 5,839.9 MB/s |
| Read | 7,451.3 MB/s | 8,523.3 MB/s | 7,491.3 MB/s | 5,758.7 MB/s | 6,746.5 MB/s | 8,568.1 MB/s | 6,029.1 MB/s |
Conclusion
The Teamgroup T-Force Z540 may not be the heaviest-hitting drive we compared it with, but it’s undoubtedly not pulling any punches. The Z540 held its own pretty well throughout our tests, usually staying towards the mid-front of the group and sometimes taking the lead. Most of the time, it competed head-to-head with the Corsair MP700 Pro SE or the Crucial T705.
At its current pricing, the Z540 isn’t the best value for its performance, but it isn’t egregious either. However, with a sale or gradual price reduction, this may become the best option for purchase. If you are in the market for a solid Gen5 M.2 SSD, the Z540 is worth looking at.
Teamgroup T-Force Z540 Product Page
Engage with StorageReview
Newsletter | YouTube | Podcast iTunes/Spotify | Instagram | Twitter | TikTok | RSS Feed