
 Samsung has moved into the market that aims to fill the gap between system memory and storage with its new 983 ZET SSD. So far in this arena we’ve seen, not necessarily the most performant drives, but drives with very low latency. The 983 ZET is an NVMe SSD designed specifically for low latency (with claims Quality of Service (QoS) read/writes of up to 0.03ms at a minimal 20μs latency) for high-performance computing applications as well as emerging technologies that are becoming more common such as AI and IoT.
Samsung has moved into the market that aims to fill the gap between system memory and storage with its new 983 ZET SSD. So far in this arena we’ve seen, not necessarily the most performant drives, but drives with very low latency. The 983 ZET is an NVMe SSD designed specifically for low latency (with claims Quality of Service (QoS) read/writes of up to 0.03ms at a minimal 20μs latency) for high-performance computing applications as well as emerging technologies that are becoming more common such as AI and IoT.
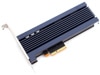
The Samsung 983 ZET leverages a half-height, half-length (HHHL) form factor with PCIe Gen3 x4, NVMe 1.2 interface. Somewhat surprising here is that the drive is built off of Samsung's V-NAND (despite initial Z-NAND marketing) as opposed to some new NAND technology. V-NAND is no slouch when it comes to performance; in fact it tends to lead the field in the testing we’ve done. V-NAND has also proven itself thoroughly for performance, reliability, and overall quality. On the performance side, the 983 ZET is quoted to deliver up to 3.4GB/s and 3GB/s sequential read/write speed, respectively, as well as up to 750K IOPS and 60K IOPS random read/writes, respectively.
For our review of the Samsung 983 ZET we will be testing both the 480GB and the 960GB capacities. At the time of this writing these are the only two capacities offered and again mirror the trend in the gap between memory and storage we’ve seen thus far.
Samsung 983 ZET Specifications
|
Form Factor |
Half Height Half Length (HHHL) |
|
Capacity |
480GB, 960GB |
|
Interface |
PCI Express Gen3 x4, NVMe 1.2 |
|
NAND Type |
Samsung Low Latency V-NAND |
|
Operating Temperature |
0-55 deg C |
|
Performance |
|
|
Sequential Read |
Up to 3,400 MB/s |
|
Sequential Write |
Up to 3,000 MB/s |
|
Random Read (4KB, QD32) |
Up to 750,000 IOPS |
|
Random Write (4KB, QD32) |
Up to 60,000 IOPS |
|
Endurance |
|
|
Life Expectancy |
2.0 Million Hours MTBF |
|
Shock |
1500G, duration 0.5 ms, Half Sine Wave |
|
Special Feature |
|
|
Encryption Support |
AES 256-bit |
|
Power Consumption |
|
|
Active Read |
Typ. Up to 8.5 W |
|
Active Write |
Typ. Up to 9.0 W |
|
Idle |
Up to 5.5 W |
|
Warranty |
|
|
480GB |
5 Year or 8.5 DWPD |
|
960GB |
5 Year or 10 DWPD |
Design and Build
The Samsung 983 ZET SSD’s sport the half-height half-length add-in card (HHHL AIC) form factor. The top of the drive utilizes a ventilated design to protect the internal components from overheating.
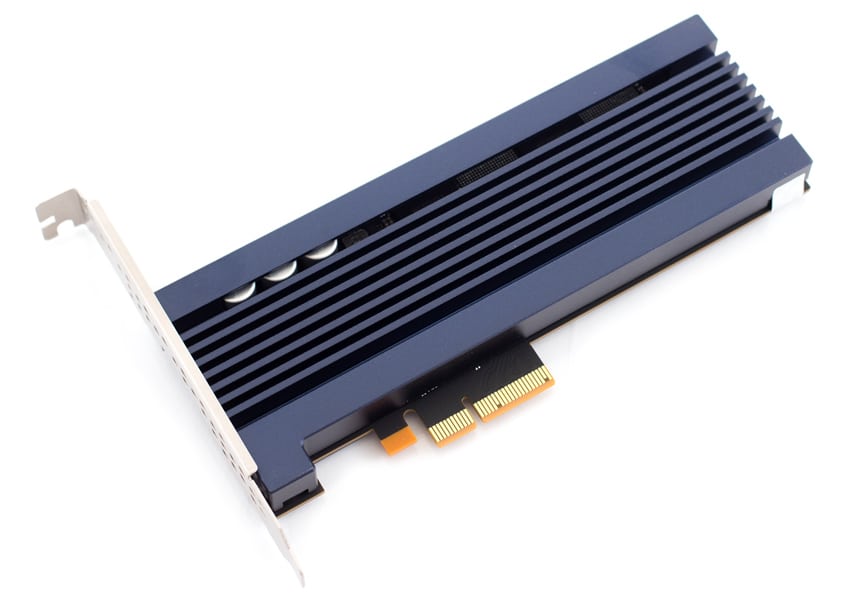
On the bottom of the drive, you’ll find the sticker, which displays the drives information, such as the name, model number, etc. The drive uses a PCI Express Gen3 x4, NVMe 1.2 interface and fits in both full-height and half-height PCIe slots.
Performance
Testbed
Our Enterprise SSD reviews leverage a Lenovo ThinkSystem SR850 for application tests and a Dell PowerEdge R740xd for synthetic benchmarks. The ThinkSystem SR850 is a well-equipped quad-CPU platform, offering CPU power well in excess of what's needed to stress high-performance local storage. Synthetic tests that don't require a lot of CPU resources use the more traditional dual-processor server. In both cases, the intent is to showcase local storage in the best light possible that aligns with storage vendor maximum drive specs.
Lenovo ThinkSystem SR850
- 4 x Intel Platinum 8160 CPU (2.1GHz x 24 Cores)
- 16 x 32GB DDR4-2666Mhz ECC DRAM
- 2 x RAID 930-8i 12Gb/s RAID Cards
- 8 NVMe Bays
- VMware ESXI 6.5
Dell PowerEdge R740xd
- 2 x Intel Gold 6130 CPU (2.1GHz x 16 Cores)
- 16 x 16GB DDR4-2666MHz ECC DRAM
- 1x PERC 730 2GB 12Gb/s RAID Card
- Add-in NVMe Adapter
- Ubuntu-16.04.3-desktop-amd64
Testing Background and Comparables
The StorageReview Enterprise Test Lab provides a flexible architecture for conducting benchmarks of enterprise storage devices in an environment comparable to what administrators encounter in real deployments. The Enterprise Test Lab incorporates a variety of servers, networking, power conditioning, and other network infrastructure that allows our staff to establish real-world conditions to accurately gauge performance during our reviews.
We incorporate these details about the lab environment and protocols into reviews so that IT professionals and those responsible for storage acquisition can understand the conditions under which we have achieved the following results. None of our reviews are paid for or overseen by the manufacturer of equipment we are testing. Additional details about the StorageReview Enterprise Test Lab and an overview of its networking capabilities are available on those respective pages.
Main comparables for this review:
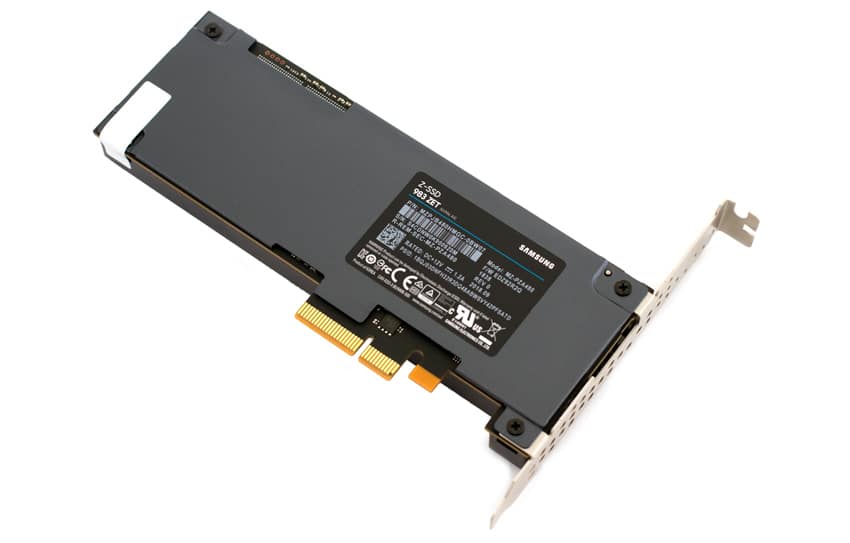
Houdini by SideFX
The Houdini test is specifically designed to evaluate storage performance as it relates to CGI rendering. The test bed for this application is a variant of the core Dell PowerEdge R740xd server type we use in the lab with dual Intel 6130 CPUs and 64GB DRAM. In this case, we installed Ubuntu Desktop (ubuntu-16.04.3-desktop-amd64) running bare metal. Output of the benchmark is measured in seconds to complete, with fewer being better.
The Maelstrom demo represents a section of the rendering pipeline that highlights the performance capabilities of storage by demonstrating its ability to effectively use the swap file as a form of extended memory. The test does not write out the result data or process the points in order to isolate the wall-time effect of the latency impact to the underlying storage component. The test itself is composed of five phases, three of which we run as part of the benchmark, which are as follows:
- Loads packed points from disk. This is the time to read from disk. This is single threaded, which may limit overall throughput.
- Unpacks the points into a single flat array in order to allow them to be processed. If the points do not have dependency on other points, the working set could be adjusted to stay in-core. This step is multi-threaded.
- (Not Run) Process the points.
- Repacks them into bucketed blocks suitable for storing back to disk. This step is multi-threaded.
- (Not Run) Write the bucketed blocks back out to disk.
The Samsung 983 ZET family disrupted the total Intel Optane reign in our Houdini benchmark, outperforming the 900P 280GB and both of the drives in the 800P class. While it didn’t outperform the P4800X and 900P 480GB, it’s nice to see a drive that brings the Optane family some competition.
Overall, the Samsung 983 ZET 480GB and 960GB performed excessively well, taking the third and fourth with the 960GB at 1,618.9 seconds and the 480GB at 1,666.4 seconds.
VDBench Workload Analysis
When it comes to benchmarking storage devices, application testing is best, and synthetic testing comes in second place. While not a perfect representation of actual workloads, synthetic tests do help to baseline storage devices with a repeatability factor that makes it easy to do apples-to-apples comparison between competing solutions. These workloads offer a range of different testing profiles ranging from "four corners" tests, common database transfer size tests, to trace captures from different VDI environments. All of these tests leverage the common vdBench workload generator, with a scripting engine to automate and capture results over a large compute testing cluster. This allows us to repeat the same workloads across a wide range of storage devices, including flash arrays and individual storage devices. Our testing process for these benchmarks fills the entire drive surface with data, then partitions a drive section equal to 25% of the drive capacity to simulate how the drive might respond to application workloads. This is different than full entropy tests which use 100% of the drive and take them into steady state. As a result, these figures will reflect higher-sustained write speeds.
Profiles:
- 4K Random Read: 100% Read, 128 threads, 0-120% iorate
- 4K Random Write: 100% Write, 64 threads, 0-120% iorate
- 64K Sequential Read: 100% Read, 16 threads, 0-120% iorate
- 64K Sequential Write: 100% Write, 8 threads, 0-120% iorate
- Synthetic Database: SQL and Oracle
- VDI Full Clone and Linked Clone Traces
In our first VDBench Workload Analysis, we looked at random 4K read performance. Here, the Samsung 983 ZET 960GB and 480GB models had virtually identical outcomes at 794,946.8 IOPS and 795,418.3 IOPS successfully moving them ahead of the competitive Optane drives. Looking at latency, both drives started around 21.5μs at 159K IOPS and stayed under 50μs until they broke 700K IOPS.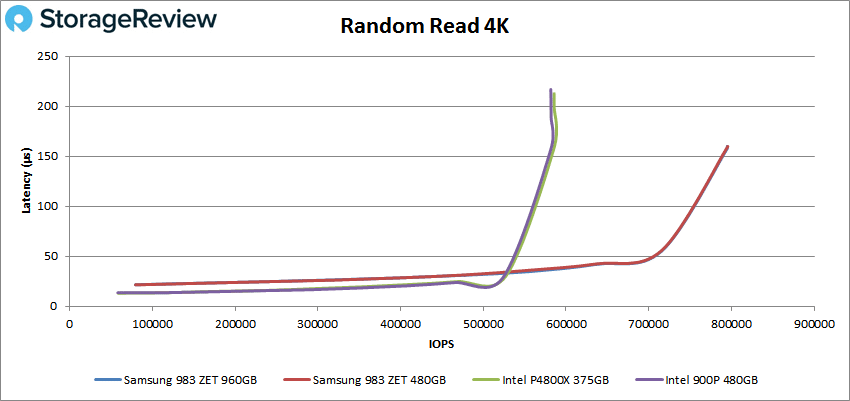
When looking at random 4K write, however, the Samsung drives sang a much different tune, falling significantly behind the Optane drives, with the 960GB model peaking at 215,560.8 IOPS and the 480GB model peaking at 189,288 IOPS. Here we saw latency for the 480GB start at 22.8μs at 18,690 IOPS and stay under 100μs until about 160K IOPS. The 960GB started at 20.2μs latency for 25,299 IOPS and stayed under 100μs until just over 200K IOPS. This is less than half the performance of the Optane drives at similar latency. 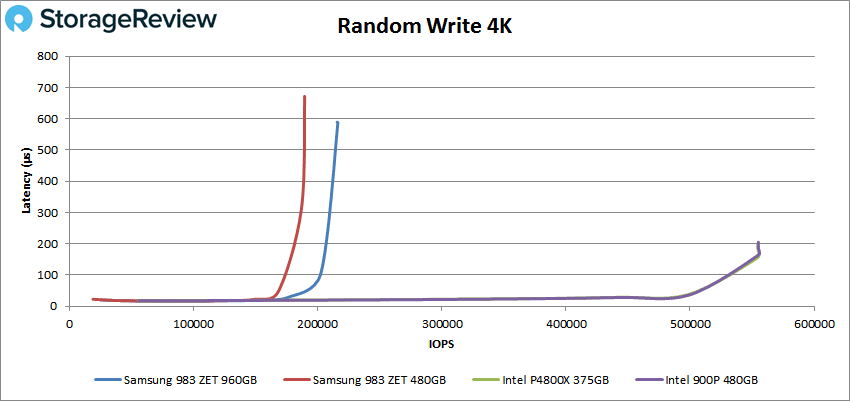
Moving on to sequential performance, we looked at our 64K benchmarks. In reads, the Samsung ZET’s stole the lead again with the 960GB peaking at 49,935.59 IOPS (3,120.975MB/s) and the 480GB with 50,171.39 IOPS (3,135.712MB/s). Here the 480GB started with a latency of 66.7μs at 5,094 IOPS or 318MB/s the drive stayed under 100μs until about 35K IOPS or 2.2GB/s. The 960GB started off with 5,003 IOPS or 312MB/s with a latency of 66.8μs and stayed under 100μs until about 35,000 IOPS or 2.2GB/s. While both drive types crossed the 100μs threshold at roughly the same time the Optane drives started with lower latency (around 47μs) and stayed lower than the Samsung. 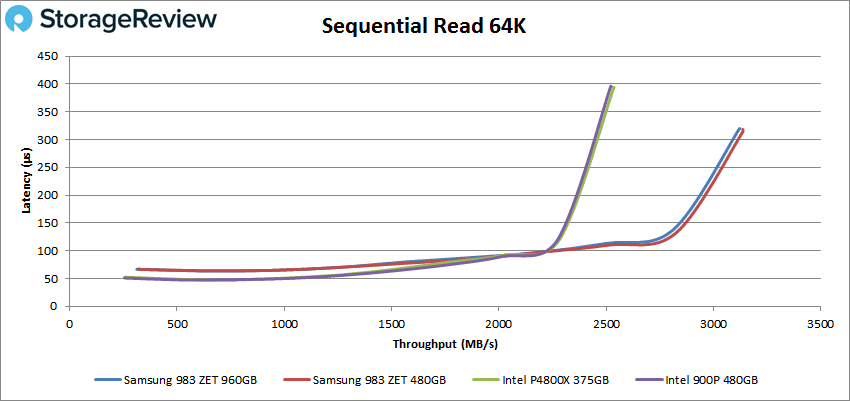
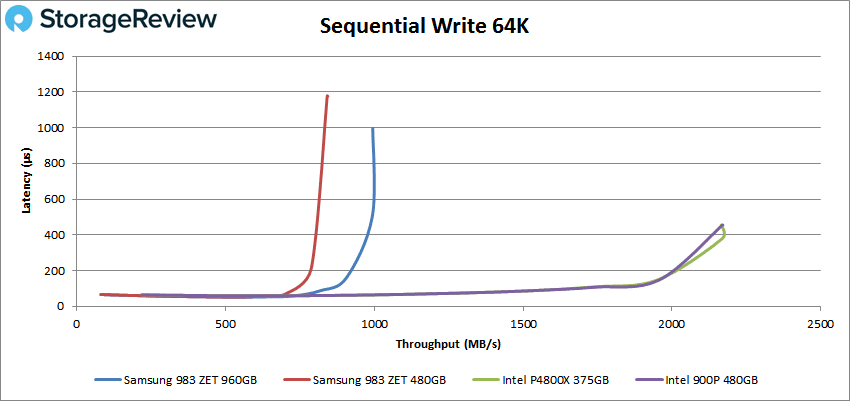
In sequential 64K write, the 480GB and 960GB ZET’s dropped to last again, showing 13,503.27 IOPS (843.95MB/s) and 15,921.94 IOPS (995.12MB/s) for the 480GB and 960GB respectively. The 480GB started with a latency of 66.3μs at 1,296 IOPS or 162MB/s; it stayed under 100μs until about 12K IOPS or 750MB/s. The 960GB started off with a latency of 65.1μs at 1,506 IOPS or 180MB/s and stayed under 100μs until about 14.6K IOPS or 830MB/s.
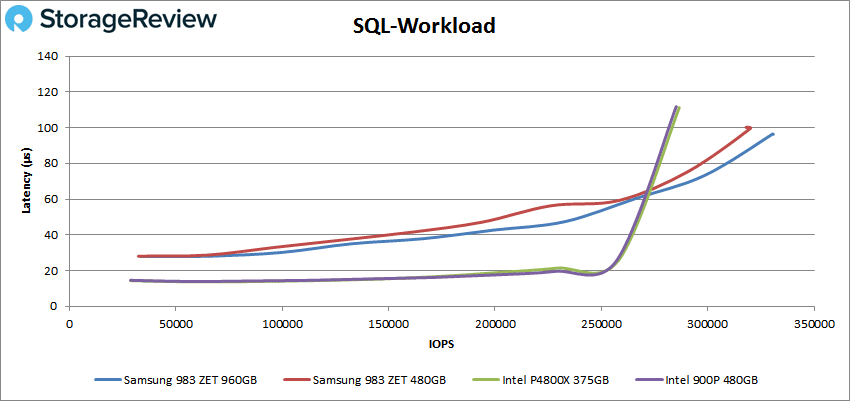
Next, we look at our SQL workload. Here, from a throughput perspective, the ZET drives are able to slightly edge out the Optane comparables in peak performance, but come in with a higher latency across the board. While the ZET offered an impressive 28μs latency and 32.2K IOPS off the bat, the Optane drives measured under 15μs. This gap widened as the loads picked up. So, while the ZET is no doubt faster than traditional NVMe SSD’s, it has trouble keeping up with the low latency offered from Optane. The 480GB ended with 320,007 IOPS with a latency of 99.6μs, and the 960GB with 330,432 IOPS with a latency of 96.4μs.
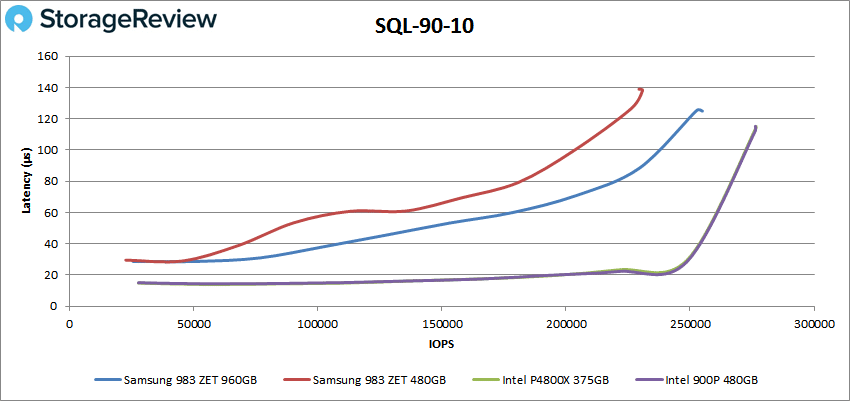
Moving on to SQL 90-10, the Samsungs started out below 30μs latency and 22.6K IOPS going on to peak at 230,838 IOPS for the 480GB (breaking 100μs around 200K IOPS) and 254,952 IOPS for the 960GB (breaking 100μs at about 240K IOPS). In both peak performance and overall latency, the ZET drives trailed the Optane drives, which stayed under 20μs until around 225K IOPS.
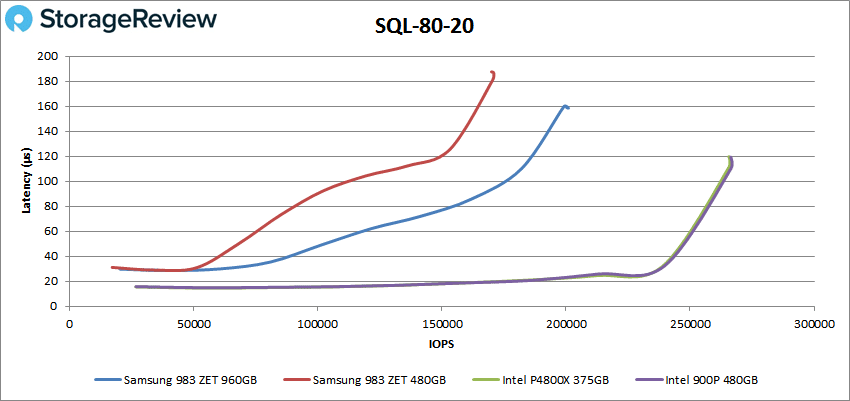
Looking at SQL 80-20, The ZET started out around 31μs for latency and 17K IOPS but once again fell way behind with the 480GB peaking at 170,899 IOPS, and the 960GB at 200,970 IOPS. The Samsung drives went above 100μs way before the Optane (that nearly finished the run under 100μs). The 480 went over 100μs at about 120K IOPS and the 960GB made it to about 181K IOPS.
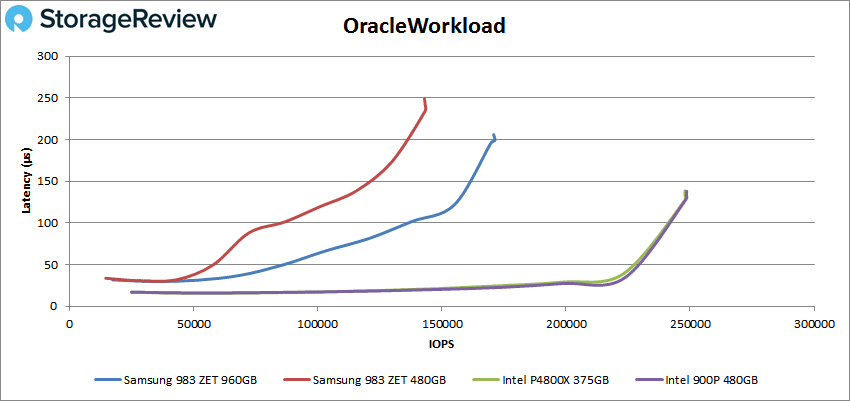
For our Oracle tests, the ZET drives started with latency around 30μs and 15K IOPS but held the rear again with yet another large amount of distance behind Intel. Here, the 480GB drive finished at a peak of 143,233 IOPS, and the 960GB at 171,327 IOPS. The 480GB went over 100μs at about 86.5K IOPS and the 9860 broke 100μs at roughly 136K IOPS.
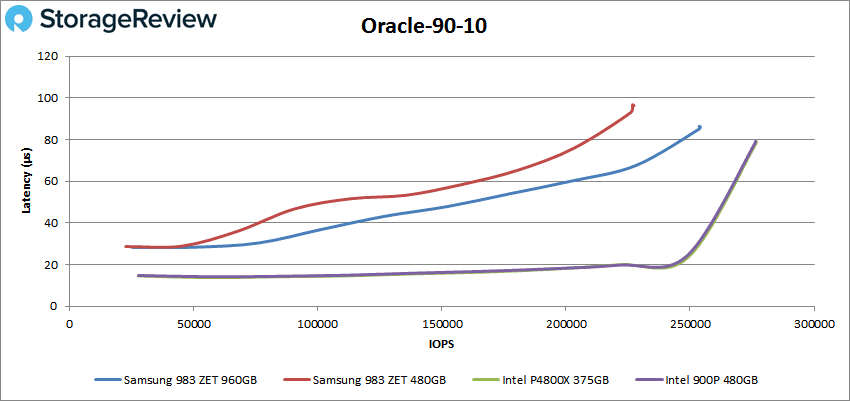
For Oracle 90-10, the ZET drives started beneath 30μs and 22.5K IOPS. The 480GB and 960GB ended with 226,739 IOPS at a latency of 96.3μs and 253,593.5 IOPS at a latency of 85.1μs, respectively.
On the Oracle 80-20 test, the ZET drives started off with 29.6μs at 17,498 IOPS for the 480GB and the 960GB had 27.9μs latency at 20,095 IOPS. The 480GB peaked at 173,989 IOPS and the 960GB at about 200K IOPS. Both Samsung drives were near their peak before breaking 100μs with the 480GB at about 158K IOPS and the 960GB at about 197K IOPS. The Optane drives had sub-20μs latency for a majority of their run. 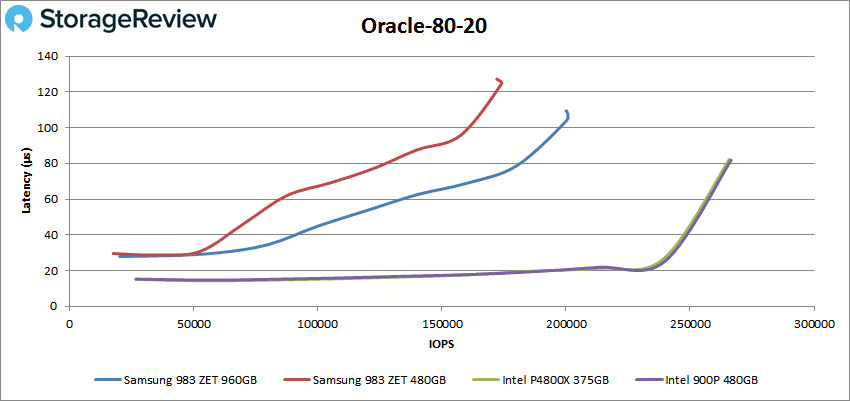
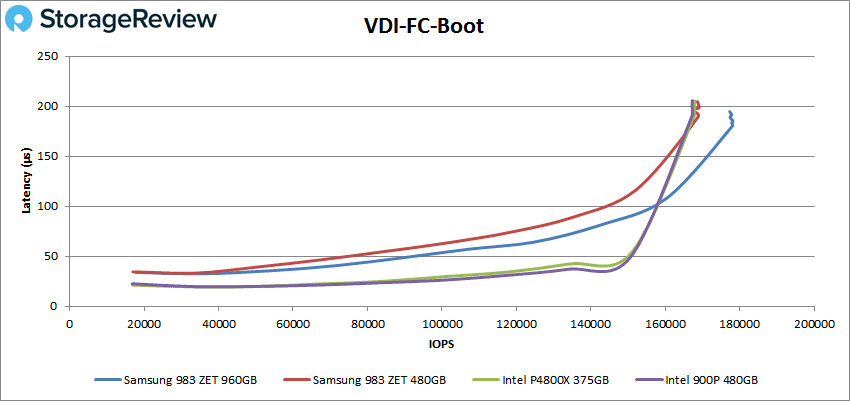
Next, we switched over to our VDI clone test, Full Clone (FC) and Linked Clone (LC). For VDI FC Boot, when looking at throughput, the ZET drives performed slightly better than the Optane drives. Again though, from a latency perspective, the ZET’s started off several microseconds behind (35μs to 22.7μs), and we see that gap widen as IOPS increase. The ZET drives finished with the 480GB at 168,652.8 IOPS and the 960GB at 177,326 IOPS. The 480GB ran under 100μs until about 145K IOPS and the 960GB went until about 160K IOPS.
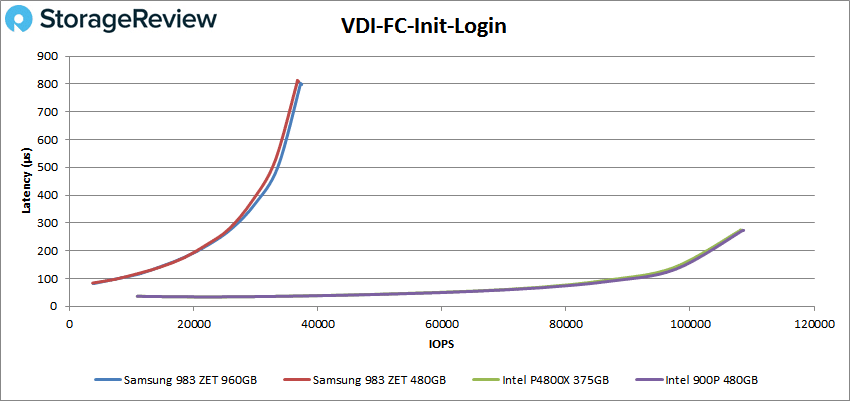
With VDI FC Initial Login, the Intel drives largely outperformed the ZET drives in both throughput and IOPS. The 480GB and 960GB ZET’s finished the test at 36,907.96 IOPS and 37,170.65 IOPS, respectively. The Samsung drives started at just under 100μs (84μs) and quickly rose above going on to their peaks.
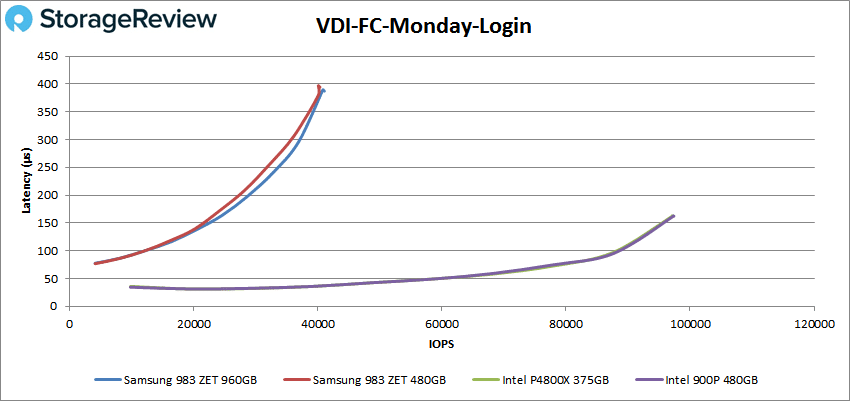
For the last Full Clone test, we look at VDI FC Monday Login. Here, the ZET drives paint a similar picture, where the Intel drives were the obvious winner. Falling way behind, the ZET 480GB finished with 40,327.82 IOPS and the 960GB with 41,044.6 IOPS. Again both drives started out just under 100μs (75μs at 4,095 IOPS) and quickly rose to their peaks.
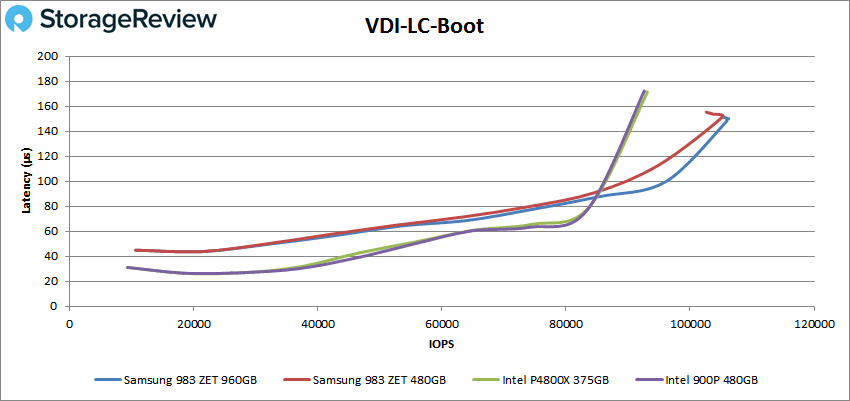
Moving on to VDI LC Boot, the ZET drives once again took to the top in terms of throughput, but with a higher latency throughout for the majority of the test. Here, the 480GB ZET posted a peak score of 102,590.5 IOPS at and the 960GB showing 105,330.2 IOPS. From a latency perspective, the Samsung drives started at 44.9μs at 10.6K IOPS (compared to the Intel’s 31.2μs at 9.2K IOPS) and went over 100μs at about 90K IOPS for the 480GB and 98K IOPS for the 960GB.
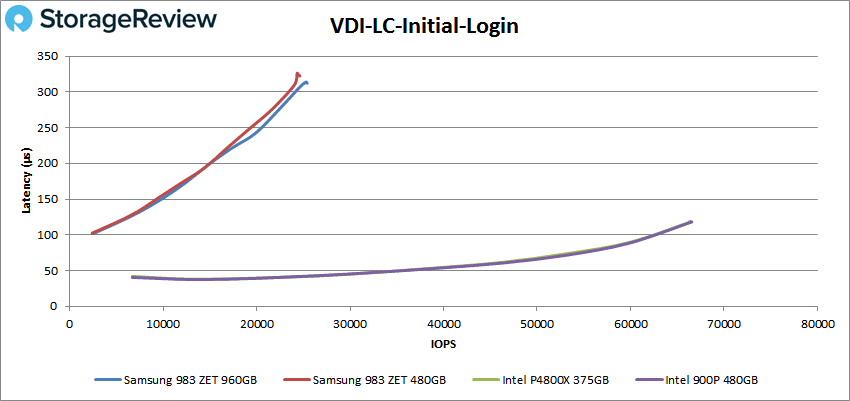
With VDI LC Initial Login, the ZET drives found themselves taking a distant last with the 480GB showing 24,545.35 IOPS and the 960GB at 25,410.64 IOPS. The drives started over 100μs latency at roughly 2,400 IOPS.
For our last test, VDI LC Monday Login, we see a similarly painted picture, with the ZET drives finishing last at 24,537.45 IOPS and 24,674.78 IOPS for the 480GB and 960GB drives, respectively. Again the drives started over 100μs.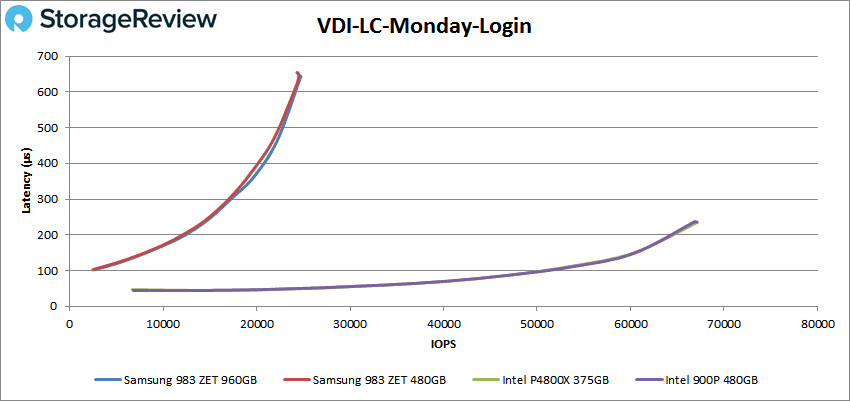
Conclusion
The Samsung 983 ZET is the company’s first foray into the market that sits between memory and storage. Like other similar products, the 983 ZET aims for low latency above all else but comes with strong performance claims of 3.4GB/s bandwidth and up to 750K IOPS throughput. The SSD leverages Samsung’s tried and true V-NAND and an NVMe interface. The 983 ZET is designed for high-performance computing applications as well as AI and IoT.
Due to the capacity of the drives we had to forgo our typical Applications Workload Analysis testing with the exception of the Houdini by SideFX. Here the Samsung 983 ZET was able to do something we had not seen before and unseat several of the Optane-based drives. The 960GB version was able to come in third with 1,618.9 seconds and the 480GB was right behind it with 1,666.4 seconds.
For our VDBech Workload Analysis we put it up against the Intel Optane P4800X and 900P, two other drives that would fall into this emerging high-speed storage category. Some of the highlights in overall performance include 795K IOPS in 4K read for both capacities, 3.1GB/s in 64K sequential reads for both, top place in SQL with 320K IOPS for 480GB and 330K IOPS for 960GB, 231K IOPS and 255K IOPS in SQL 90-10, 227K IOPS and 254K IOPS in Oracle 90-10, top place in our VDI FC Boot with 169K IOPS and 177K IOPS, and in our VDI LC Boot it hit 102K IOPS and 105K IOPS. While these are fairly good numbers, this type of technology is more geared around low latency. Here the 983 ZET had several shining moments including staying under 50μs in 4K read until it was over 700K IOPS, staying neck and neck with the Optane in 4K write until 190K IOPS or so, staying in sub 100μs in 64K read until 2.3GB/s, and running along with the Optane in 64K write until about 843MB/s. In our Oracle and SQL tests the latency was less impressive but tended to start around or under 30μs and peaked between 96.3μs and 243μs. While the drive trailed the Optane in most tests, it flat out crushes a "normal" NVMe drive in terms of latency.
Overall, the 983 ZET shows a commitment by Samsung to join Intel in offering a storage product that sits between system memory and traditional SSDs in terms of latency. While low latency V-NAND doesn't unseat Optane in these our tests with write workloads mixed in, we do see advantages in pockets such as read performance. The 983 ZET drives are able to offer an edge in peak read throughput, both small and large block, although at a higher overall response time. There is no doubt the 983 ZET offers a substantial improvement over traditional NVMe SSDs, putting the pressure back on pricing and capacity requirements.
Sign up for the StorageReview newsletter